| Param | Original file | Final file |
|---|---|---|
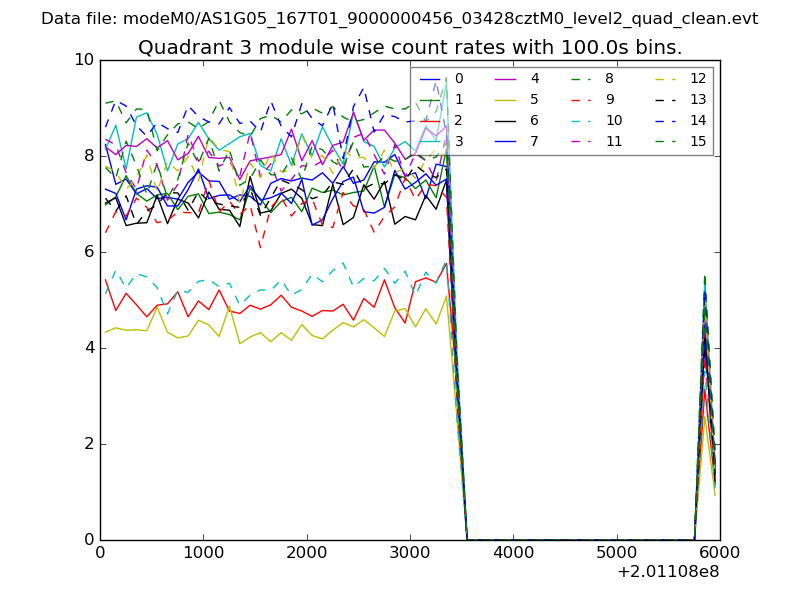
| Filename | modeM0/AS1G05_167T01_9000000456_03428cztM0_level2.evt | modeM0/AS1G05_167T01_9000000456_03428cztM0_level2_quad_clean.evt |
| Size (bytes) | 573,621,120 | 69,154,560 |
| Size | 547.0 MB | 66.0 MB |
| Events in quadrant A | 3,475,628 | 422,181 |
| Events in quadrant B | 4,255,687 | 420,959 |
| Events in quadrant C | 6,061,618 | 403,307 |
| Events in quadrant D | 3,151,565 | 406,861 |
| Mode M9 | |||
|---|---|---|---|
| Quadrant | BADHDUFLAG | Total packets | Discarded packets |
| A | 0 | 17 | 0 |
| B | 0 | 17 | 0 |
| C | 0 | 17 | 0 |
| D | 0 | 18 | 0 |
| Mode SS | |||
|---|---|---|---|
| Quadrant | BADHDUFLAG | Total packets | Discarded packets |
| A | 0 | 126 | 0 |
| B | 0 | 126 | 0 |
| C | 0 | 126 | 0 |
| D | 0 | 126 | 0 |
| Mode M0 | |||
|---|---|---|---|
| Quadrant | BADHDUFLAG | Total packets | Discarded packets |
| A | 0 | 14454 | 3 |
| B | 0 | 16904 | 2 |
| C | 0 | 22257 | 2 |
| D | 0 | 13680 | 2 |
| Quadrant | Total seconds | Saturated seconds | Saturation percentage |
|---|---|---|---|
| A | 6320 | 74 | 1.170886% |
| B | 6320 | 188 | 2.974684% |
| C | 6320 | 1015 | 16.060127% |
| D | 6320 | 75 | 1.186709% |
Noise dominated data is calculated using 1-second bins in cleaned event files. If a bin has >2000 counts, and if more than 50% of those come from <1% of pixels, then it is considered to be noise-dominated and hence unusable.
| Quadrant | # 1 sec bins | Bins with >0 counts | Bins with >2000 counts | High rate bins dominated by noise | Noise dominated (total time) | Noise dominated (detector-on time) | Marked lightcurve |
|---|---|---|---|---|---|---|---|
| A | 7545 | 6321 | 6 | 6 | 0.08% | 0.09% | 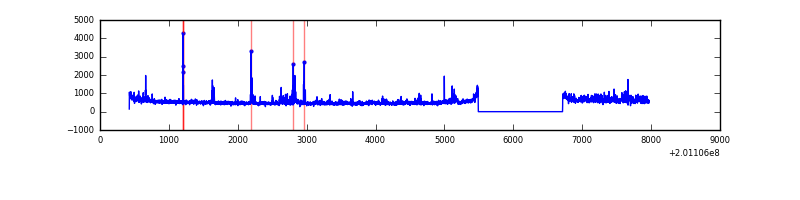 |
| B | 7545 | 6321 | 83 | 83 | 1.10% | 1.31% | 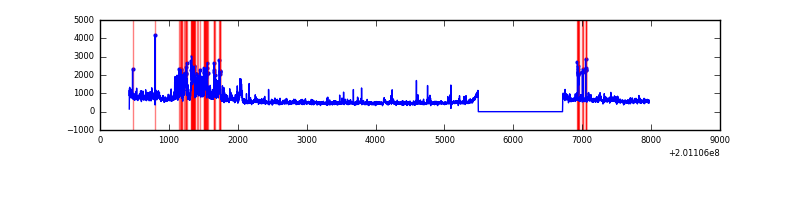 |
| C | 7545 | 6321 | 688 | 688 | 9.12% | 10.88% | 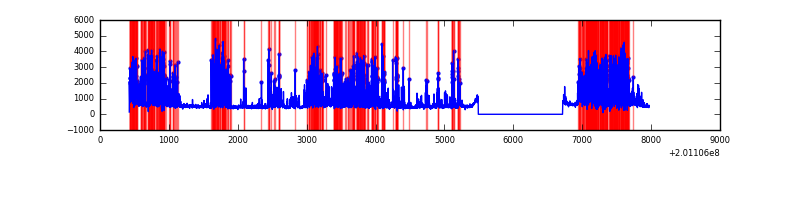 |
| D | 7545 | 6321 | 19 | 19 | 0.25% | 0.30% | 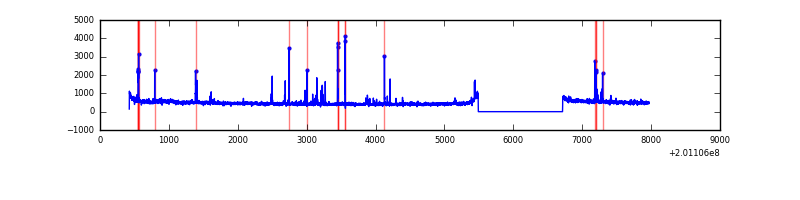 |
Top three noisy pixels from each quadrant. If the there are fewer than three noisy pixels in the level2.evt file, extra rows are filled as -1
| Pixel properties | Quadrant properties | ||||||
|---|---|---|---|---|---|---|---|
| Quadrant | DetID | PixID | Counts | Sigma | Mean | Median | Sigma |
| A | 8 | 15 | 223919 | 1381.88 | 793 | 779 | 161.5 |
| A | 14 | 249 | 126610 | 779.26 | 793 | 779 | 161.5 |
| A | 0 | 118 | 40436 | 245.59 | 793 | 779 | 161.5 |
| B | 15 | 204 | 558116 | 3619.2 | 801 | 785 | 154.0 |
| B | 14 | 167 | 473395 | 3069.04 | 801 | 785 | 154.0 |
| B | 6 | 203 | 47619 | 304.13 | 801 | 785 | 154.0 |
| C | 7 | 220 | 3111906 | 18671.91 | 721 | 729 | 166.6 |
| C | 15 | 208 | 58103 | 344.33 | 721 | 729 | 166.6 |
| C | 6 | 80 | 32085 | 188.18 | 721 | 729 | 166.6 |
| D | 13 | 223 | 75482 | 401.89 | 772 | 750 | 186.0 |
| D | 14 | 34 | 46981 | 248.62 | 772 | 750 | 186.0 |
| D | 12 | 246 | 35272 | 185.65 | 772 | 750 | 186.0 |
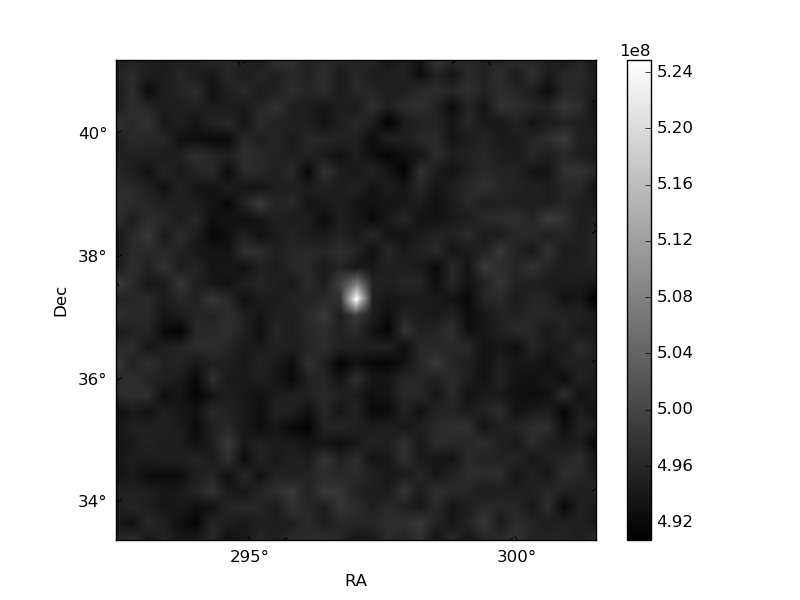
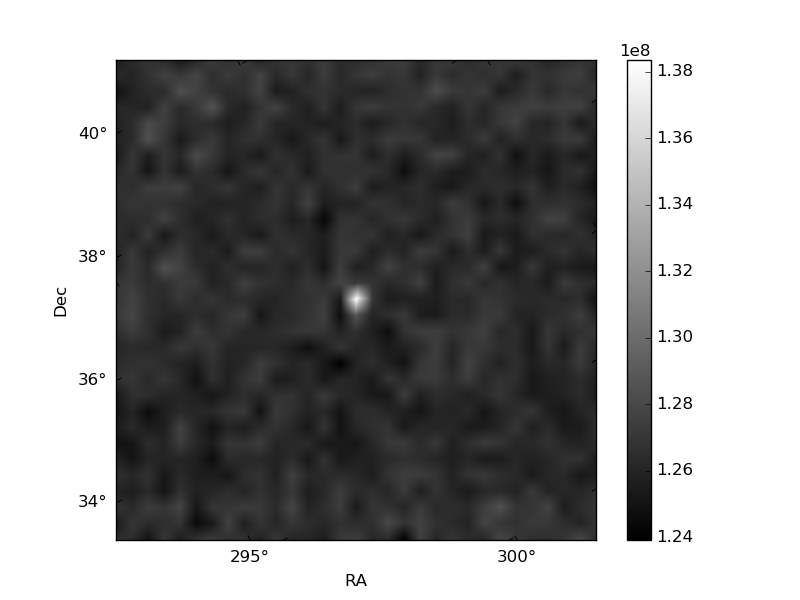
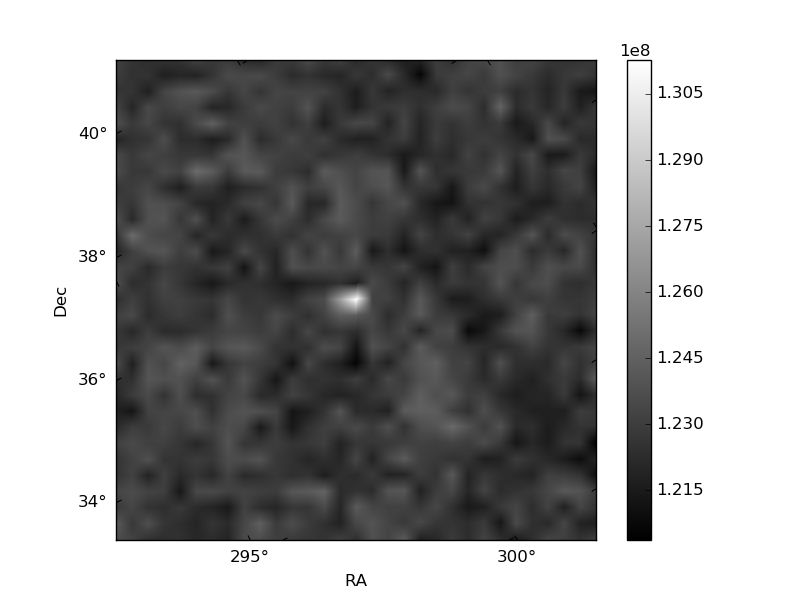
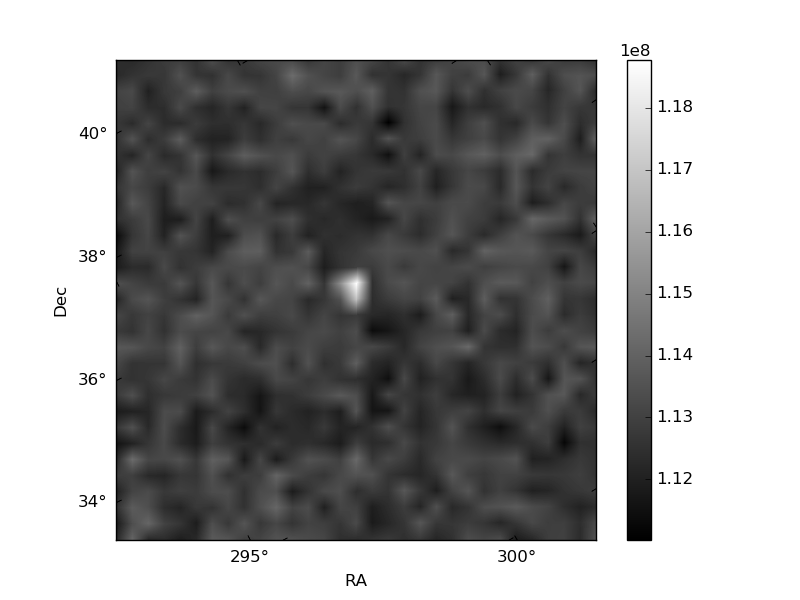
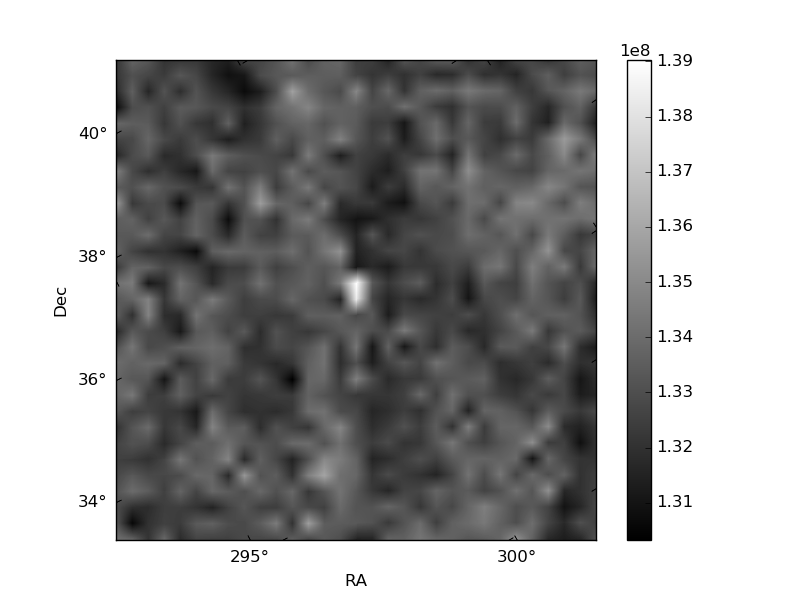
Histogram calculated using DETX and DETY for each event in the final _common_clean file
| Quadrant A | 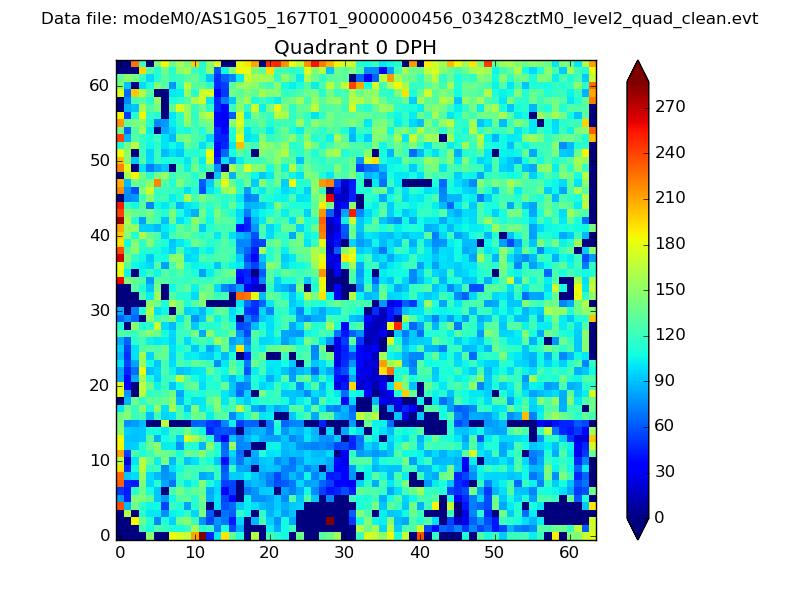 |
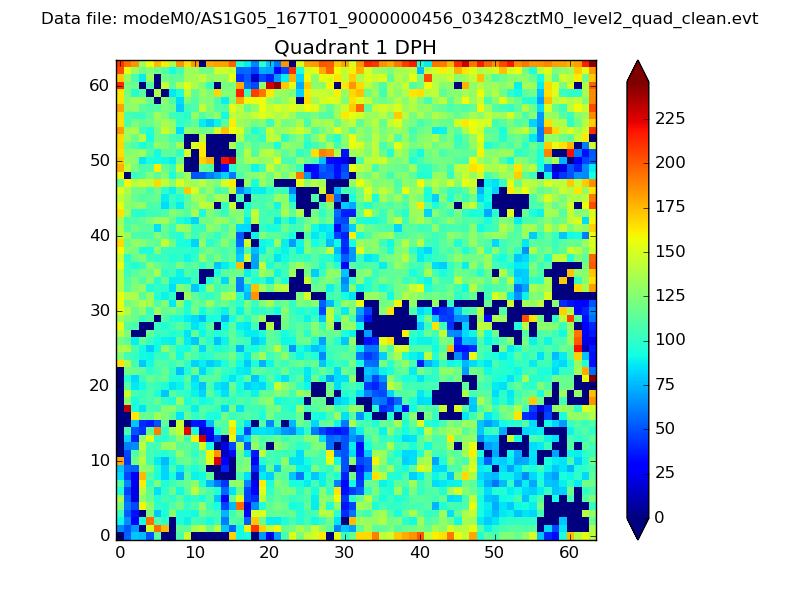 |
Quadrant B |
|---|---|---|---|
| Quadrant D | 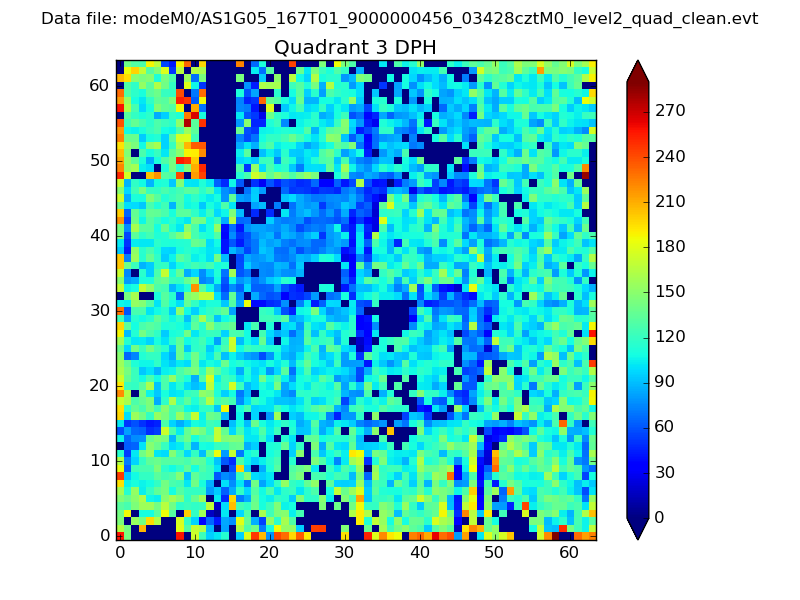 |
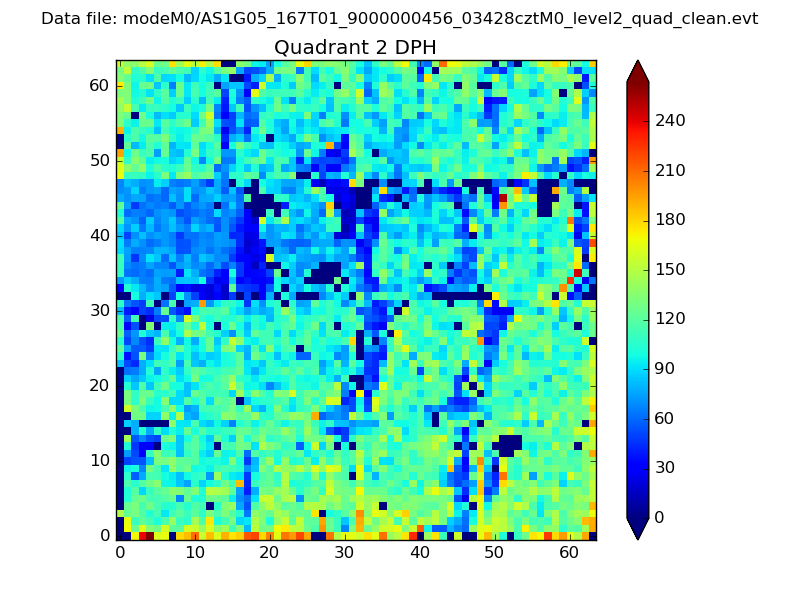 |
Quadrant C |
| Plot type | Count rate plots | Images |
|---|---|---|
| Comparison with Poisson distribution Blue bars denote a histogram of data divided into 1 sec bins. Red curve is a Poisson curve with rate = median count rate of data. |
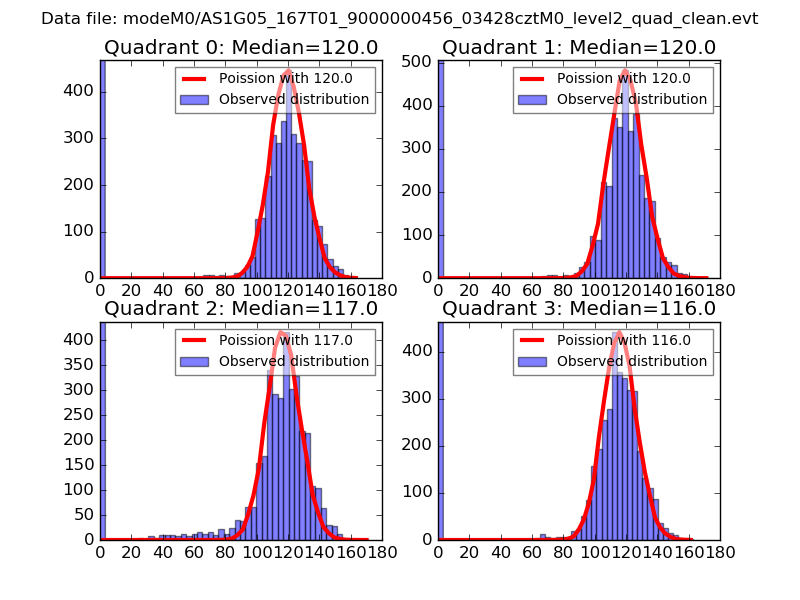 |
 |
| Quadrant-wise count rates Data is divided into 100 sec bins |
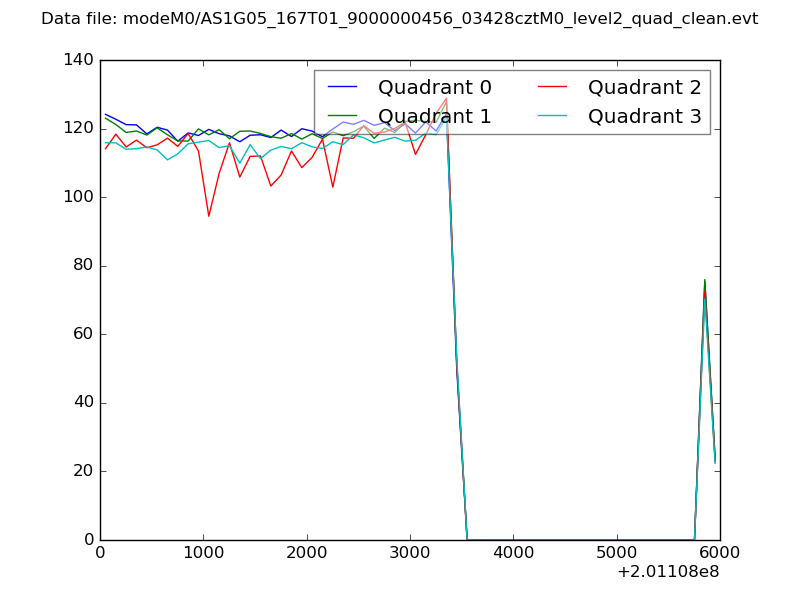 |
|
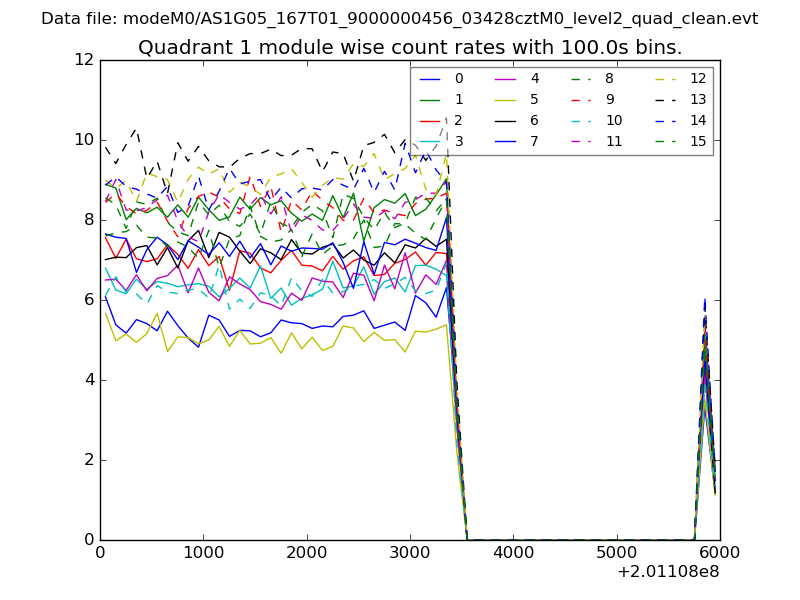
| Module-wise count rates for Quadrant A Data is divided into 100 sec bins |
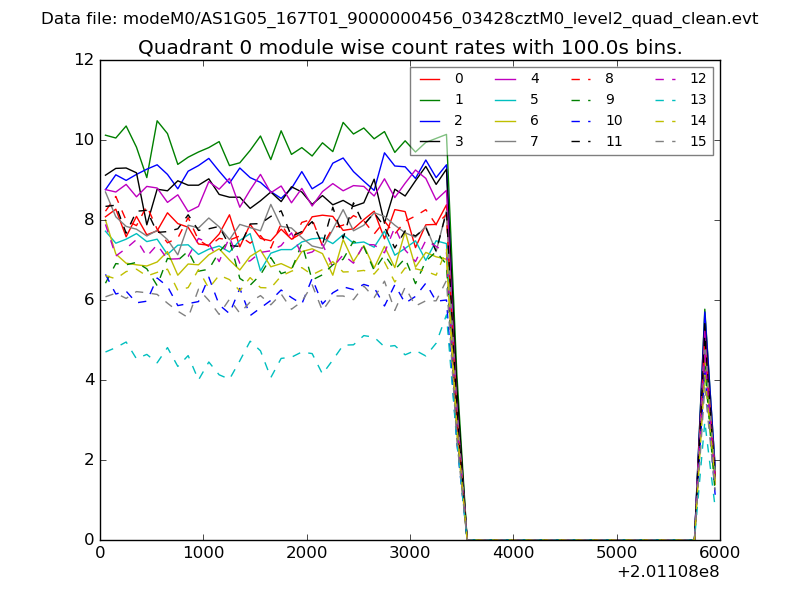 |
 |
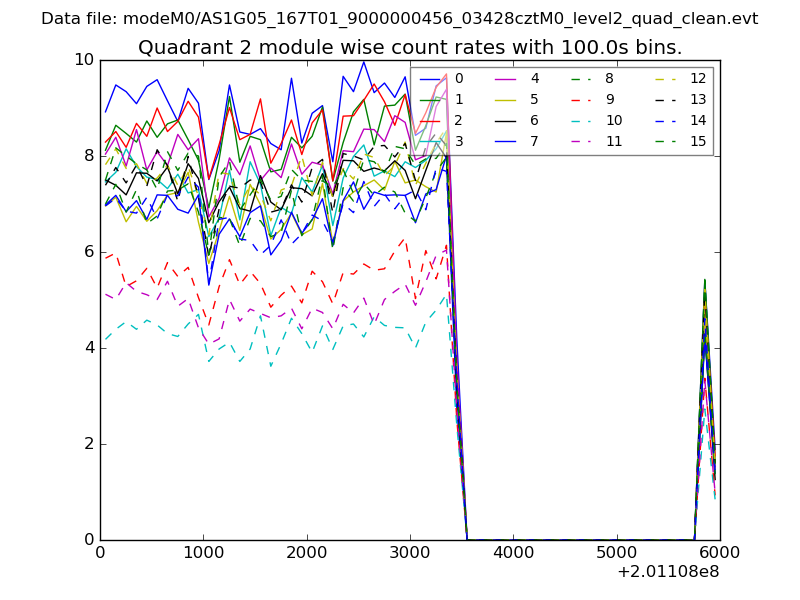
| Module-wise count rates for Quadrant B Data is divided into 100 sec bins |
 |
 |
| Module-wise count rates for Quadrant C Data is divided into 100 sec bins |
 |
 |
| Module-wise count rates for Quadrant D Data is divided into 100 sec bins |
 |
 |
| Parameter | Plot |
|---|---|
| CZT HV Monitor | 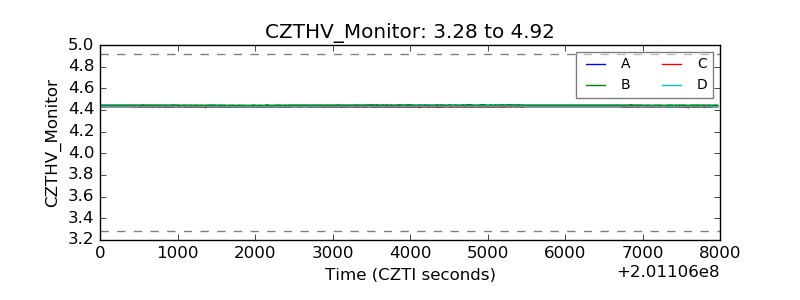 |
| D_VDD | 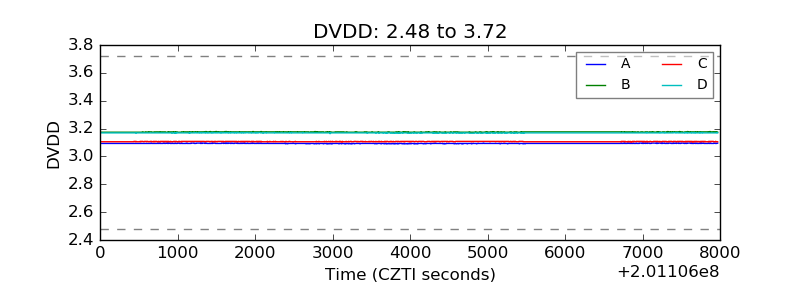 |
| Temperature 1 | 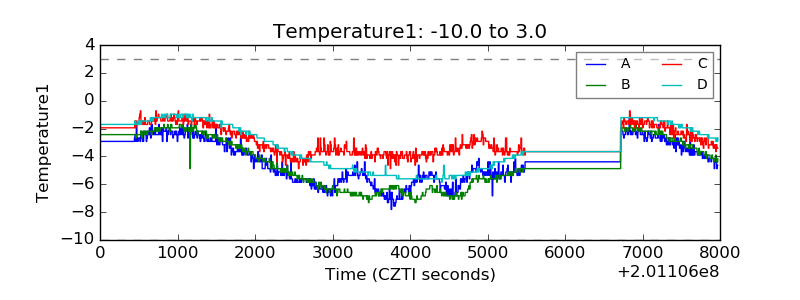 |
| Veto HV Monitor | 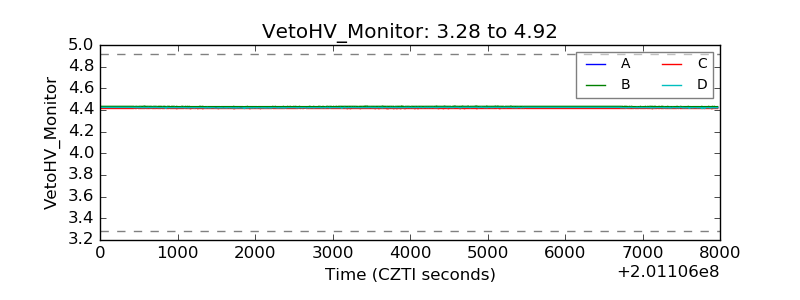 |
| Veto LLD | 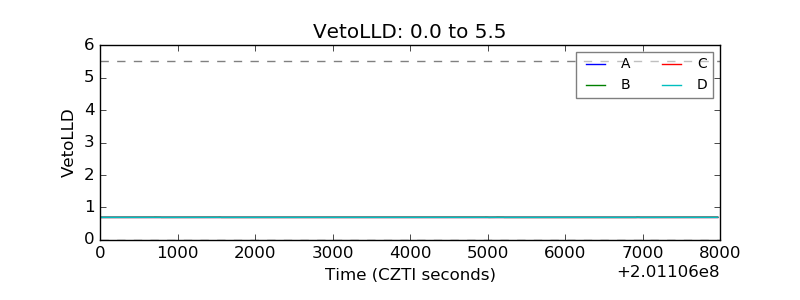 |
| Alpha Counter | 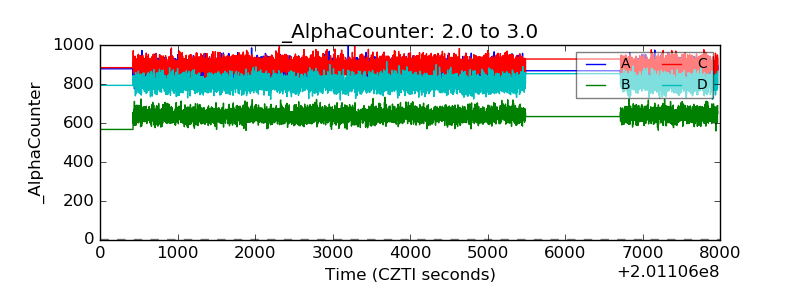 |
| _CPM_Rate | 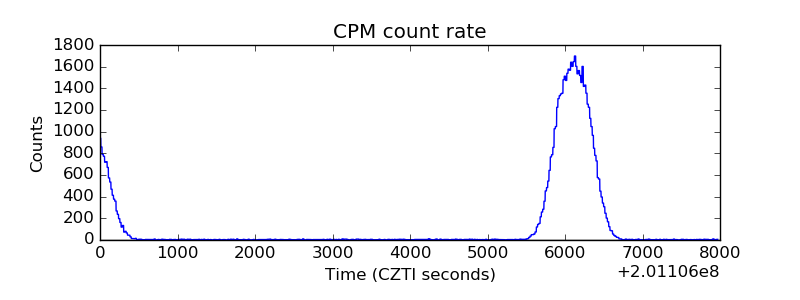 |
| CZT Counter | 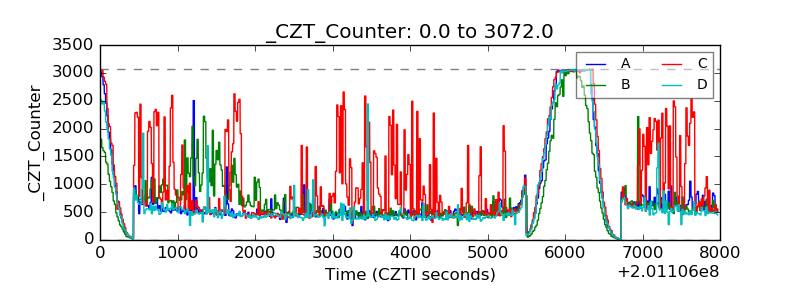 |
| +2.5 Volts monitor |  |
| +5 Volts monitor |  |
| _ROLL_ROT | 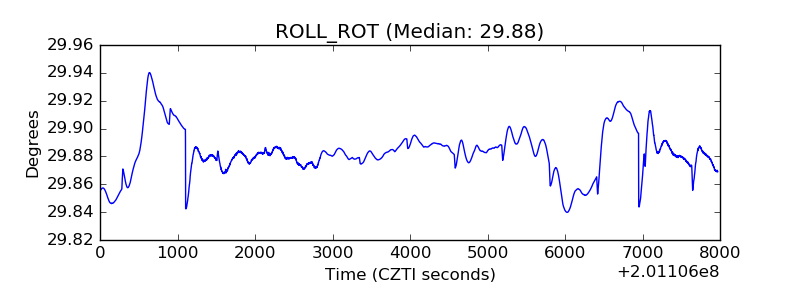 |
| _Roll_DEC | 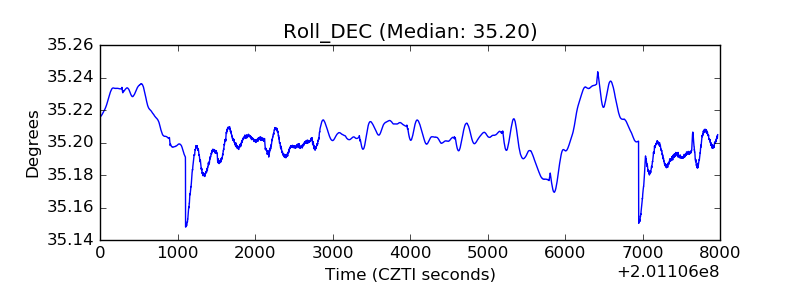 |
| _Roll_RA | 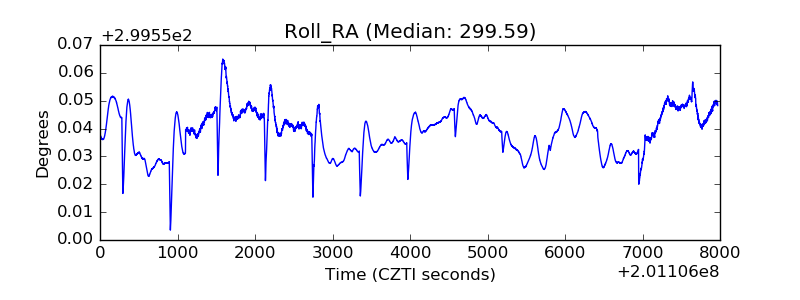 |
| Veto Counter | 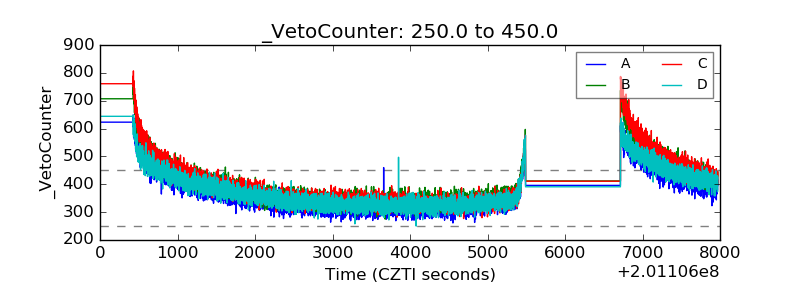 |