| Param | Original file | Final file |
|---|---|---|
| Filename | modeM0/AS1G05_167T01_9000000456_03429cztM0_level2.evt | modeM0/AS1G05_167T01_9000000456_03429cztM0_level2_quad_clean.evt |
| Size (bytes) | 536,944,320 | 84,104,640 |
| Size | 512.1 MB | 80.2 MB |
| Events in quadrant A | 3,807,347 | 537,100 |
| Events in quadrant B | 3,682,033 | 542,561 |
| Events in quadrant C | 5,198,841 | 514,105 |
| Events in quadrant D | 3,149,182 | 516,554 |
| Mode M9 | |||
|---|---|---|---|
| Quadrant | BADHDUFLAG | Total packets | Discarded packets |
| A | 0 | 13 | 0 |
| B | 0 | 13 | 0 |
| C | 0 | 13 | 0 |
| D | 0 | 13 | 0 |
| Mode SS | |||
|---|---|---|---|
| Quadrant | BADHDUFLAG | Total packets | Discarded packets |
| A | 0 | 126 | 0 |
| B | 0 | 126 | 0 |
| C | 0 | 126 | 0 |
| D | 0 | 126 | 0 |
| Mode M0 | |||
|---|---|---|---|
| Quadrant | BADHDUFLAG | Total packets | Discarded packets |
| A | 0 | 15276 | 3 |
| B | 0 | 15219 | 2 |
| C | 0 | 19618 | 2 |
| D | 0 | 13453 | 2 |
| Quadrant | Total seconds | Saturated seconds | Saturation percentage |
|---|---|---|---|
| A | 6258 | 121 | 1.933525% |
| B | 6258 | 107 | 1.709811% |
| C | 6258 | 797 | 12.735698% |
| D | 6258 | 74 | 1.182486% |
Noise dominated data is calculated using 1-second bins in cleaned event files. If a bin has >2000 counts, and if more than 50% of those come from <1% of pixels, then it is considered to be noise-dominated and hence unusable.
| Quadrant | # 1 sec bins | Bins with >0 counts | Bins with >2000 counts | High rate bins dominated by noise | Noise dominated (total time) | Noise dominated (detector-on time) | Marked lightcurve |
|---|---|---|---|---|---|---|---|
| A | 7533 | 6259 | 41 | 41 | 0.54% | 0.66% | 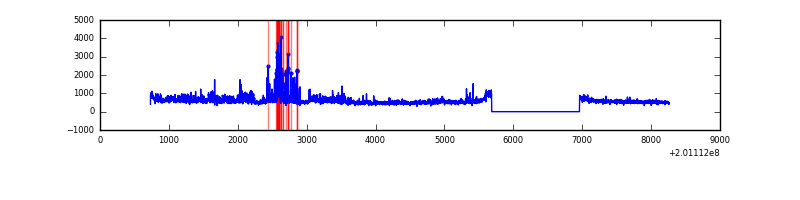 |
| B | 7533 | 6259 | 23 | 23 | 0.31% | 0.37% | 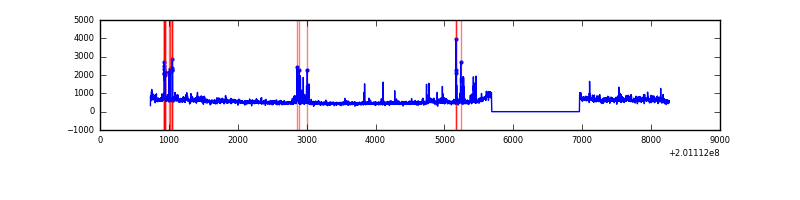 |
| C | 7533 | 6259 | 521 | 521 | 6.92% | 8.32% | 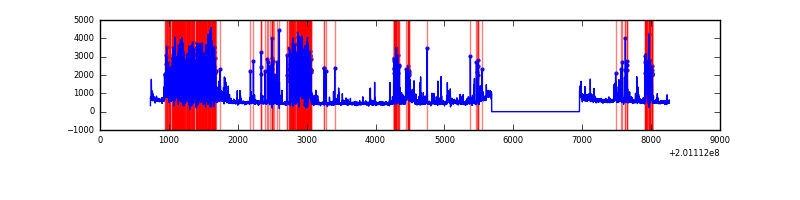 |
| D | 7533 | 6259 | 16 | 16 | 0.21% | 0.26% | 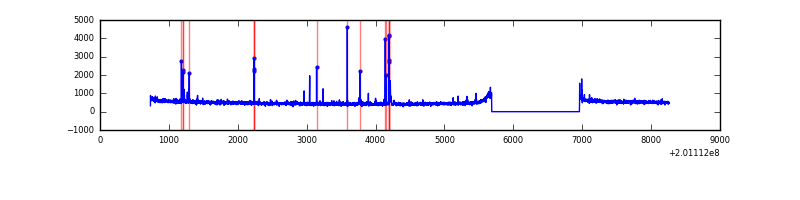 |
Top three noisy pixels from each quadrant. If the there are fewer than three noisy pixels in the level2.evt file, extra rows are filled as -1
| Pixel properties | Quadrant properties | ||||||
|---|---|---|---|---|---|---|---|
| Quadrant | DetID | PixID | Counts | Sigma | Mean | Median | Sigma |
| A | 8 | 15 | 434302 | 2665.38 | 804 | 790 | 162.6 |
| A | 14 | 249 | 244352 | 1497.5 | 804 | 790 | 162.6 |
| A | 0 | 118 | 15913 | 92.98 | 804 | 790 | 162.6 |
| B | 15 | 204 | 281961 | 1798.87 | 818 | 801 | 156.3 |
| B | 2 | 249 | 149054 | 948.53 | 818 | 801 | 156.3 |
| B | 6 | 203 | 47670 | 299.87 | 818 | 801 | 156.3 |
| C | 7 | 220 | 1941025 | 11132.79 | 751 | 758 | 174.3 |
| C | 1 | 192 | 250192 | 1431.19 | 751 | 758 | 174.3 |
| C | 15 | 208 | 44730 | 252.3 | 751 | 758 | 174.3 |
| D | 9 | 85 | 49804 | 261.66 | 787 | 768 | 187.4 |
| D | 13 | 223 | 43929 | 230.31 | 787 | 768 | 187.4 |
| D | 12 | 246 | 37506 | 196.04 | 787 | 768 | 187.4 |
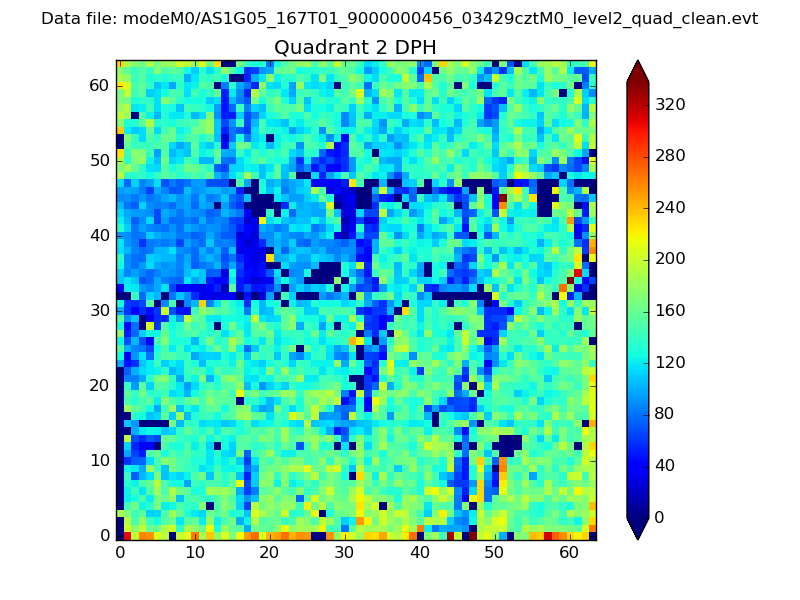
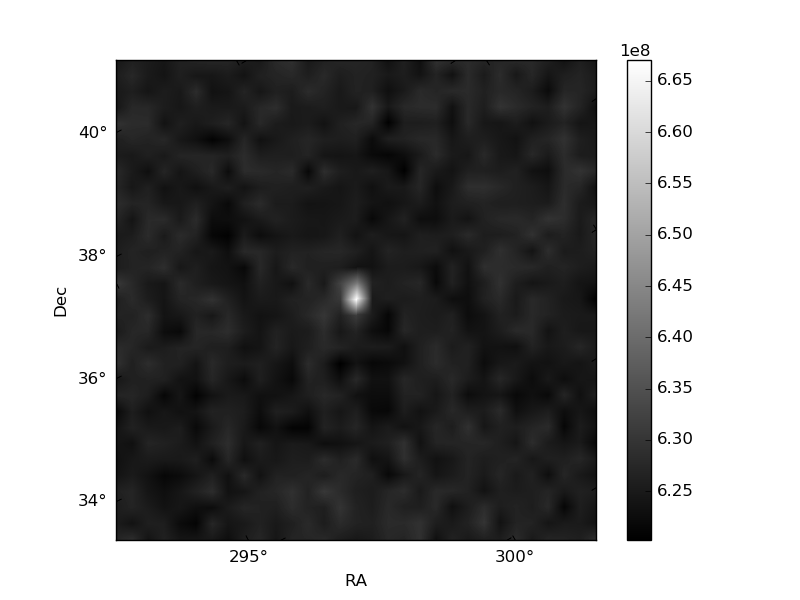
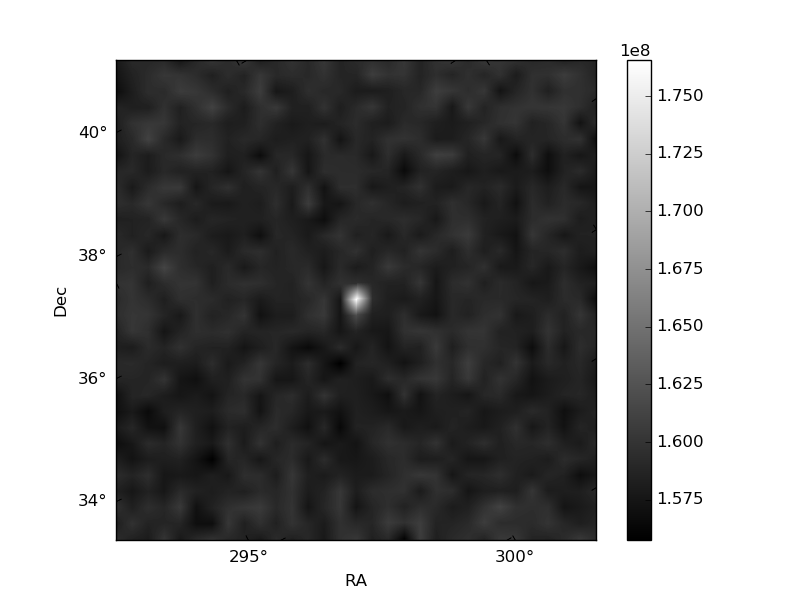
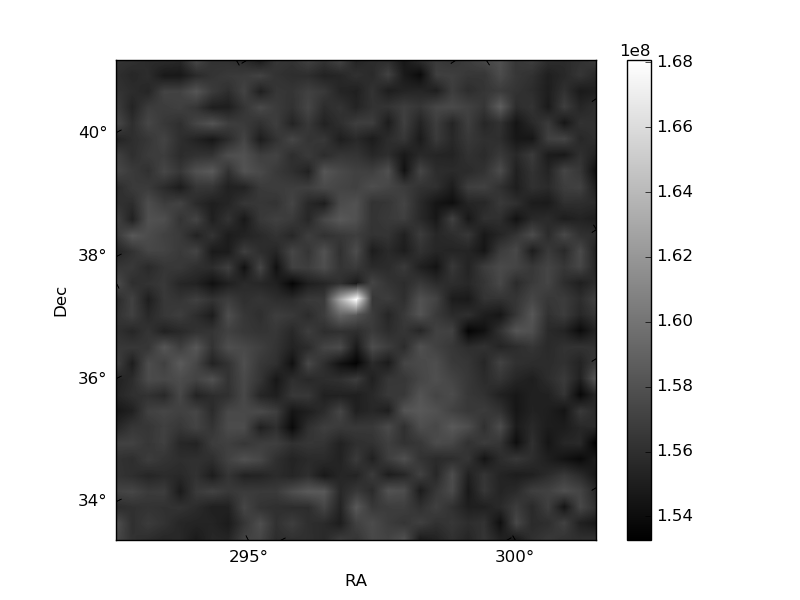
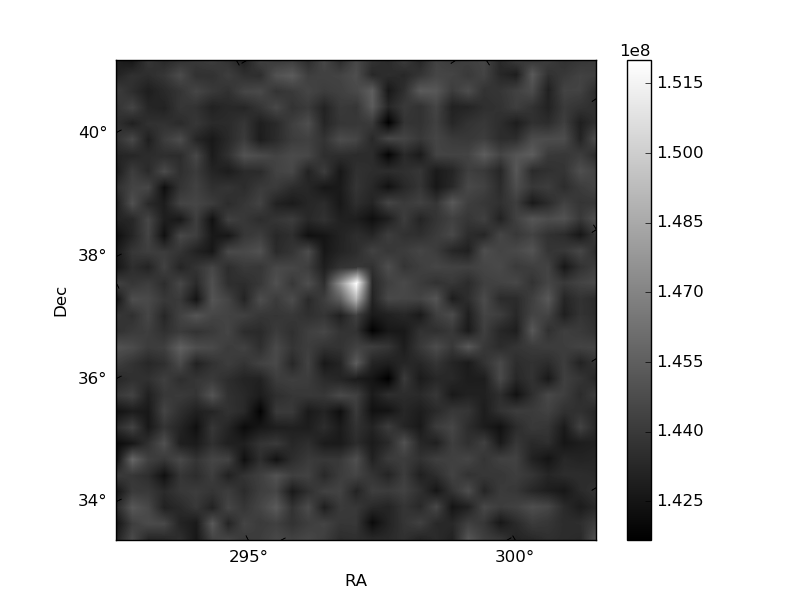
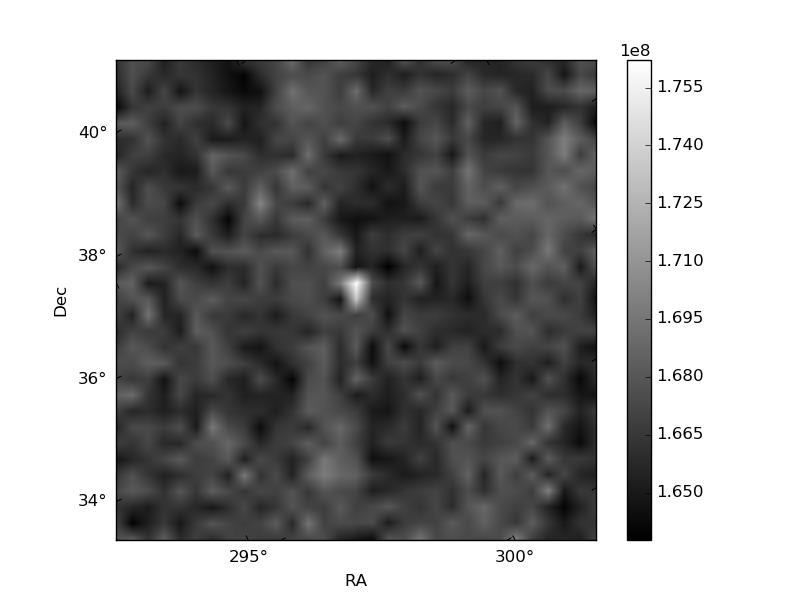
Histogram calculated using DETX and DETY for each event in the final _common_clean file
| Quadrant A | 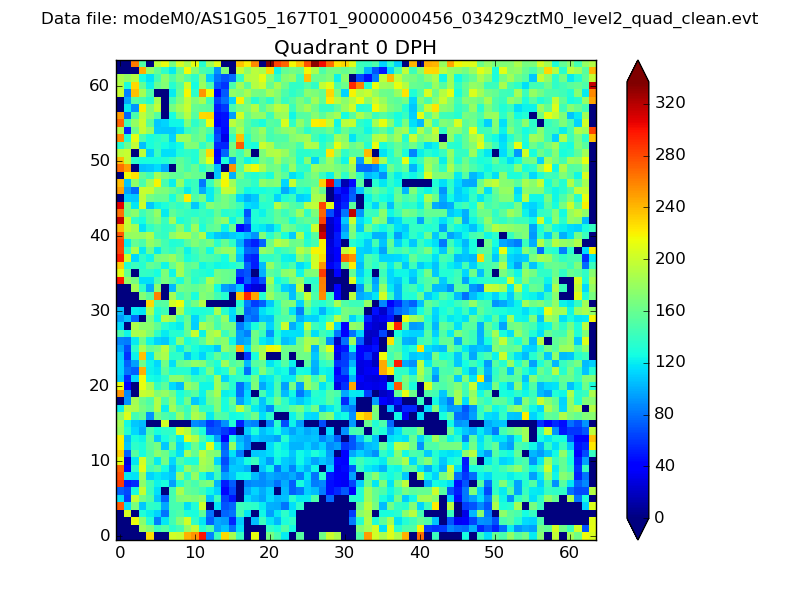 |
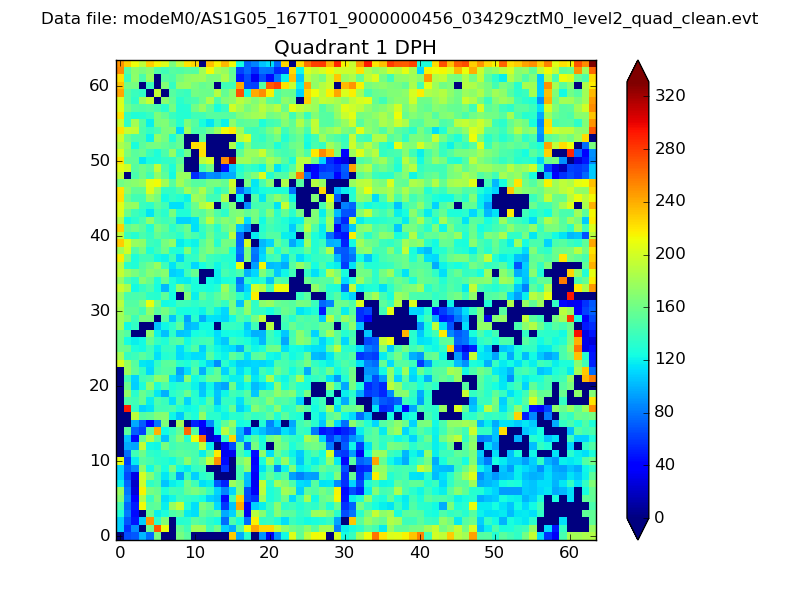 |
Quadrant B |
|---|---|---|---|
| Quadrant D | 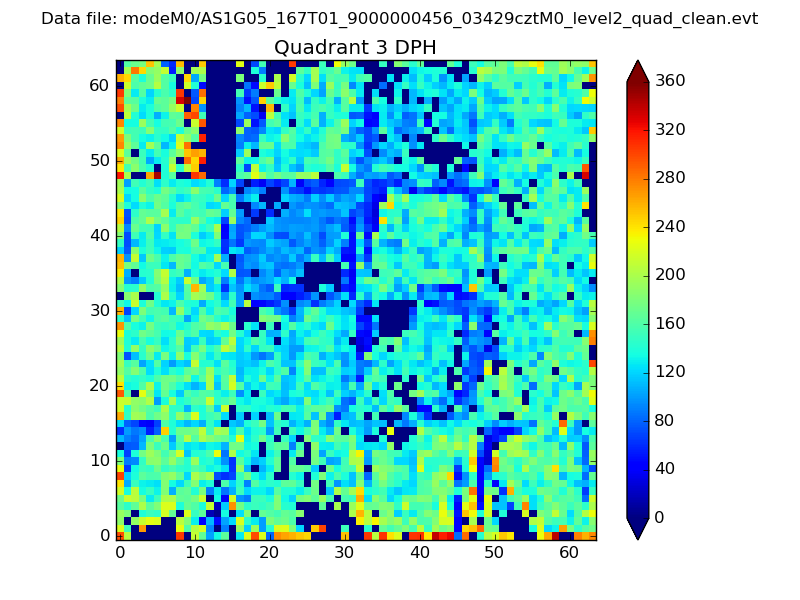 |
 |
Quadrant C |
| Plot type | Count rate plots | Images |
|---|---|---|
| Comparison with Poisson distribution Blue bars denote a histogram of data divided into 1 sec bins. Red curve is a Poisson curve with rate = median count rate of data. |
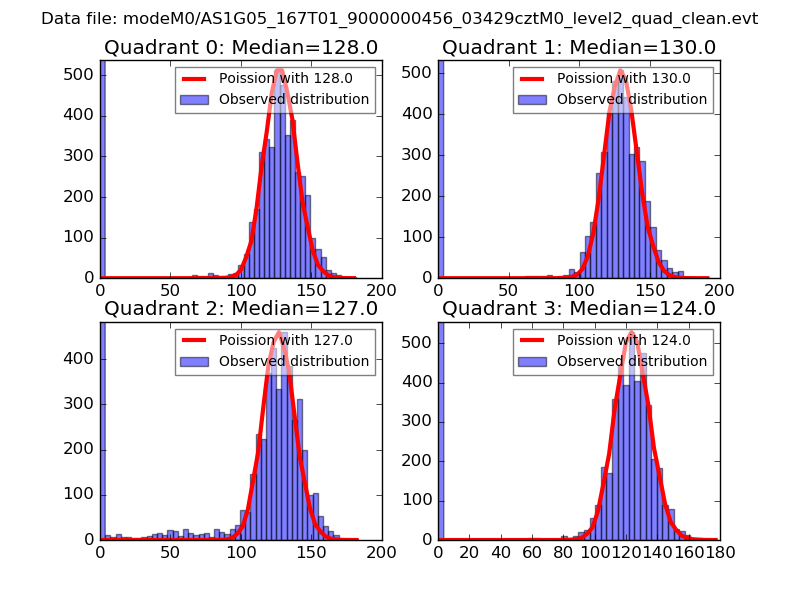 |
 |
| Quadrant-wise count rates Data is divided into 100 sec bins |
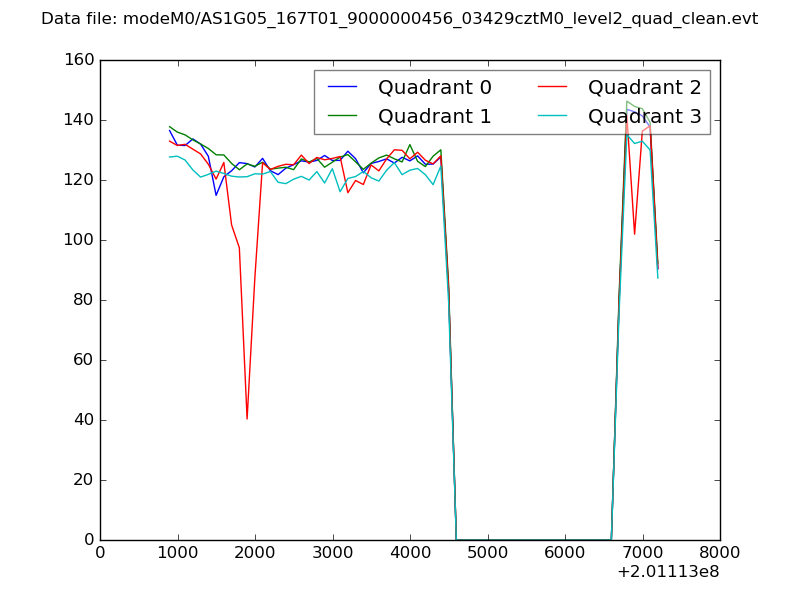 |
|
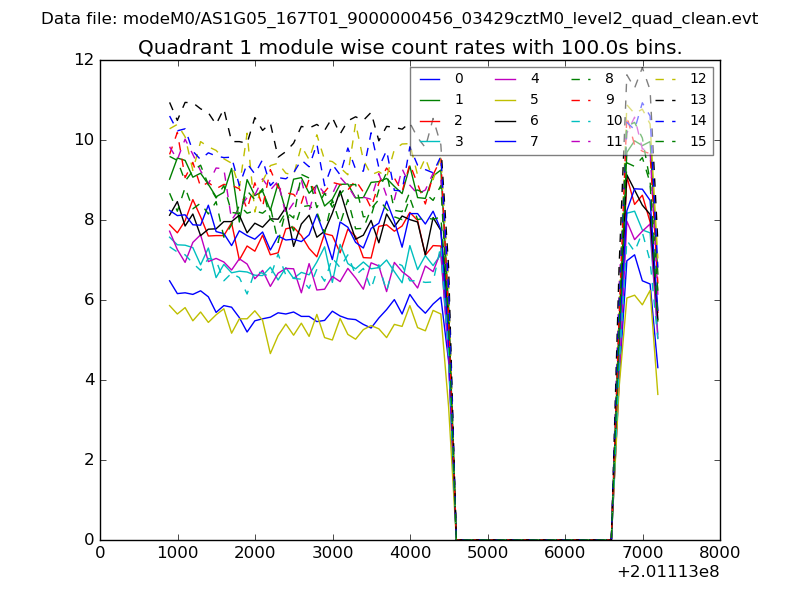
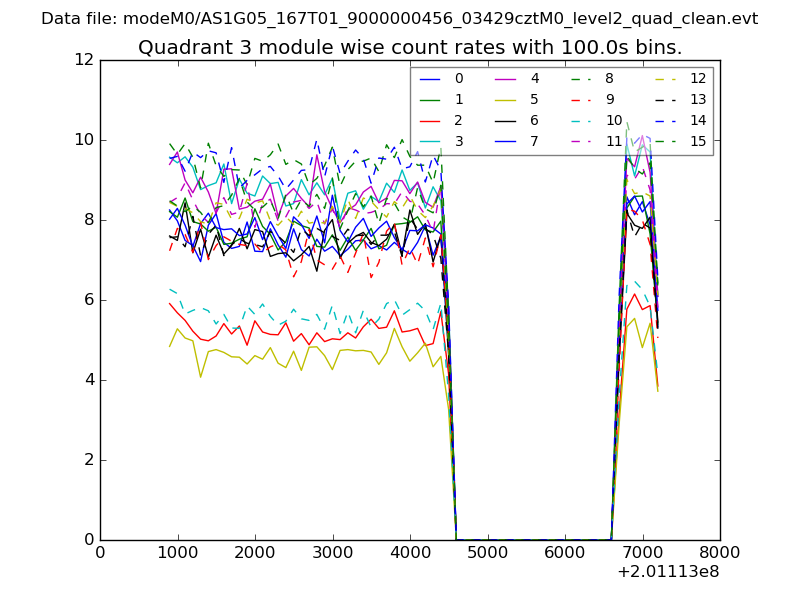
| Module-wise count rates for Quadrant A Data is divided into 100 sec bins |
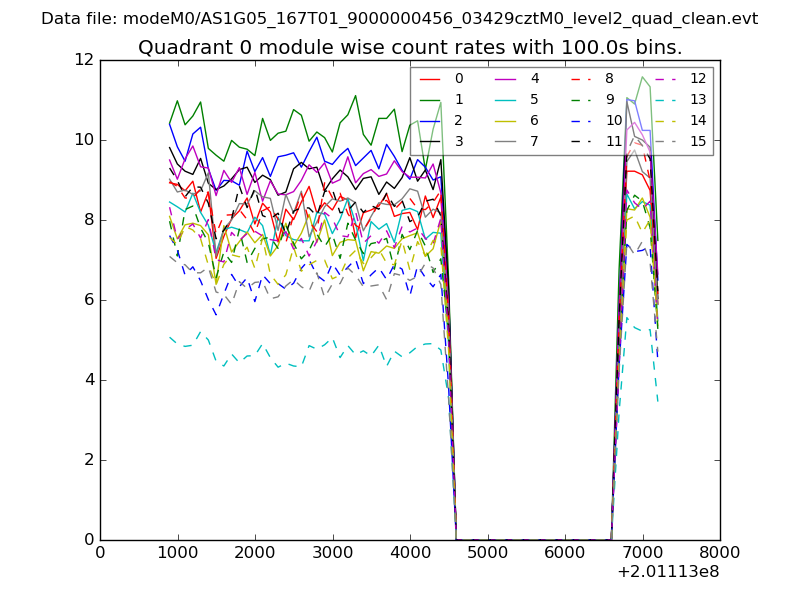 |
 |
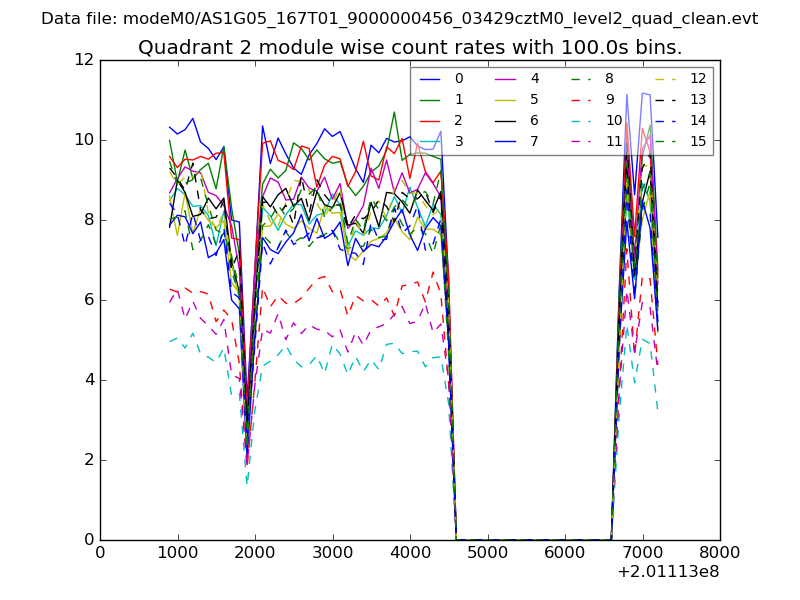
| Module-wise count rates for Quadrant B Data is divided into 100 sec bins |
 |
 |
| Module-wise count rates for Quadrant C Data is divided into 100 sec bins |
 |
 |
| Module-wise count rates for Quadrant D Data is divided into 100 sec bins |
 |
 |
| Parameter | Plot |
|---|---|
| CZT HV Monitor | 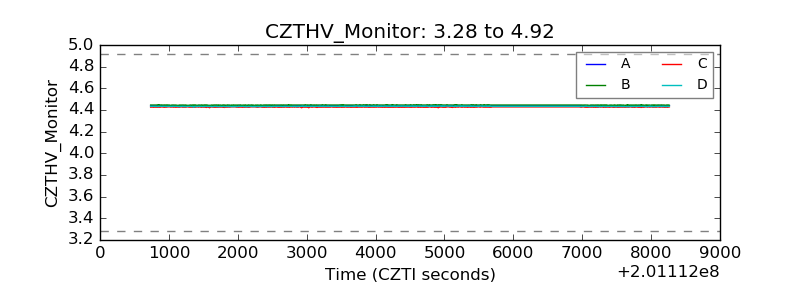 |
| D_VDD | 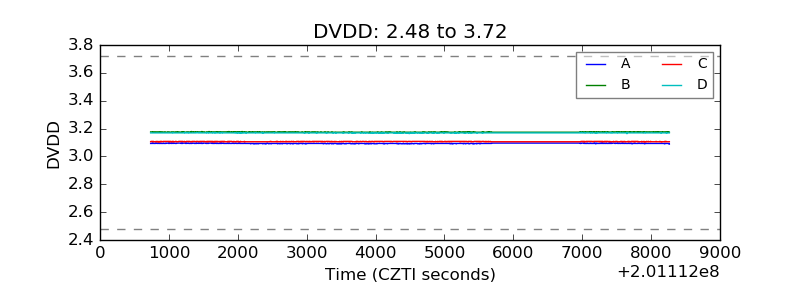 |
| Temperature 1 | 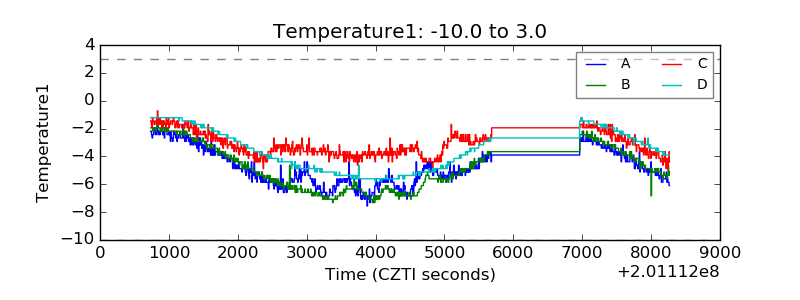 |
| Veto HV Monitor | 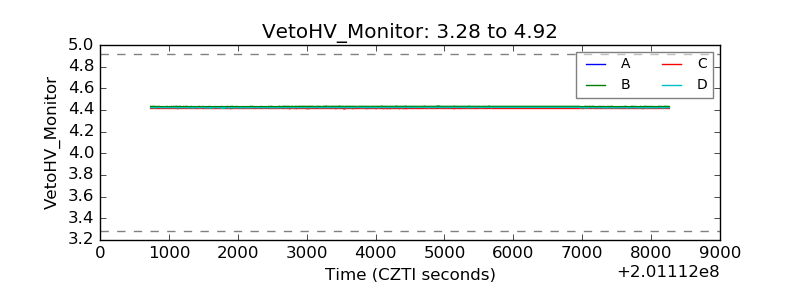 |
| Veto LLD | 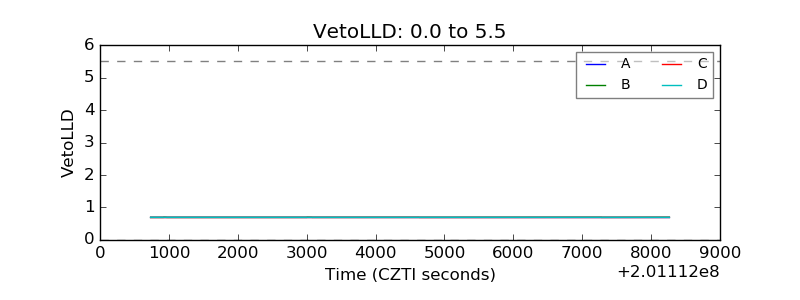 |
| Alpha Counter | 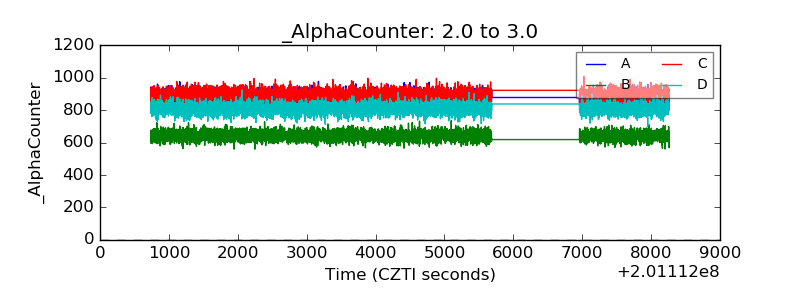 |
| _CPM_Rate | 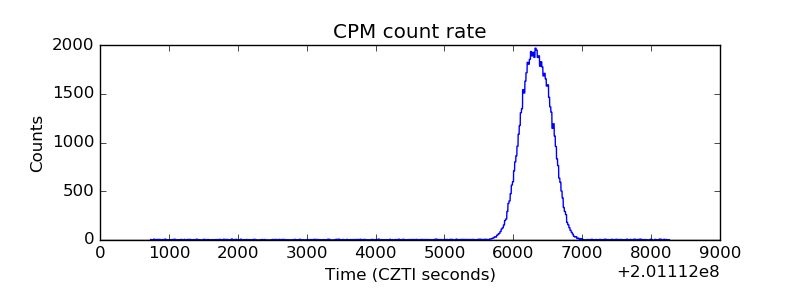 |
| CZT Counter | 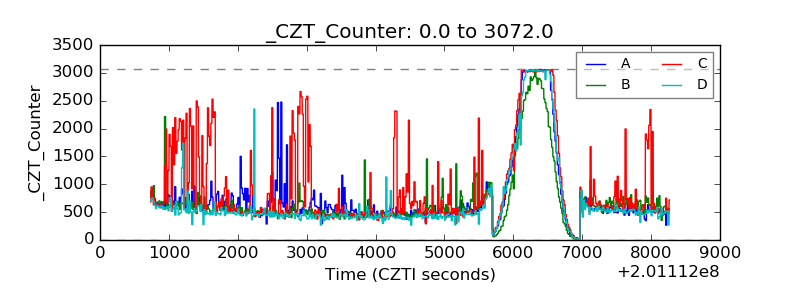 |
| +2.5 Volts monitor | 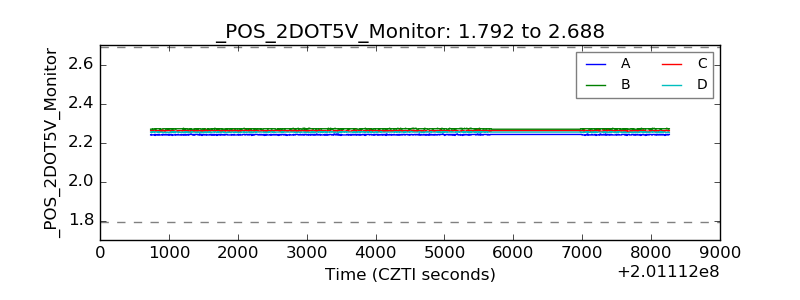 |
| +5 Volts monitor | 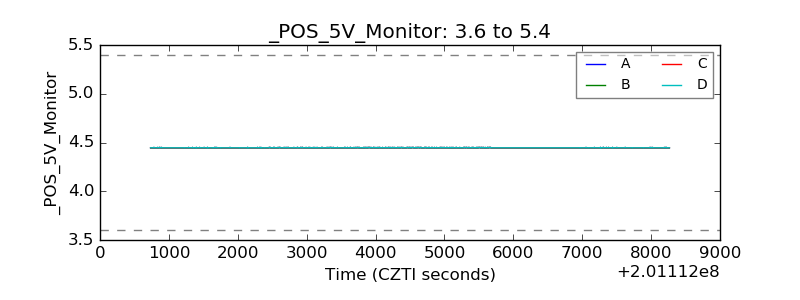 |
| _ROLL_ROT | 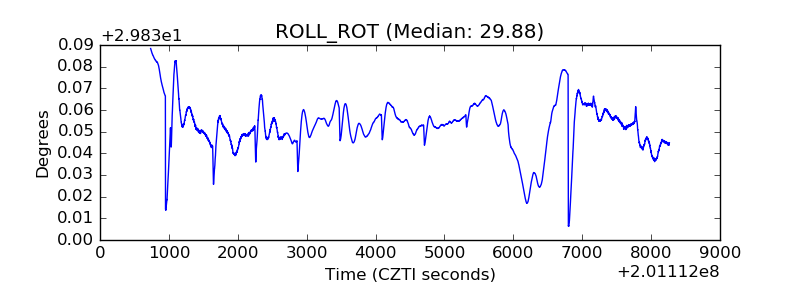 |
| _Roll_DEC | 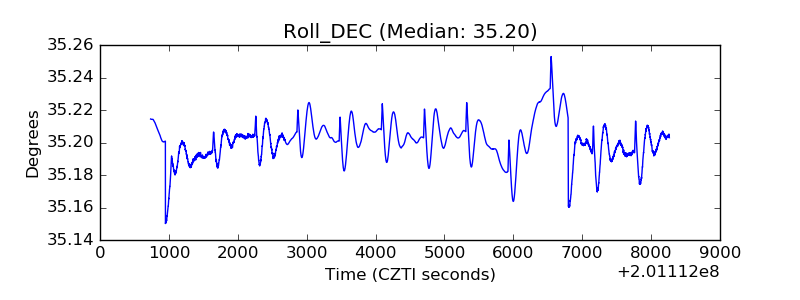 |
| _Roll_RA | 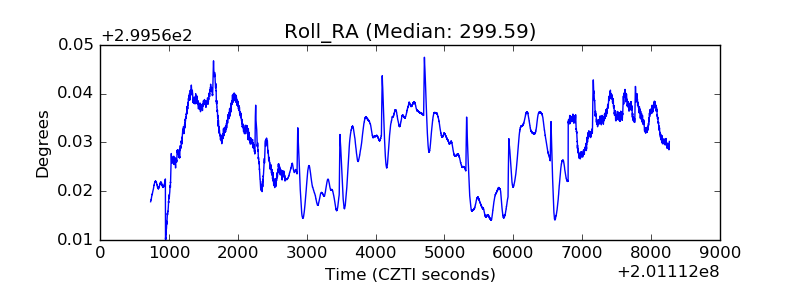 |
| Veto Counter | 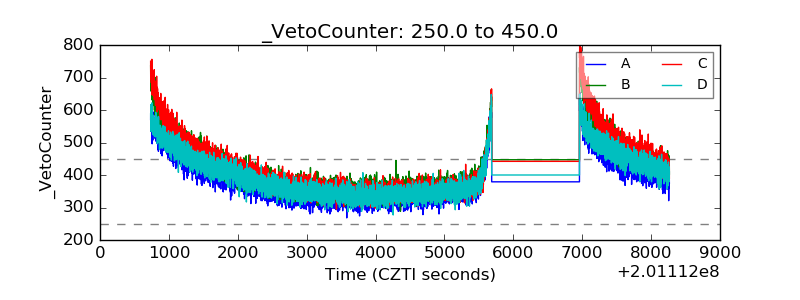 |