| Param | Original file | Final file |
|---|---|---|
| Filename | modeM0/AS1G05_167T01_9000000456_03430cztM0_level2.evt | modeM0/AS1G05_167T01_9000000456_03430cztM0_level2_quad_clean.evt |
| Size (bytes) | 487,736,640 | 92,718,720 |
| Size | 465.1 MB | 88.4 MB |
| Events in quadrant A | 3,128,784 | 600,364 |
| Events in quadrant B | 3,646,588 | 606,050 |
| Events in quadrant C | 4,400,721 | 588,504 |
| Events in quadrant D | 3,171,820 | 577,332 |
| Mode M9 | |||
|---|---|---|---|
| Quadrant | BADHDUFLAG | Total packets | Discarded packets |
| A | 0 | 14 | 0 |
| B | 0 | 14 | 0 |
| C | 0 | 14 | 0 |
| D | 0 | 15 | 0 |
| Mode SS | |||
|---|---|---|---|
| Quadrant | BADHDUFLAG | Total packets | Discarded packets |
| A | 0 | 126 | 0 |
| B | 0 | 126 | 0 |
| C | 0 | 126 | 0 |
| D | 0 | 126 | 0 |
| Mode M0 | |||
|---|---|---|---|
| Quadrant | BADHDUFLAG | Total packets | Discarded packets |
| A | 0 | 13255 | 3 |
| B | 0 | 14957 | 2 |
| C | 0 | 17056 | 2 |
| D | 0 | 13438 | 2 |
| Quadrant | Total seconds | Saturated seconds | Saturation percentage |
|---|---|---|---|
| A | 6242 | 52 | 0.833066% |
| B | 6242 | 99 | 1.586030% |
| C | 6242 | 297 | 4.758090% |
| D | 6242 | 69 | 1.105415% |
Noise dominated data is calculated using 1-second bins in cleaned event files. If a bin has >2000 counts, and if more than 50% of those come from <1% of pixels, then it is considered to be noise-dominated and hence unusable.
| Quadrant | # 1 sec bins | Bins with >0 counts | Bins with >2000 counts | High rate bins dominated by noise | Noise dominated (total time) | Noise dominated (detector-on time) | Marked lightcurve |
|---|---|---|---|---|---|---|---|
| A | 7577 | 6243 | 0 | 0 | 0.00% | 0.00% | 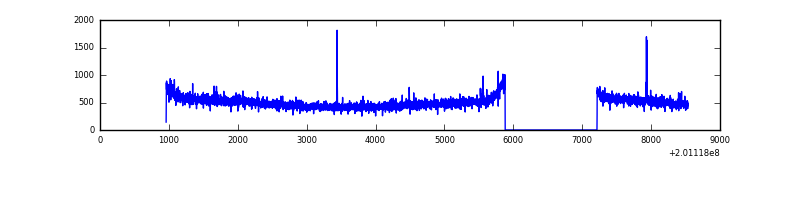 |
| B | 7577 | 6243 | 21 | 21 | 0.28% | 0.34% | 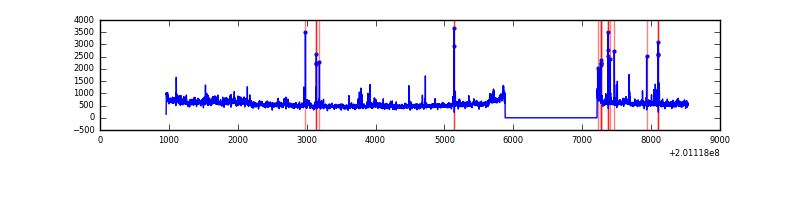 |
| C | 7577 | 6243 | 176 | 176 | 2.32% | 2.82% | 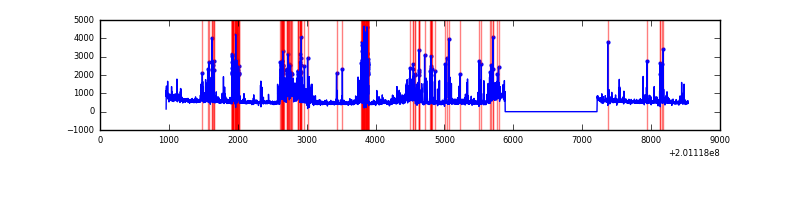 |
| D | 7577 | 6243 | 16 | 16 | 0.21% | 0.26% | 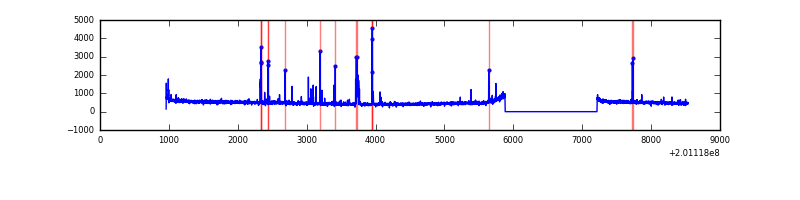 |
Top three noisy pixels from each quadrant. If the there are fewer than three noisy pixels in the level2.evt file, extra rows are filled as -1
| Pixel properties | Quadrant properties | ||||||
|---|---|---|---|---|---|---|---|
| Quadrant | DetID | PixID | Counts | Sigma | Mean | Median | Sigma |
| A | 14 | 249 | 23321 | 140.65 | 795 | 780 | 160.3 |
| A | 8 | 15 | 17253 | 102.79 | 795 | 780 | 160.3 |
| A | 0 | 118 | 14800 | 87.48 | 795 | 780 | 160.3 |
| B | 15 | 204 | 310099 | 2020.09 | 810 | 794 | 153.1 |
| B | 4 | 81 | 92945 | 601.84 | 810 | 794 | 153.1 |
| B | 2 | 249 | 34409 | 219.54 | 810 | 794 | 153.1 |
| C | 7 | 220 | 1087675 | 6069.85 | 777 | 787 | 179.1 |
| C | 1 | 192 | 209007 | 1162.83 | 777 | 787 | 179.1 |
| C | 6 | 80 | 29394 | 159.76 | 777 | 787 | 179.1 |
| D | 9 | 85 | 83469 | 440.9 | 779 | 760 | 187.6 |
| D | 13 | 223 | 42388 | 221.91 | 779 | 760 | 187.6 |
| D | 2 | 37 | 38613 | 201.78 | 779 | 760 | 187.6 |
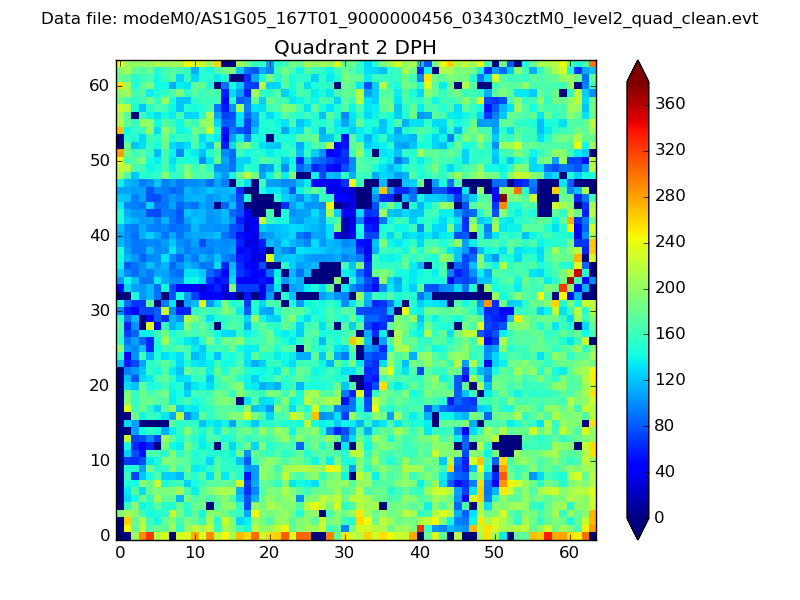
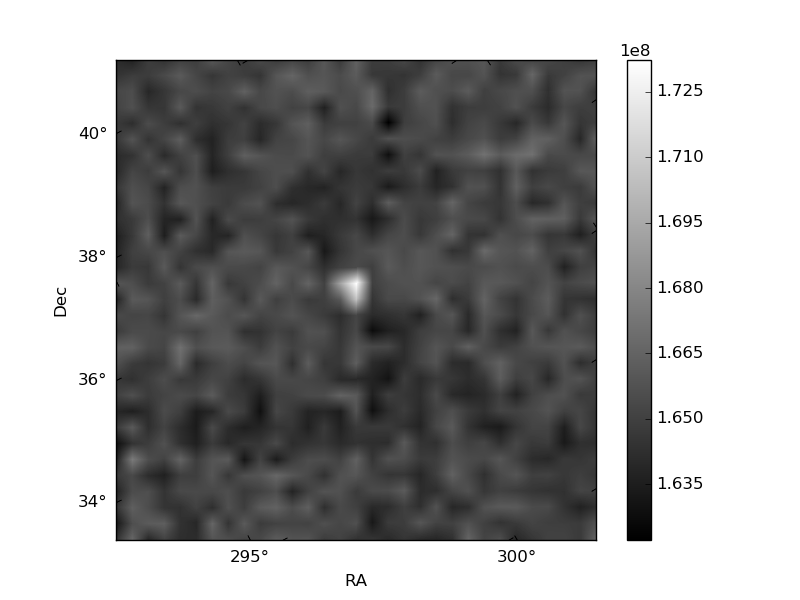
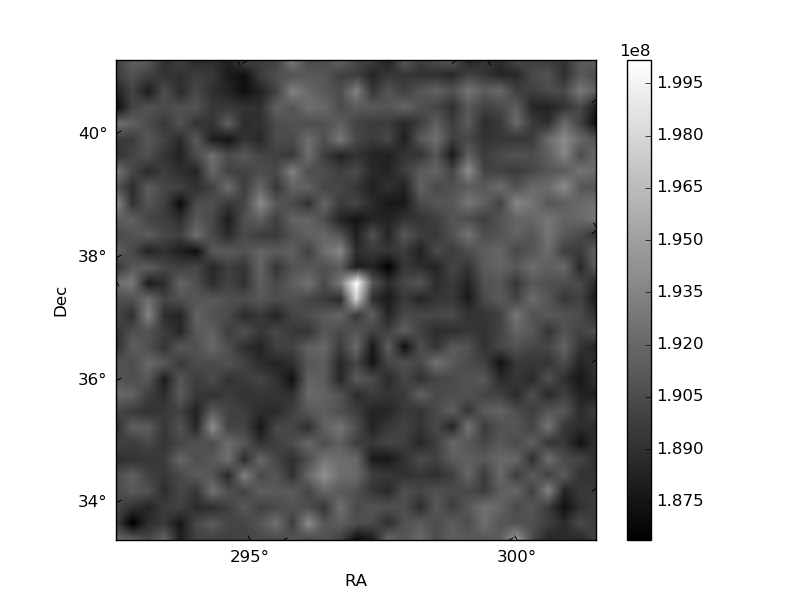
Histogram calculated using DETX and DETY for each event in the final _common_clean file
| Quadrant A | 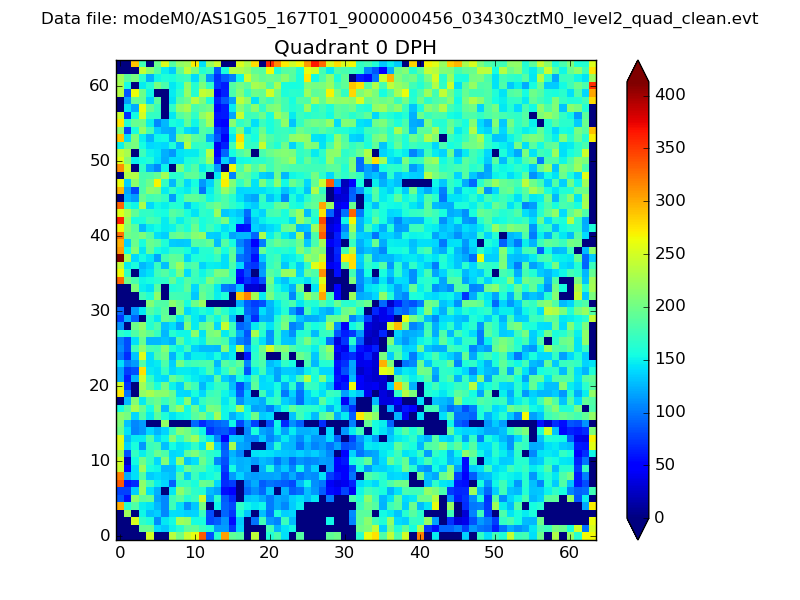 |
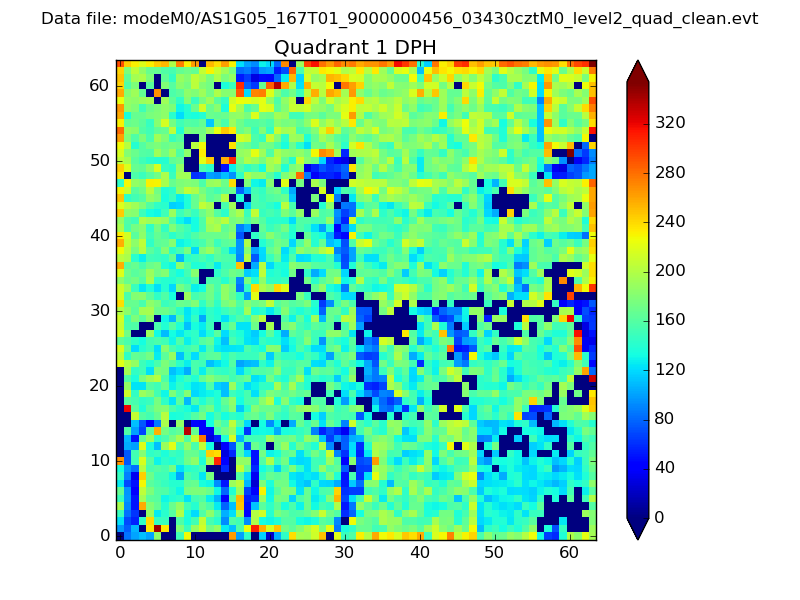 |
Quadrant B |
|---|---|---|---|
| Quadrant D | 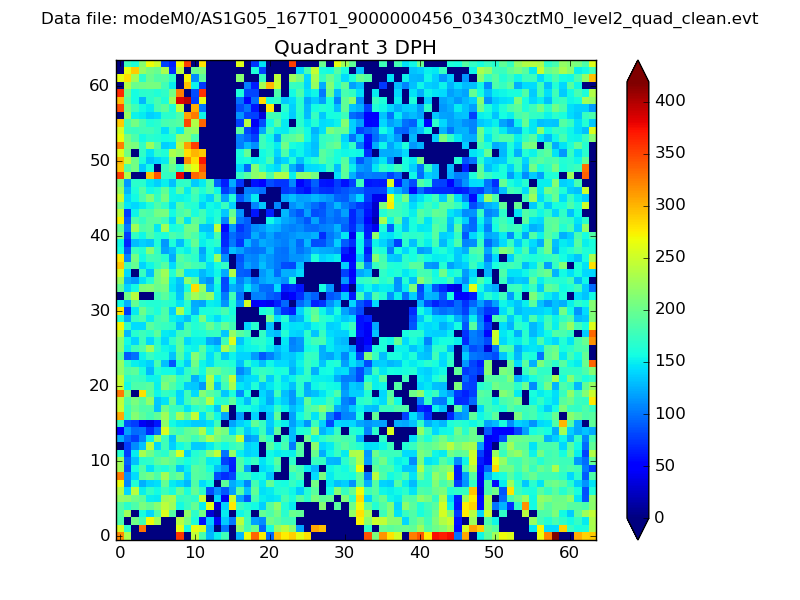 |
 |
Quadrant C |
| Plot type | Count rate plots | Images |
|---|---|---|
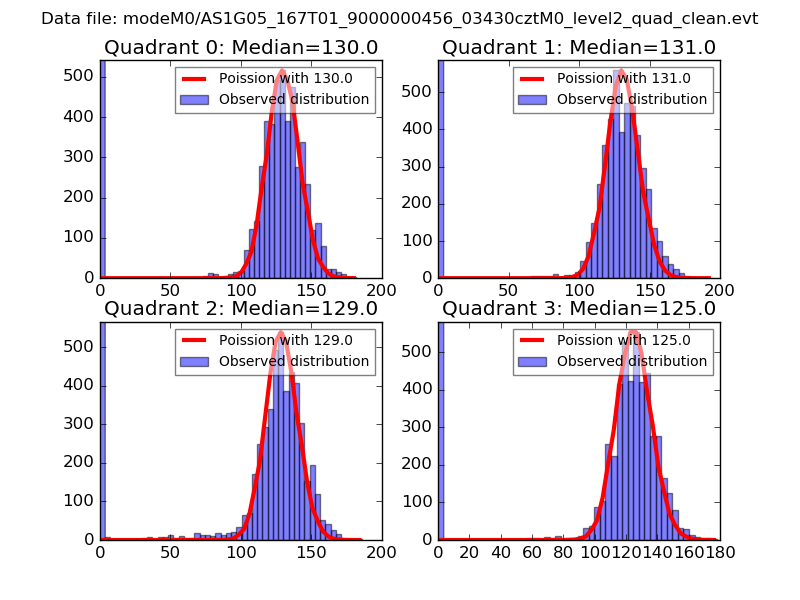
| Comparison with Poisson distribution Blue bars denote a histogram of data divided into 1 sec bins. Red curve is a Poisson curve with rate = median count rate of data. |
 |
 |
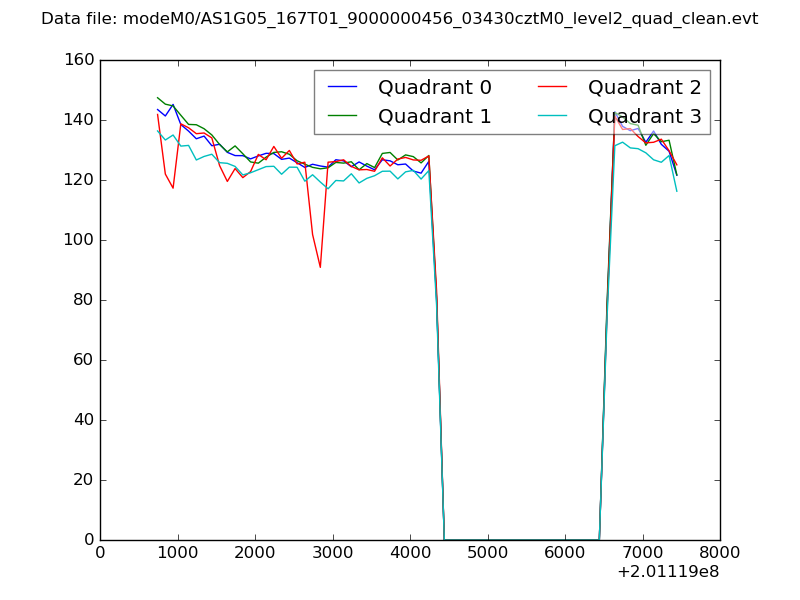
| Quadrant-wise count rates Data is divided into 100 sec bins |
 |
|
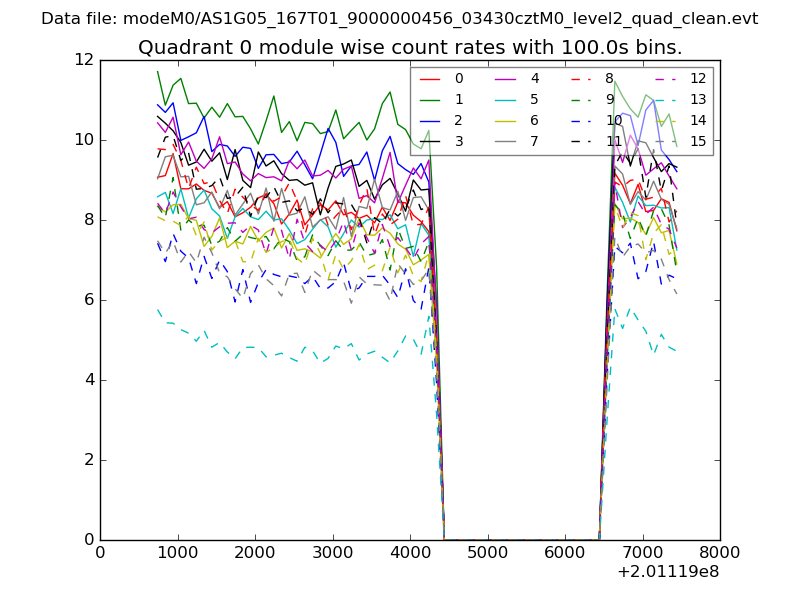
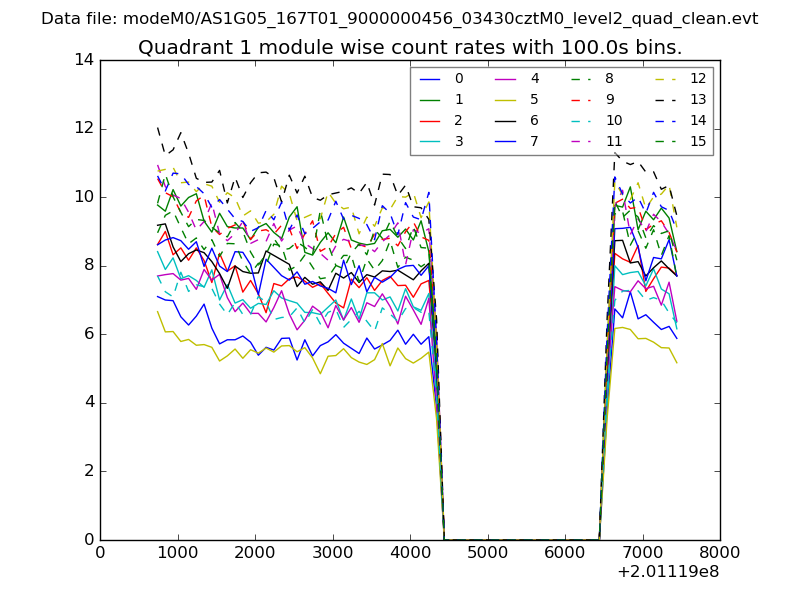
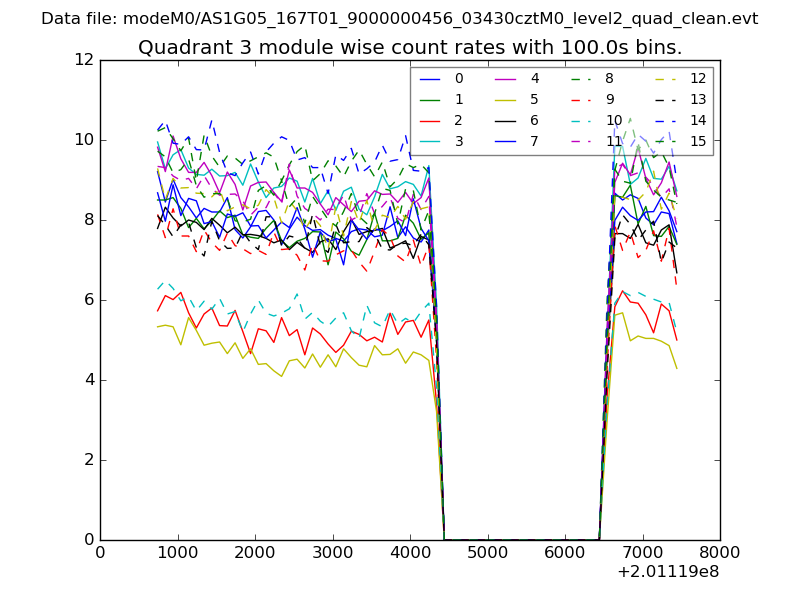
| Module-wise count rates for Quadrant A Data is divided into 100 sec bins |
 |
 |
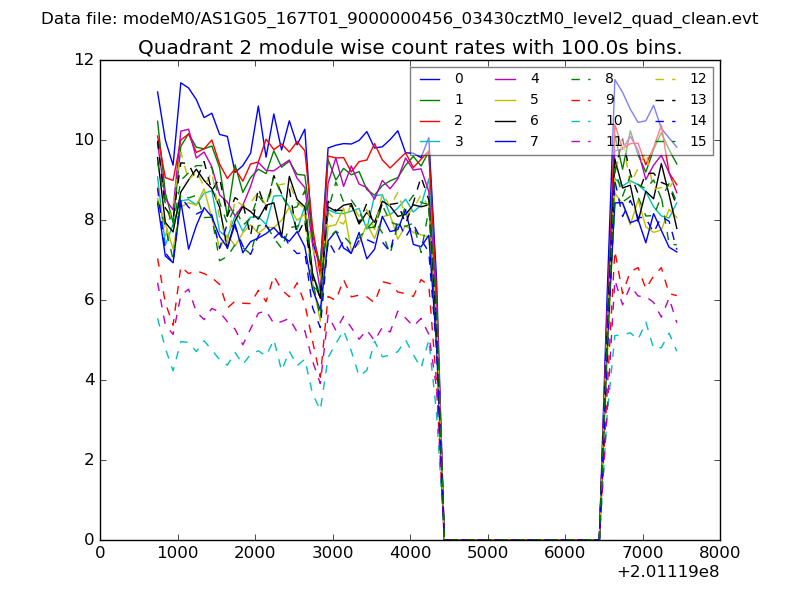
| Module-wise count rates for Quadrant B Data is divided into 100 sec bins |
 |
 |
| Module-wise count rates for Quadrant C Data is divided into 100 sec bins |
 |
 |
| Module-wise count rates for Quadrant D Data is divided into 100 sec bins |
 |
 |
| Parameter | Plot |
|---|---|
| CZT HV Monitor | 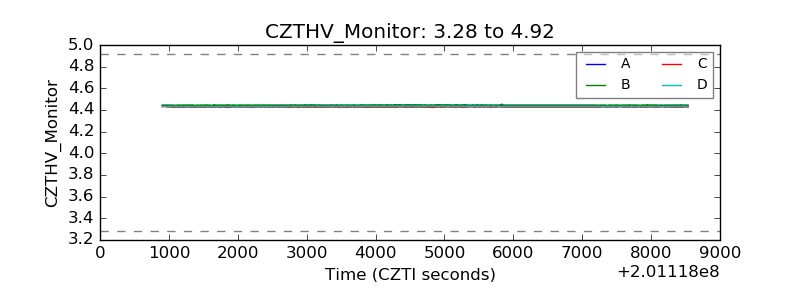 |
| D_VDD | 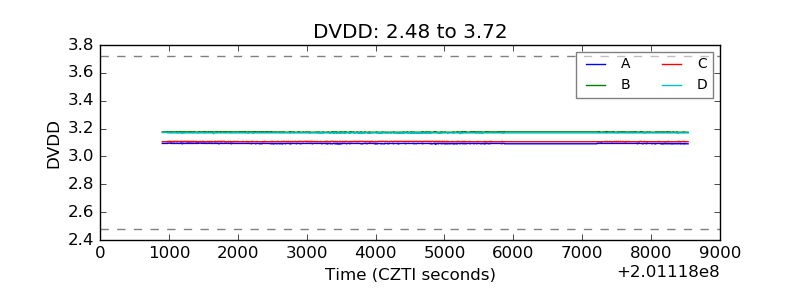 |
| Temperature 1 | 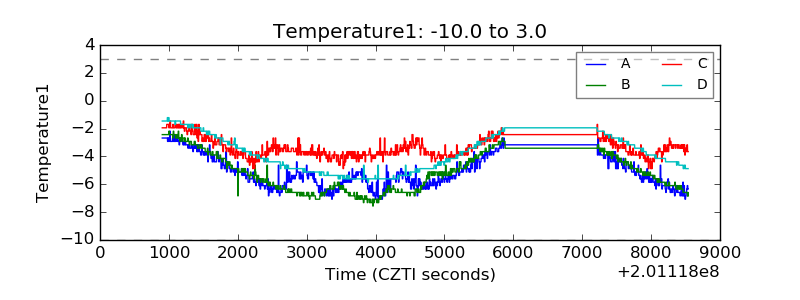 |
| Veto HV Monitor | 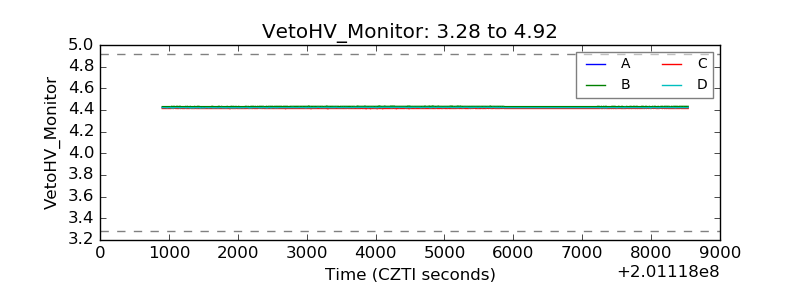 |
| Veto LLD | 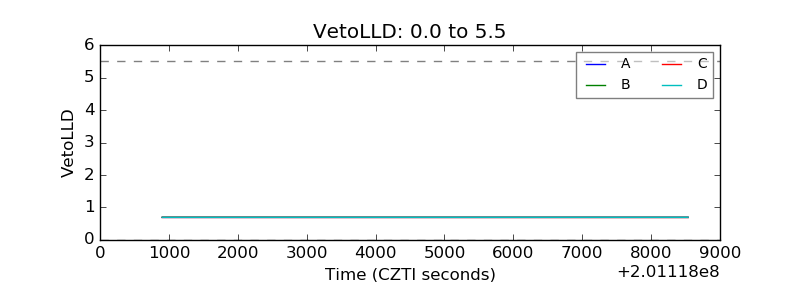 |
| Alpha Counter | 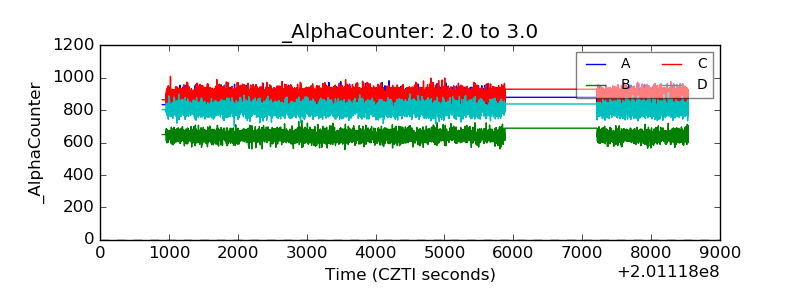 |
| _CPM_Rate | 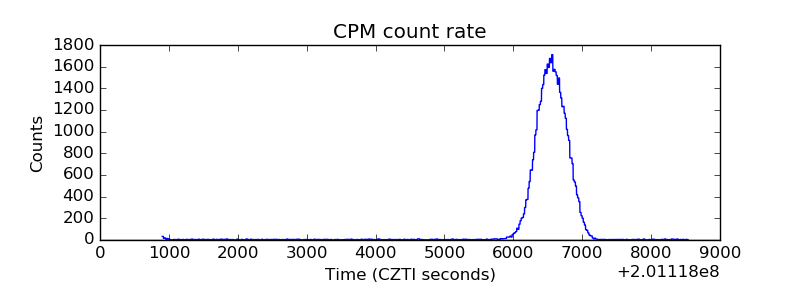 |
| CZT Counter | 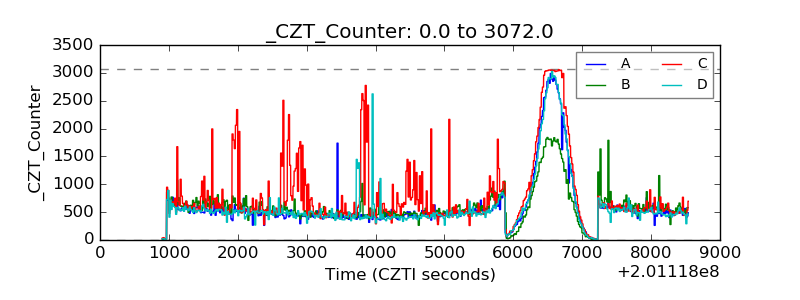 |
| +2.5 Volts monitor |  |
| +5 Volts monitor |  |
| _ROLL_ROT | 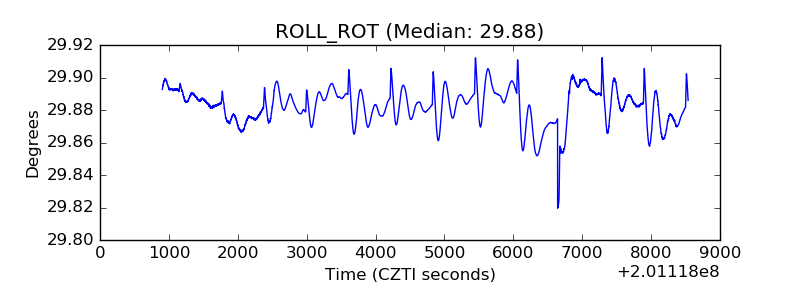 |
| _Roll_DEC | 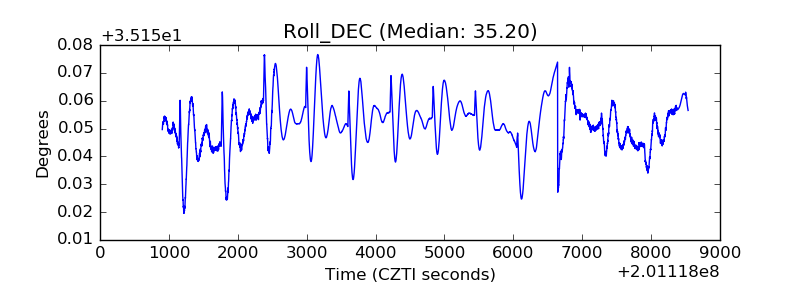 |
| _Roll_RA | 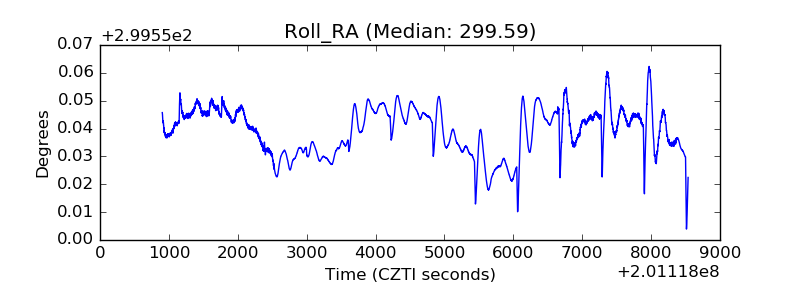 |
| Veto Counter | 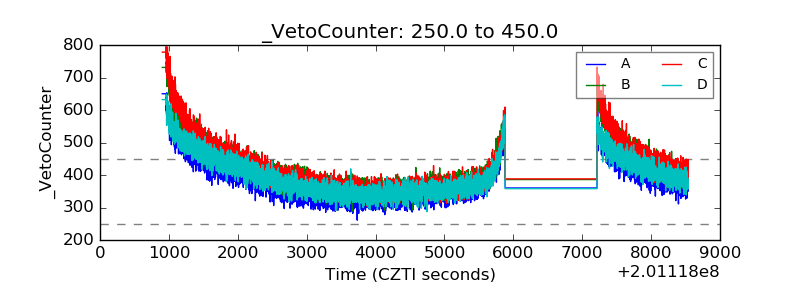 |