| Param | Original file | Final file |
|---|---|---|
| Filename | modeM0/AS1G05_167T01_9000000456_03432cztM0_level2.evt | modeM0/AS1G05_167T01_9000000456_03432cztM0_level2_quad_clean.evt |
| Size (bytes) | 445,564,800 | 94,227,840 |
| Size | 424.9 MB | 89.9 MB |
| Events in quadrant A | 3,135,669 | 607,341 |
| Events in quadrant B | 3,415,579 | 609,521 |
| Events in quadrant C | 2,995,563 | 613,435 |
| Events in quadrant D | 3,507,287 | 571,889 |
| Mode M9 | |||
|---|---|---|---|
| Quadrant | BADHDUFLAG | Total packets | Discarded packets |
| A | 0 | 14 | 0 |
| B | 0 | 14 | 0 |
| C | 0 | 14 | 0 |
| D | 0 | 15 | 0 |
| Mode SS | |||
|---|---|---|---|
| Quadrant | BADHDUFLAG | Total packets | Discarded packets |
| A | 0 | 132 | 0 |
| B | 0 | 132 | 0 |
| C | 0 | 132 | 0 |
| D | 0 | 132 | 0 |
| Mode M0 | |||
|---|---|---|---|
| Quadrant | BADHDUFLAG | Total packets | Discarded packets |
| A | 0 | 13645 | 4 |
| B | 0 | 14447 | 3 |
| C | 0 | 13331 | 3 |
| D | 0 | 15129 | 3 |
| Quadrant | Total seconds | Saturated seconds | Saturation percentage |
|---|---|---|---|
| A | 6468 | 35 | 0.541126% |
| B | 6468 | 63 | 0.974026% |
| C | 6468 | 22 | 0.340136% |
| D | 6468 | 195 | 3.014842% |
Noise dominated data is calculated using 1-second bins in cleaned event files. If a bin has >2000 counts, and if more than 50% of those come from <1% of pixels, then it is considered to be noise-dominated and hence unusable.
| Quadrant | # 1 sec bins | Bins with >0 counts | Bins with >2000 counts | High rate bins dominated by noise | Noise dominated (total time) | Noise dominated (detector-on time) | Marked lightcurve |
|---|---|---|---|---|---|---|---|
| A | 7548 | 6470 | 8 | 8 | 0.11% | 0.12% | 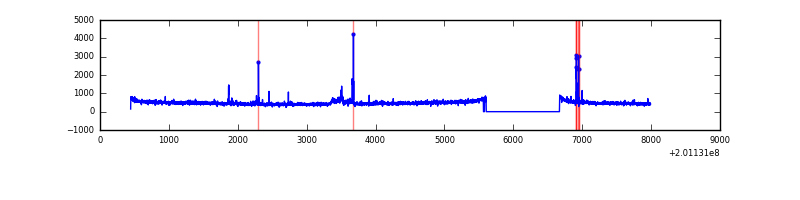 |
| B | 7548 | 6470 | 6 | 6 | 0.08% | 0.09% | 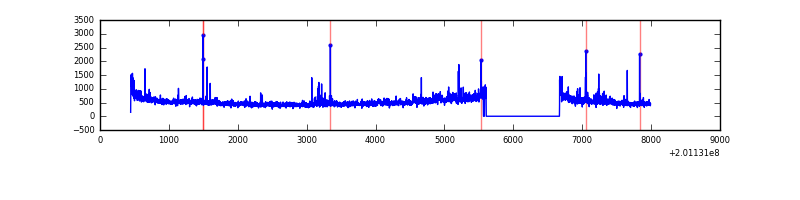 |
| C | 7548 | 6470 | 0 | 0 | 0.00% | 0.00% | 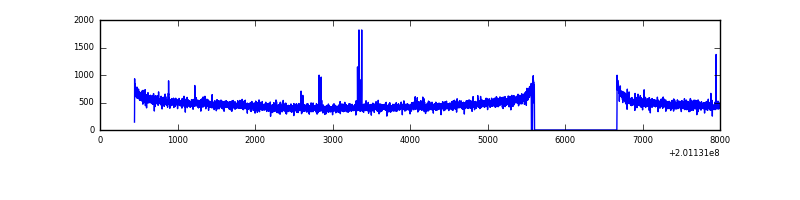 |
| D | 7548 | 6470 | 149 | 149 | 1.97% | 2.30% | 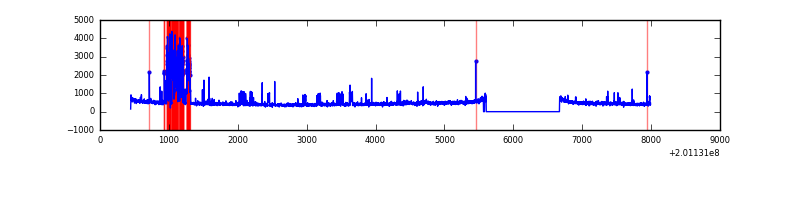 |
Top three noisy pixels from each quadrant. If the there are fewer than three noisy pixels in the level2.evt file, extra rows are filled as -1
| Pixel properties | Quadrant properties | ||||||
|---|---|---|---|---|---|---|---|
| Quadrant | DetID | PixID | Counts | Sigma | Mean | Median | Sigma |
| A | 0 | 149 | 72175 | 449.01 | 769 | 753 | 159.1 |
| A | 0 | 118 | 48878 | 302.55 | 769 | 753 | 159.1 |
| A | 14 | 249 | 22336 | 135.69 | 769 | 753 | 159.1 |
| B | 15 | 204 | 246570 | 1621.84 | 782 | 765 | 151.6 |
| B | 2 | 249 | 36835 | 237.99 | 782 | 765 | 151.6 |
| B | 4 | 81 | 27038 | 173.35 | 782 | 765 | 151.6 |
| C | 6 | 80 | 15751 | 84.04 | 759 | 767 | 178.3 |
| C | 13 | 61 | 6338 | 31.25 | 759 | 767 | 178.3 |
| C | 12 | 4 | 5615 | 27.19 | 759 | 767 | 178.3 |
| D | 13 | 223 | 476177 | 2682.27 | 737 | 718 | 177.3 |
| D | 12 | 246 | 173381 | 974.07 | 737 | 718 | 177.3 |
| D | 2 | 37 | 27284 | 149.87 | 737 | 718 | 177.3 |
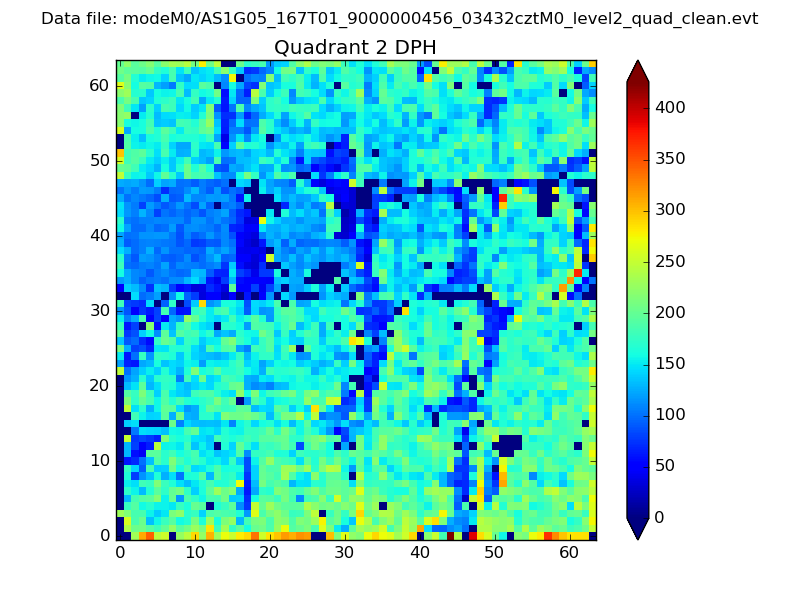
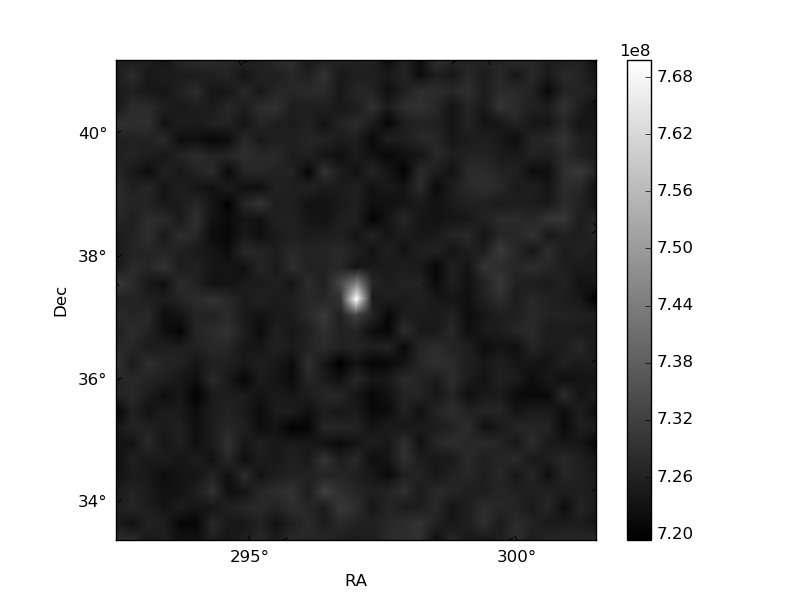
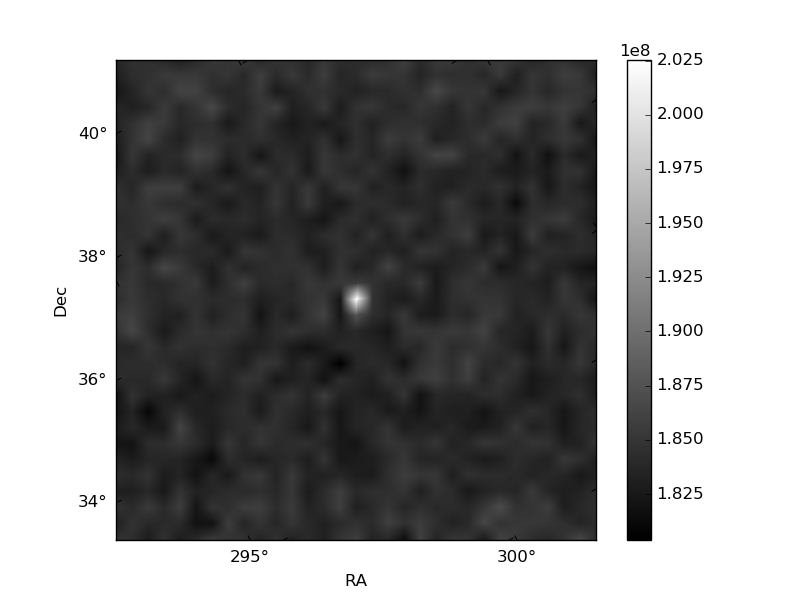
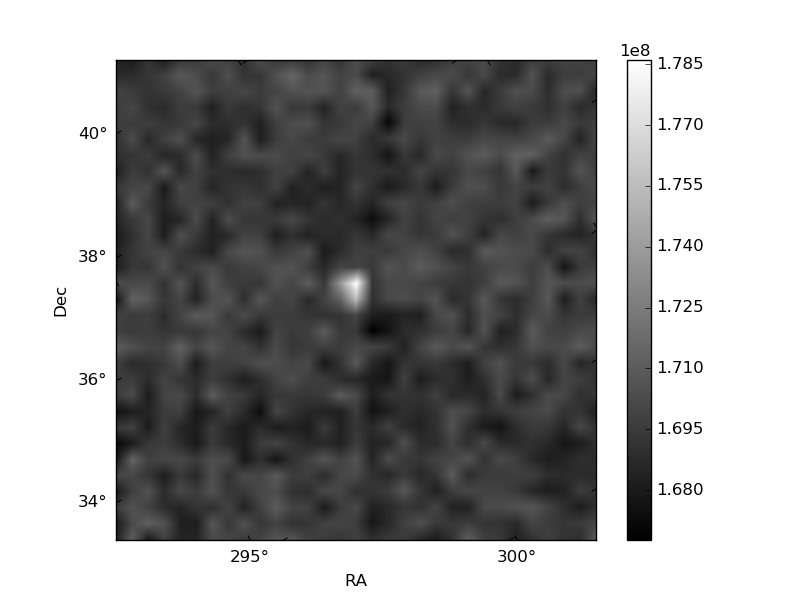
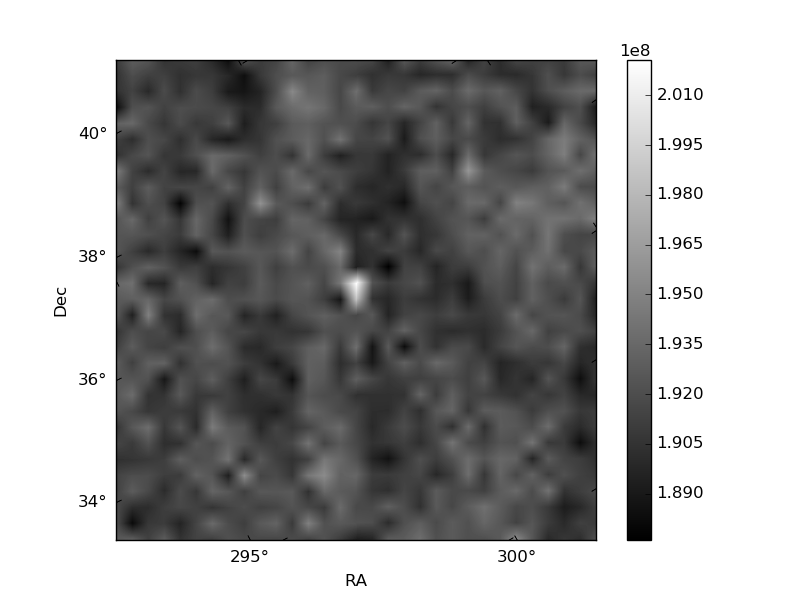
Histogram calculated using DETX and DETY for each event in the final _common_clean file
| Quadrant A | 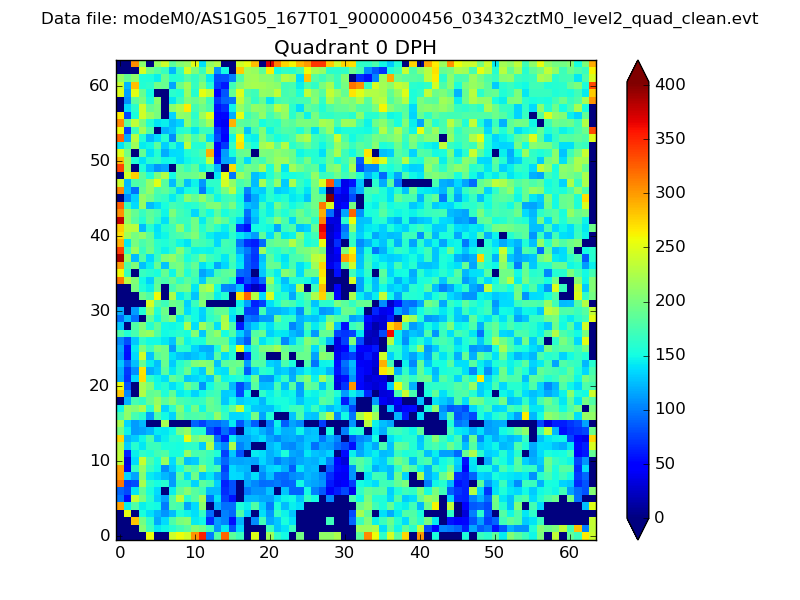 |
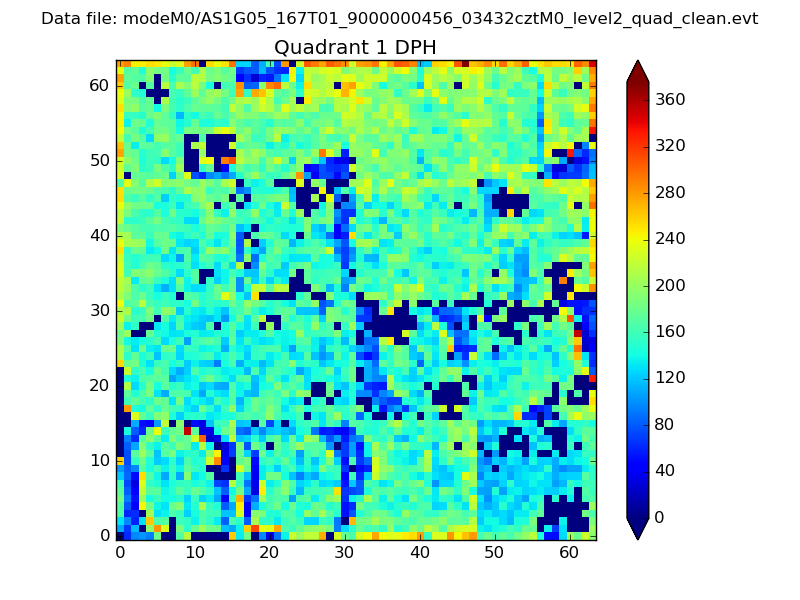 |
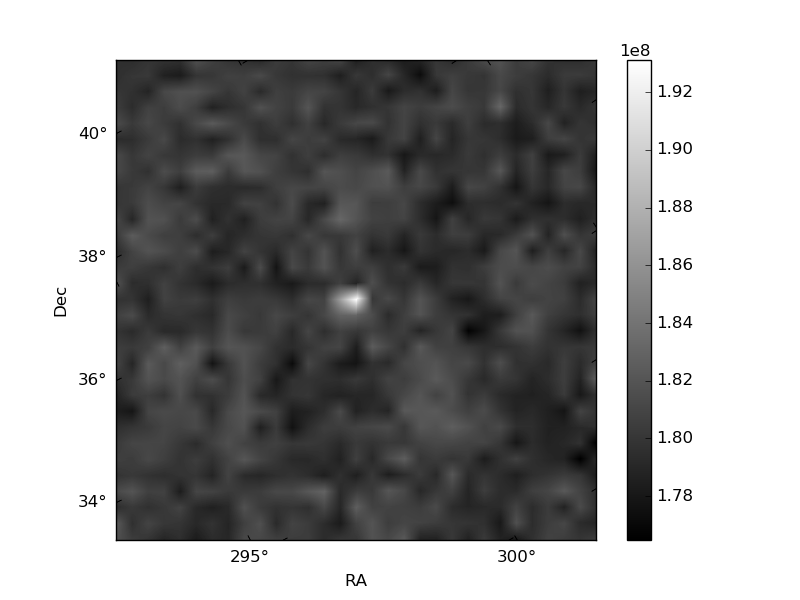
Quadrant B |
|---|---|---|---|
| Quadrant D | 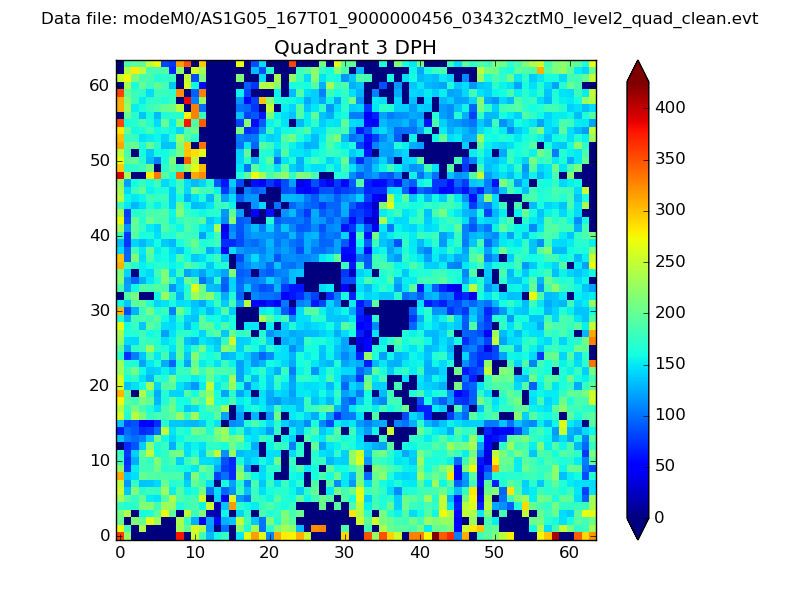 |
 |
Quadrant C |
| Plot type | Count rate plots | Images |
|---|---|---|
| Comparison with Poisson distribution Blue bars denote a histogram of data divided into 1 sec bins. Red curve is a Poisson curve with rate = median count rate of data. |
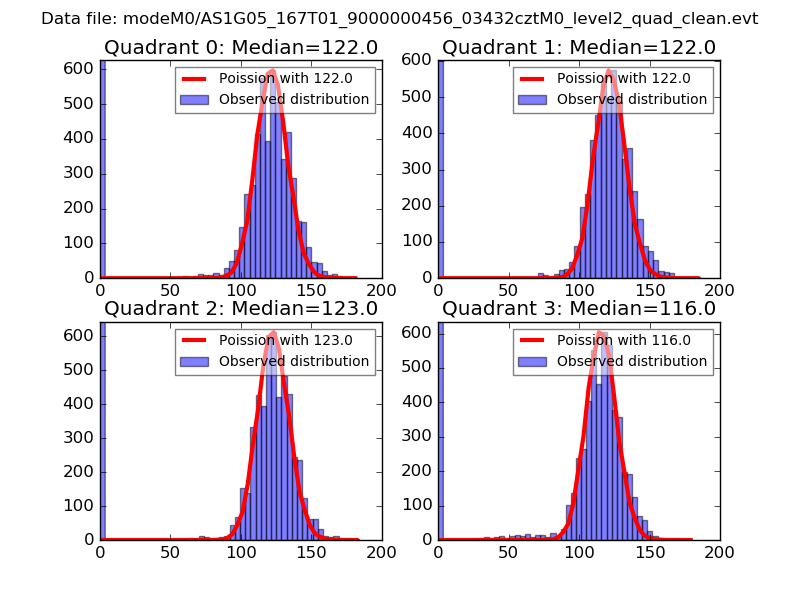 |
 |
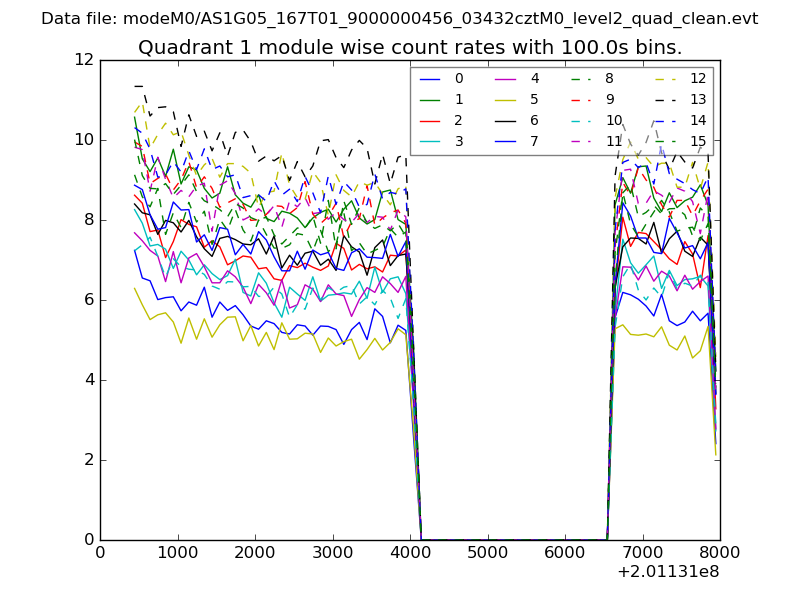
| Quadrant-wise count rates Data is divided into 100 sec bins |
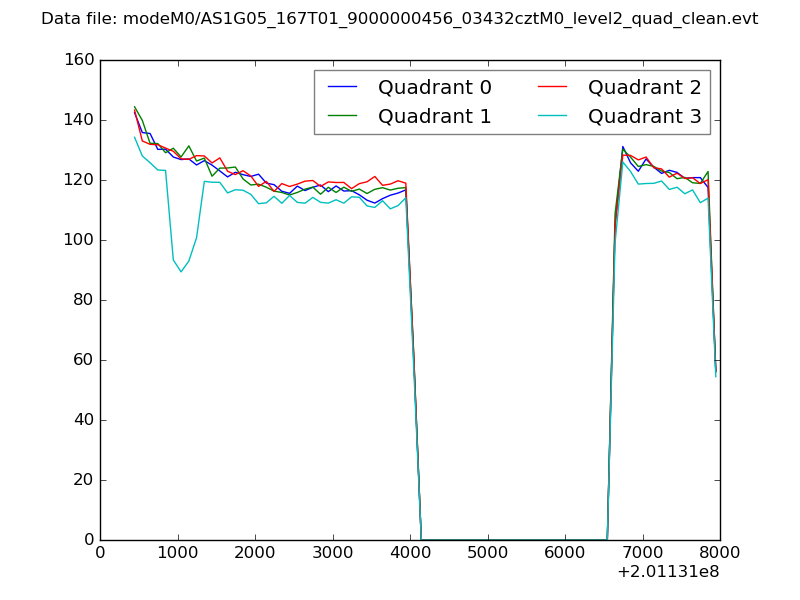 |
|
| Module-wise count rates for Quadrant A Data is divided into 100 sec bins |
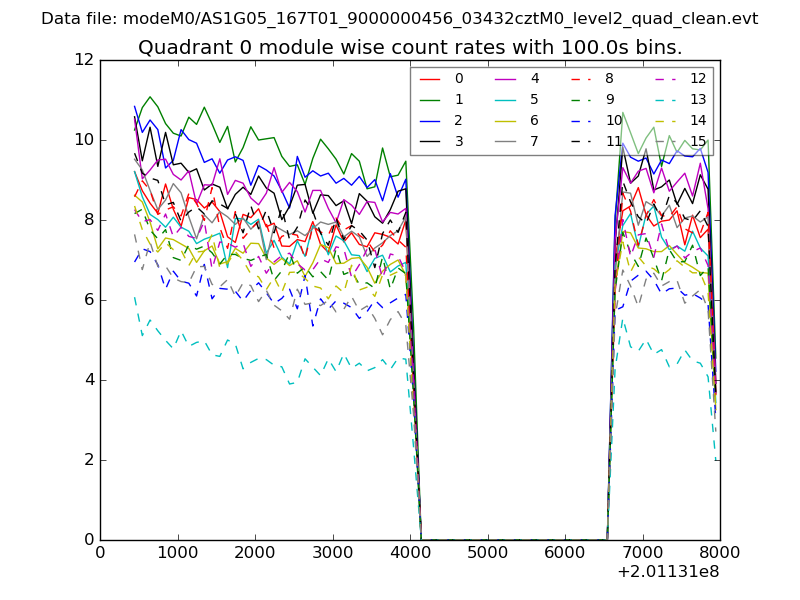 |
 |
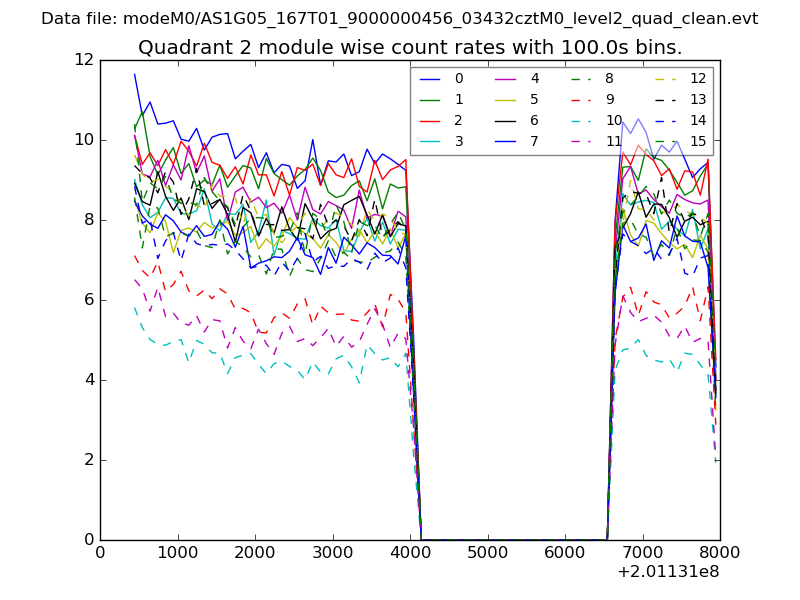
| Module-wise count rates for Quadrant B Data is divided into 100 sec bins |
 |
 |
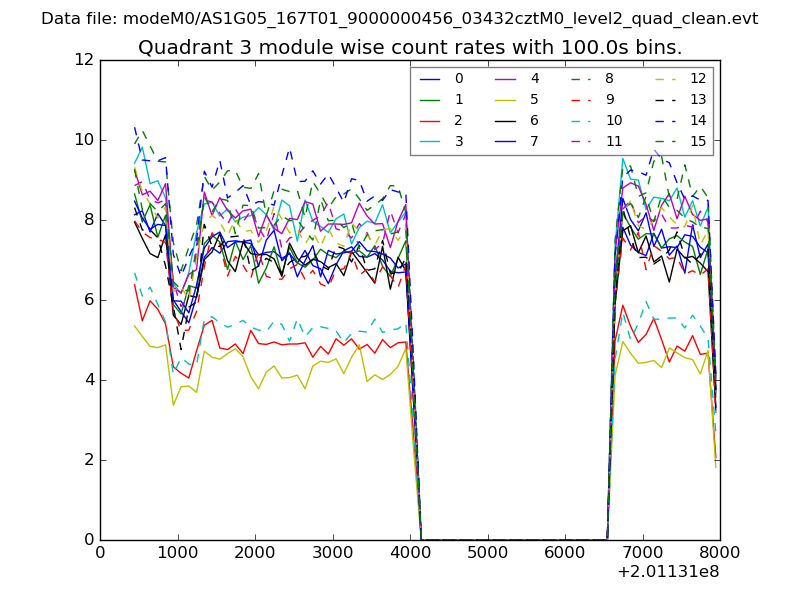
| Module-wise count rates for Quadrant C Data is divided into 100 sec bins |
 |
 |
| Module-wise count rates for Quadrant D Data is divided into 100 sec bins |
 |
 |
| Parameter | Plot |
|---|---|
| CZT HV Monitor | 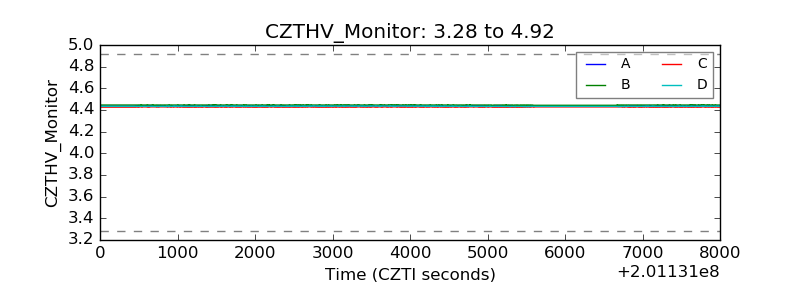 |
| D_VDD |  |
| Temperature 1 | 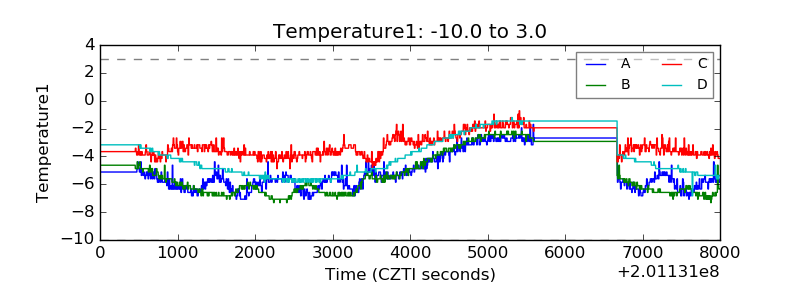 |
| Veto HV Monitor | 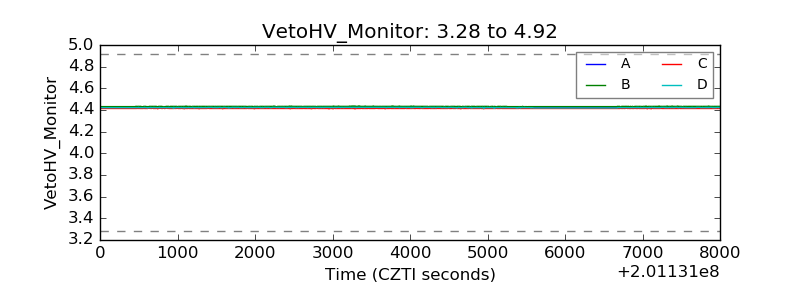 |
| Veto LLD | 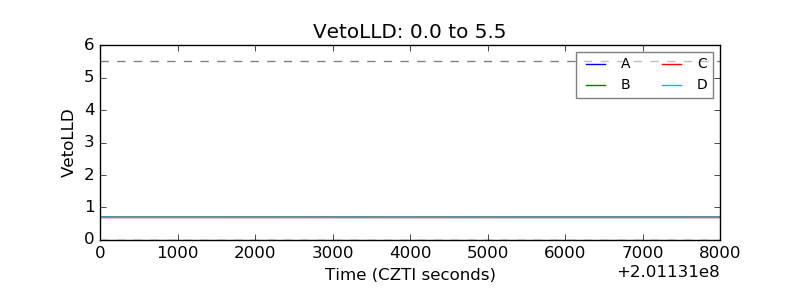 |
| Alpha Counter | 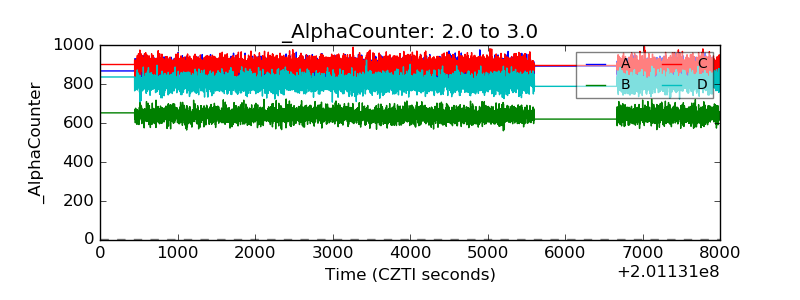 |
| _CPM_Rate | 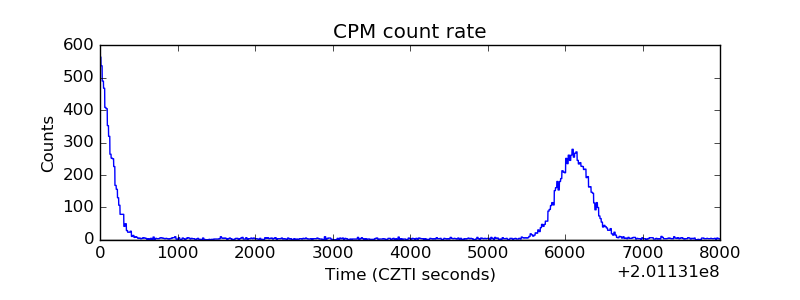 |
| CZT Counter | 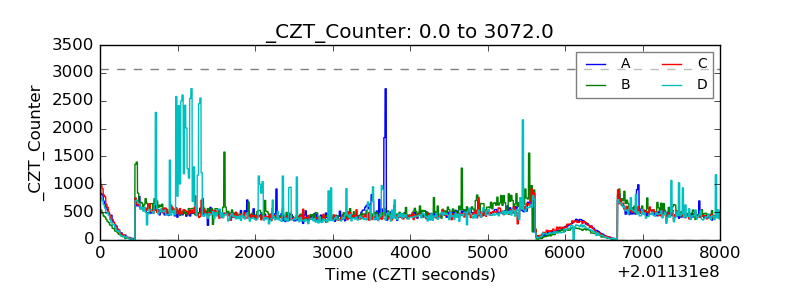 |
| +2.5 Volts monitor |  |
| +5 Volts monitor |  |
| _ROLL_ROT | 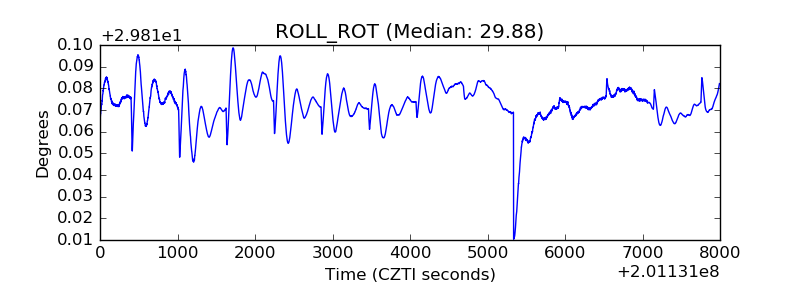 |
| _Roll_DEC | 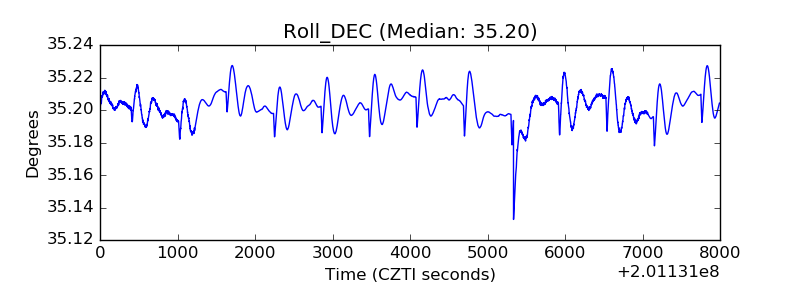 |
| _Roll_RA | 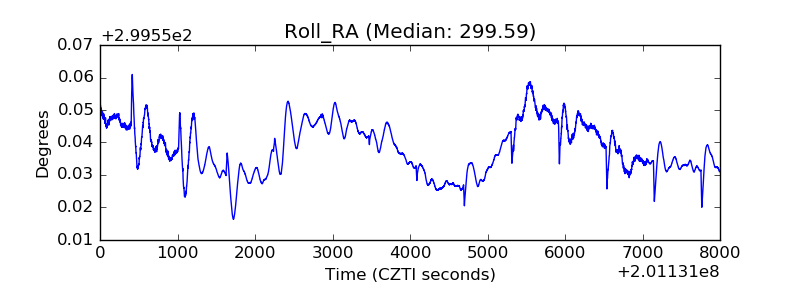 |
| Veto Counter | 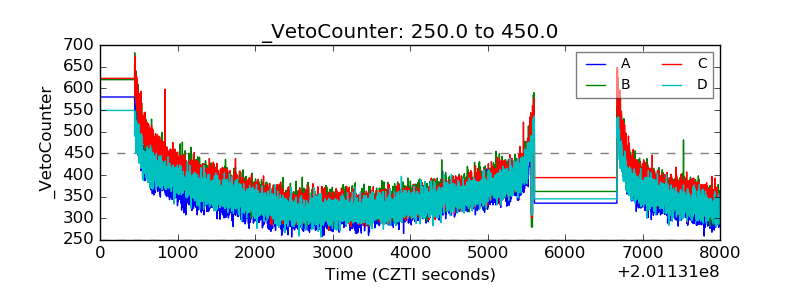 |