| Param | Original file | Final file |
|---|---|---|
| Filename | modeM0/AS1G05_167T01_9000000456_03433cztM0_level2.evt | modeM0/AS1G05_167T01_9000000456_03433cztM0_level2_quad_clean.evt |
| Size (bytes) | 514,782,720 | 92,868,480 |
| Size | 490.9 MB | 88.6 MB |
| Events in quadrant A | 3,403,239 | 584,551 |
| Events in quadrant B | 3,858,659 | 584,761 |
| Events in quadrant C | 4,670,029 | 588,313 |
| Events in quadrant D | 3,180,856 | 565,079 |
| Mode M9 | |||
|---|---|---|---|
| Quadrant | BADHDUFLAG | Total packets | Discarded packets |
| A | 0 | 11 | 0 |
| B | 0 | 11 | 0 |
| C | 0 | 11 | 0 |
| D | 0 | 12 | 0 |
| Mode SS | |||
|---|---|---|---|
| Quadrant | BADHDUFLAG | Total packets | Discarded packets |
| A | 0 | 142 | 0 |
| B | 0 | 142 | 0 |
| C | 0 | 142 | 0 |
| D | 0 | 142 | 0 |
| Mode M0 | |||
|---|---|---|---|
| Quadrant | BADHDUFLAG | Total packets | Discarded packets |
| A | 0 | 14938 | 3 |
| B | 0 | 16252 | 2 |
| C | 0 | 18816 | 2 |
| D | 0 | 14715 | 2 |
| Quadrant | Total seconds | Saturated seconds | Saturation percentage |
|---|---|---|---|
| A | 7033 | 39 | 0.554529% |
| B | 7033 | 88 | 1.251244% |
| C | 7033 | 601 | 8.545429% |
| D | 7033 | 19 | 0.270155% |
Noise dominated data is calculated using 1-second bins in cleaned event files. If a bin has >2000 counts, and if more than 50% of those come from <1% of pixels, then it is considered to be noise-dominated and hence unusable.
| Quadrant | # 1 sec bins | Bins with >0 counts | Bins with >2000 counts | High rate bins dominated by noise | Noise dominated (total time) | Noise dominated (detector-on time) | Marked lightcurve |
|---|---|---|---|---|---|---|---|
| A | 7708 | 7034 | 14 | 14 | 0.18% | 0.20% | 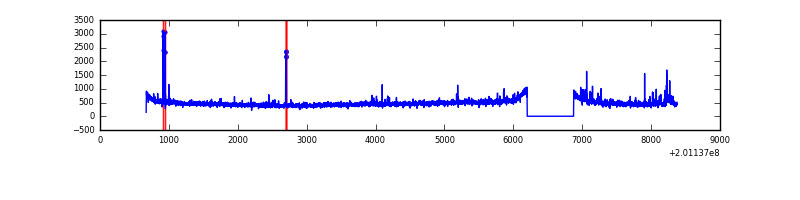 |
| B | 7708 | 7034 | 7 | 7 | 0.09% | 0.10% | 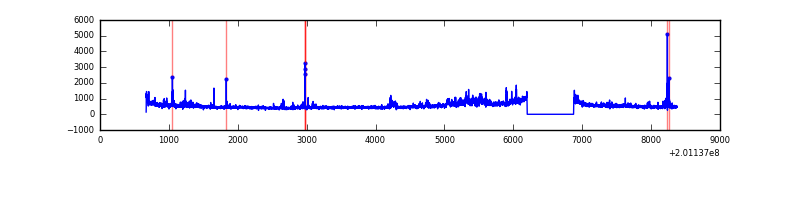 |
| C | 7708 | 7034 | 454 | 454 | 5.89% | 6.45% | 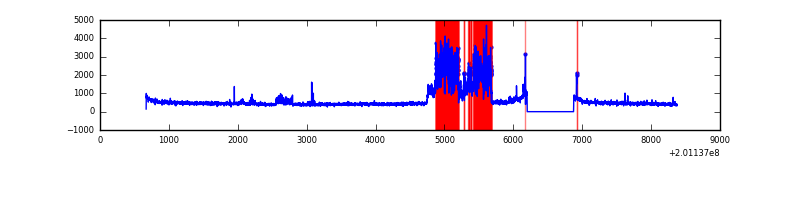 |
| D | 7708 | 7034 | 11 | 11 | 0.14% | 0.16% | 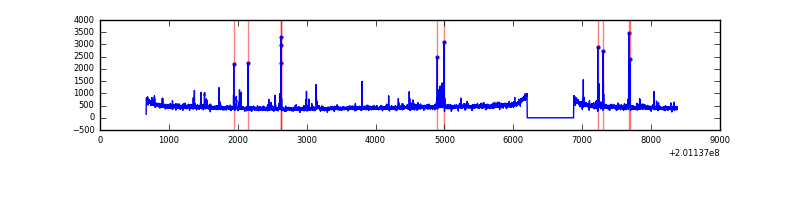 |
Top three noisy pixels from each quadrant. If the there are fewer than three noisy pixels in the level2.evt file, extra rows are filled as -1
| Pixel properties | Quadrant properties | ||||||
|---|---|---|---|---|---|---|---|
| Quadrant | DetID | PixID | Counts | Sigma | Mean | Median | Sigma |
| A | 0 | 118 | 104530 | 602.18 | 829 | 813 | 172.2 |
| A | 14 | 249 | 39833 | 226.55 | 829 | 813 | 172.2 |
| A | 15 | 31 | 21501 | 120.11 | 829 | 813 | 172.2 |
| B | 15 | 204 | 400305 | 2420.44 | 844 | 824 | 165.0 |
| B | 2 | 249 | 60348 | 360.65 | 844 | 824 | 165.0 |
| B | 14 | 167 | 40837 | 242.44 | 844 | 824 | 165.0 |
| C | 1 | 192 | 1559201 | 8417.14 | 788 | 794 | 185.1 |
| C | 8 | 208 | 9710 | 48.15 | 788 | 794 | 185.1 |
| C | 6 | 80 | 7671 | 37.14 | 788 | 794 | 185.1 |
| D | 13 | 223 | 31068 | 154.67 | 804 | 783 | 195.8 |
| D | 2 | 206 | 28001 | 139.01 | 804 | 783 | 195.8 |
| D | 9 | 85 | 23330 | 115.15 | 804 | 783 | 195.8 |
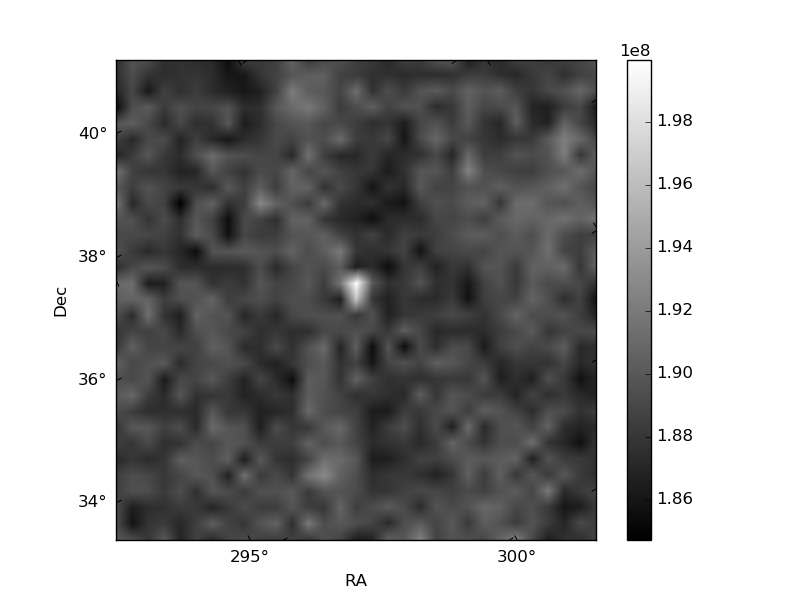
Histogram calculated using DETX and DETY for each event in the final _common_clean file
| Quadrant A | 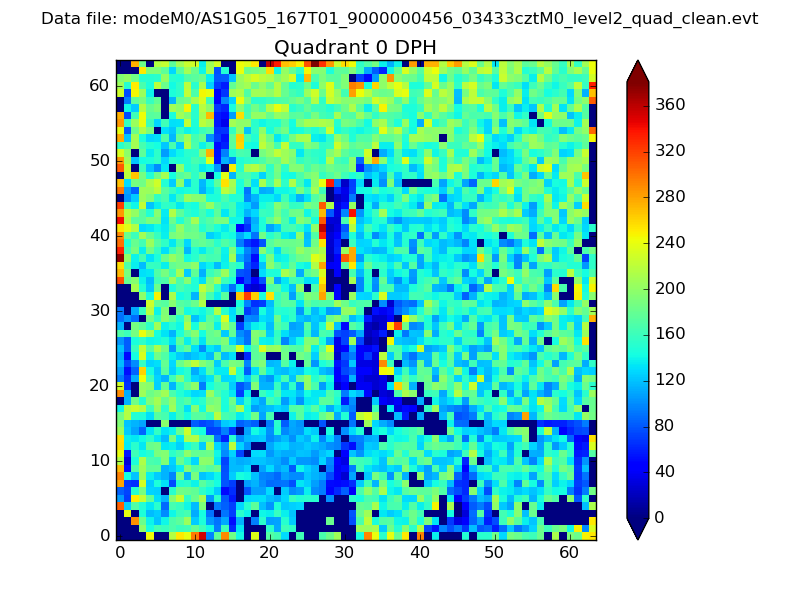 |
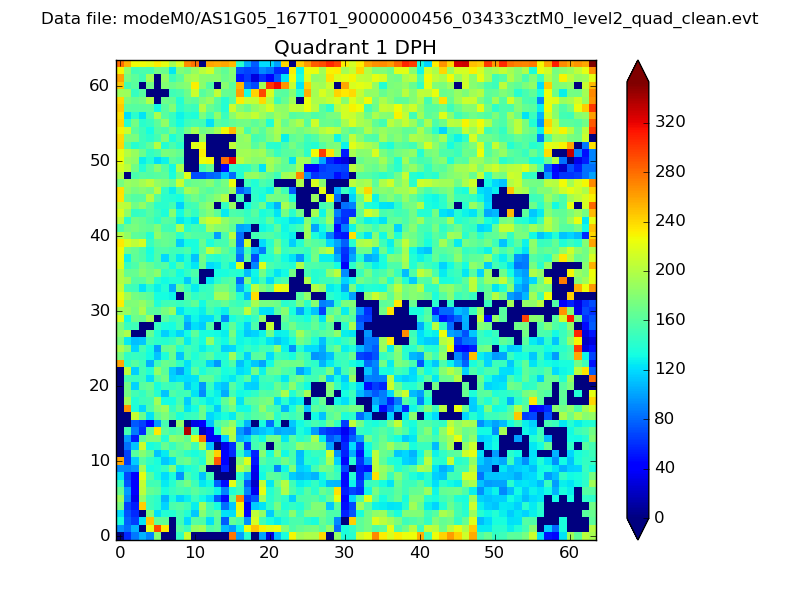 |
Quadrant B |
|---|---|---|---|
| Quadrant D | 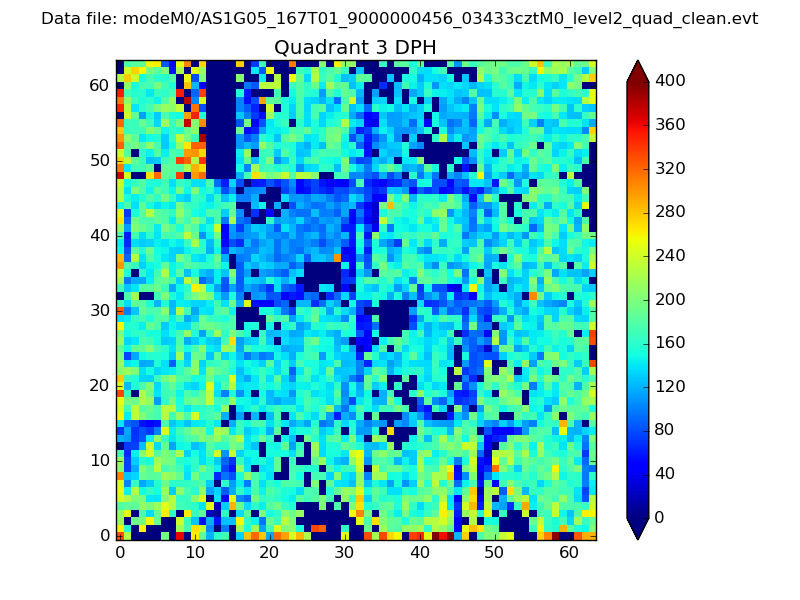 |
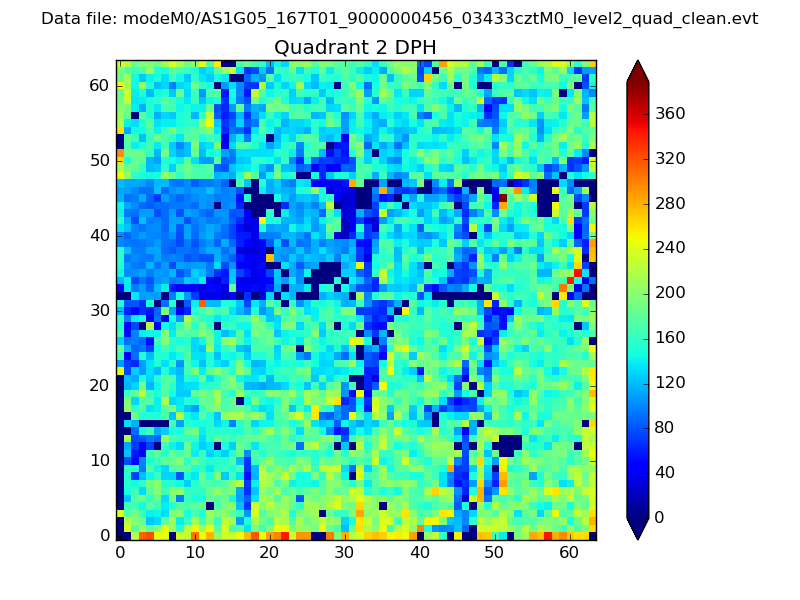 |
Quadrant C |
| Plot type | Count rate plots | Images |
|---|---|---|
| Comparison with Poisson distribution Blue bars denote a histogram of data divided into 1 sec bins. Red curve is a Poisson curve with rate = median count rate of data. |
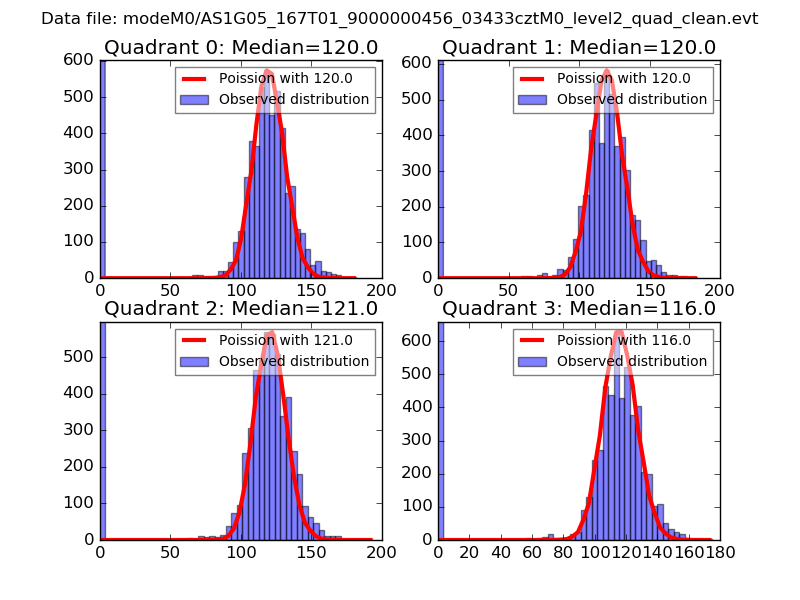 |
 |
| Quadrant-wise count rates Data is divided into 100 sec bins |
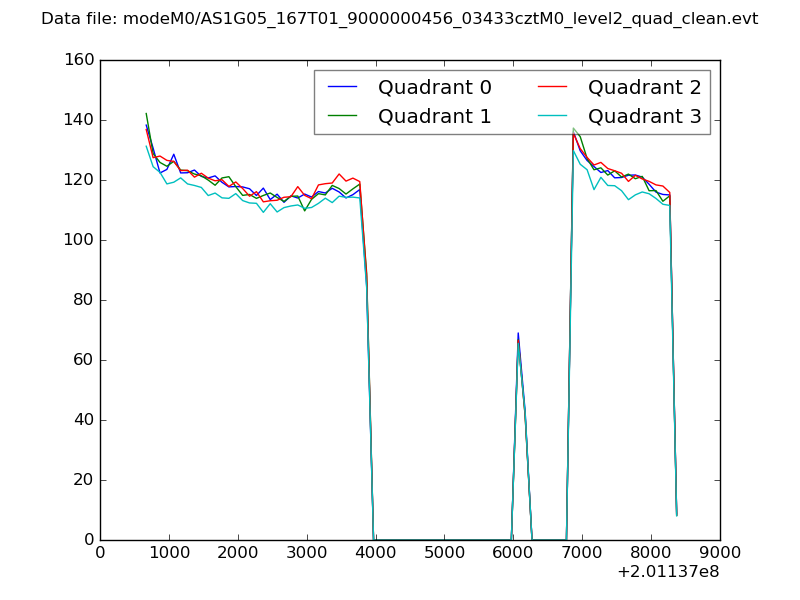 |
|
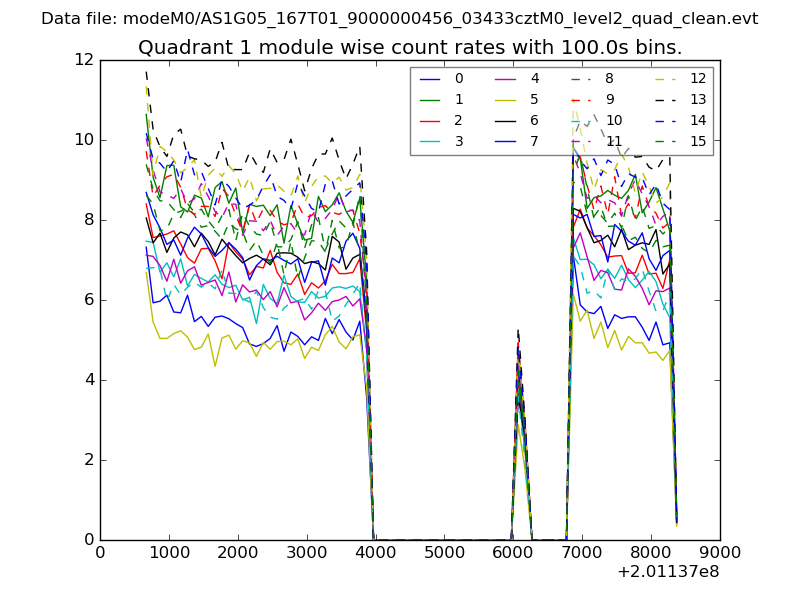
| Module-wise count rates for Quadrant A Data is divided into 100 sec bins |
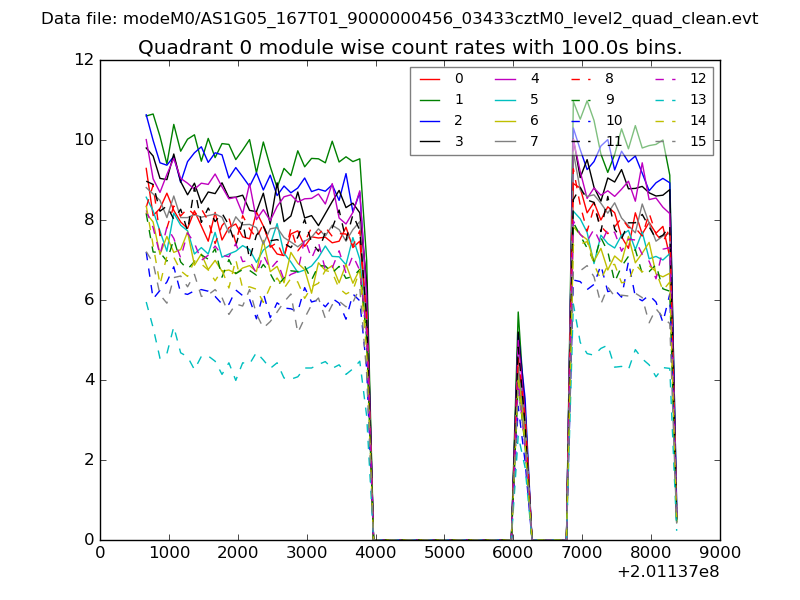 |
 |
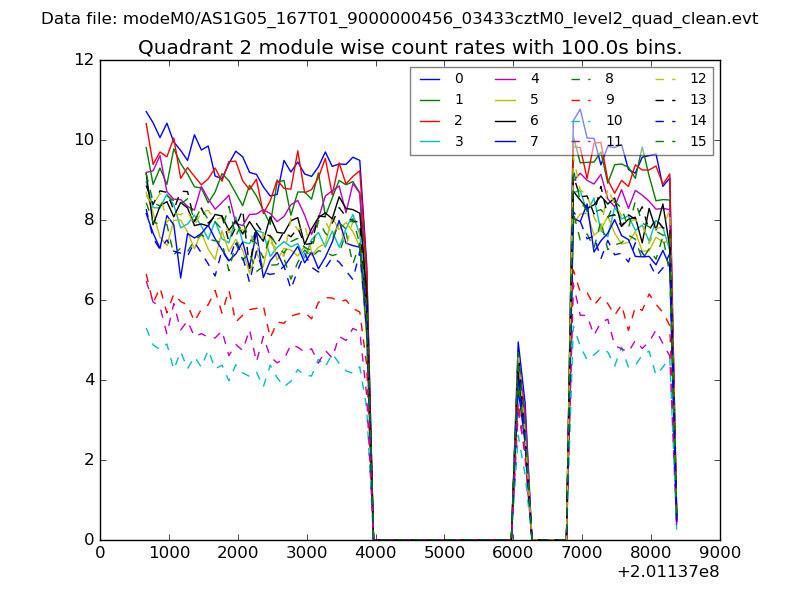
| Module-wise count rates for Quadrant B Data is divided into 100 sec bins |
 |
 |
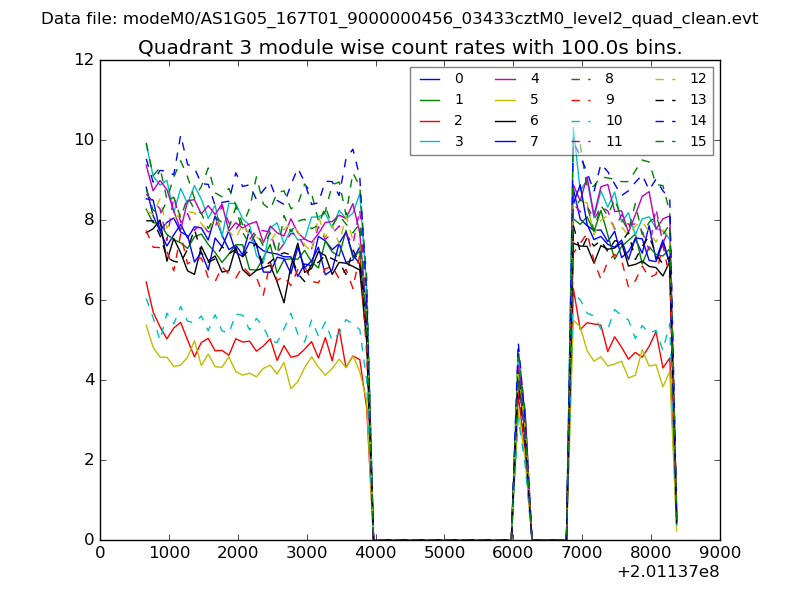
| Module-wise count rates for Quadrant C Data is divided into 100 sec bins |
 |
 |
| Module-wise count rates for Quadrant D Data is divided into 100 sec bins |
 |
 |
| Parameter | Plot |
|---|---|
| CZT HV Monitor | 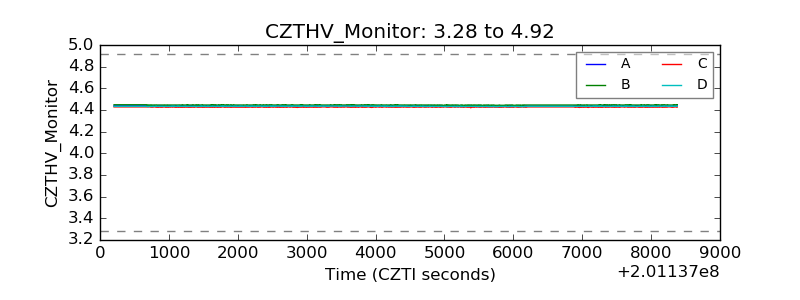 |
| D_VDD |  |
| Temperature 1 | 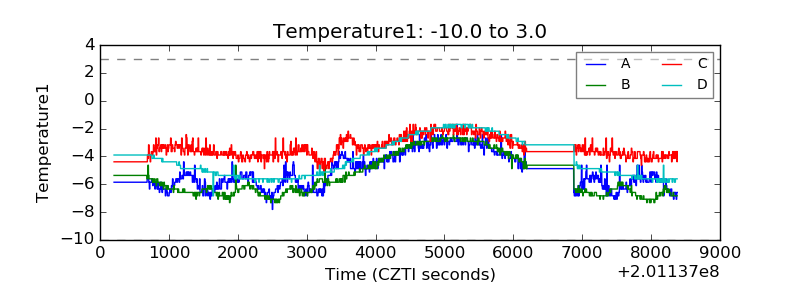 |
| Veto HV Monitor | 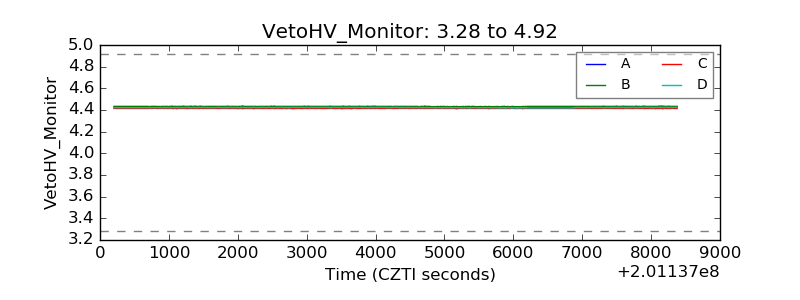 |
| Veto LLD | 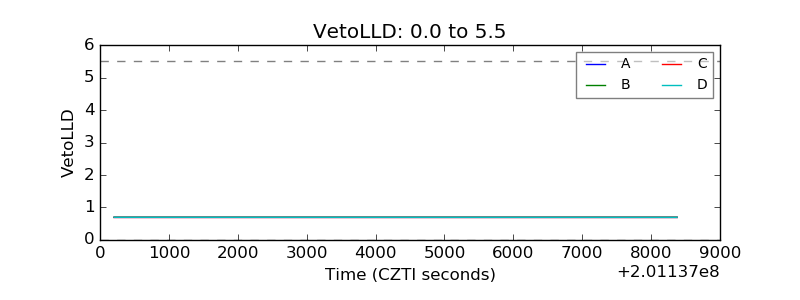 |
| Alpha Counter | 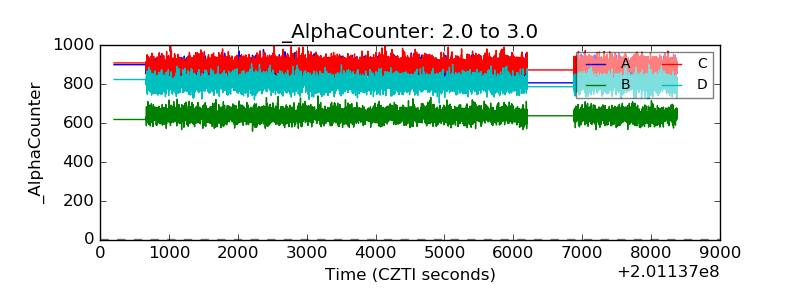 |
| _CPM_Rate | 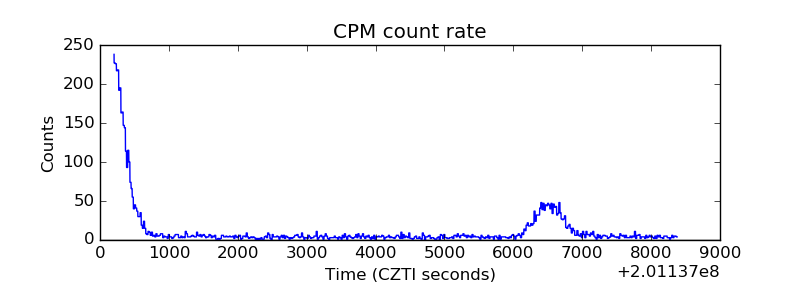 |
| CZT Counter | 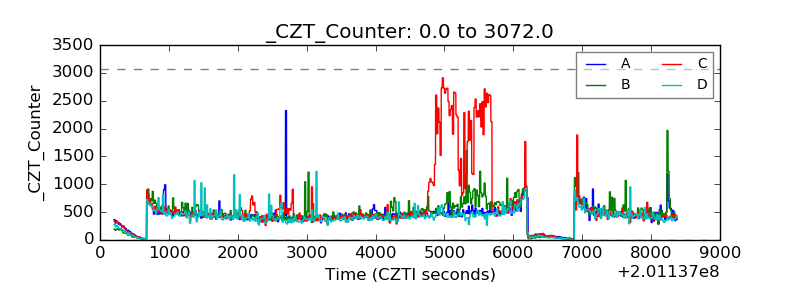 |
| +2.5 Volts monitor |  |
| +5 Volts monitor |  |
| _ROLL_ROT | 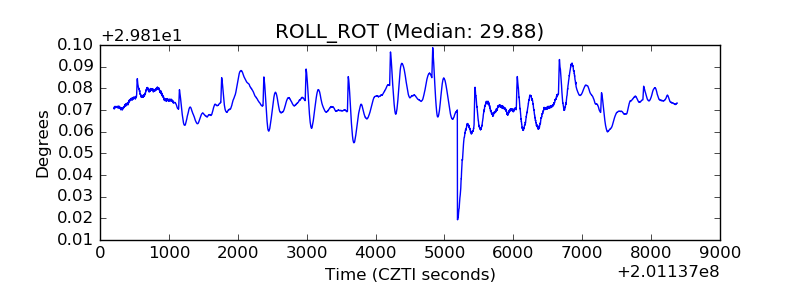 |
| _Roll_DEC | 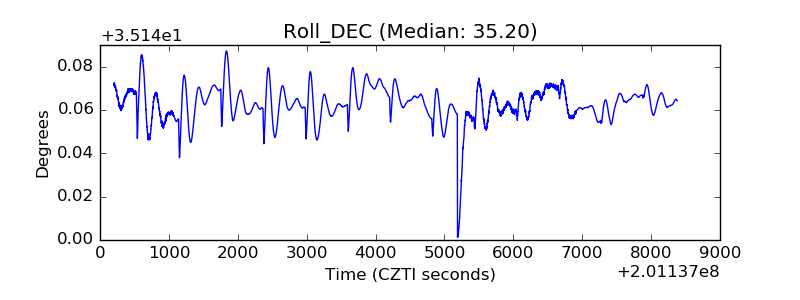 |
| _Roll_RA |  |
| Veto Counter | 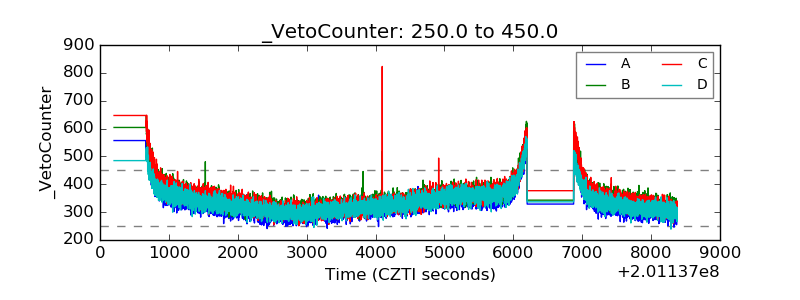 |