| Param | Original file | Final file |
|---|---|---|
| Filename | modeM0/AS1G05_167T01_9000000456_03434cztM0_level2.evt | modeM0/AS1G05_167T01_9000000456_03434cztM0_level2_quad_clean.evt |
| Size (bytes) | 531,938,880 | 106,050,240 |
| Size | 507.3 MB | 101.1 MB |
| Events in quadrant A | 3,864,531 | 672,784 |
| Events in quadrant B | 4,326,335 | 673,690 |
| Events in quadrant C | 3,783,441 | 675,812 |
| Events in quadrant D | 3,606,161 | 647,314 |
| Mode M9 | |||
|---|---|---|---|
| Quadrant | BADHDUFLAG | Total packets | Discarded packets |
| A | 0 | 7 | 0 |
| B | 0 | 7 | 0 |
| C | 0 | 7 | 0 |
| D | 0 | 7 | 0 |
| Mode SS | |||
|---|---|---|---|
| Quadrant | BADHDUFLAG | Total packets | Discarded packets |
| A | 0 | 158 | 0 |
| B | 0 | 158 | 0 |
| C | 0 | 158 | 0 |
| D | 0 | 158 | 0 |
| Mode M0 | |||
|---|---|---|---|
| Quadrant | BADHDUFLAG | Total packets | Discarded packets |
| A | 0 | 16852 | 4 |
| B | 0 | 18070 | 3 |
| C | 0 | 16770 | 3 |
| D | 0 | 16604 | 3 |
| Quadrant | Total seconds | Saturated seconds | Saturation percentage |
|---|---|---|---|
| A | 7796 | 103 | 1.321190% |
| B | 7796 | 179 | 2.296049% |
| C | 7796 | 97 | 1.244228% |
| D | 7796 | 49 | 0.628527% |
Noise dominated data is calculated using 1-second bins in cleaned event files. If a bin has >2000 counts, and if more than 50% of those come from <1% of pixels, then it is considered to be noise-dominated and hence unusable.
| Quadrant | # 1 sec bins | Bins with >0 counts | Bins with >2000 counts | High rate bins dominated by noise | Noise dominated (total time) | Noise dominated (detector-on time) | Marked lightcurve |
|---|---|---|---|---|---|---|---|
| A | 8501 | 7799 | 7 | 7 | 0.08% | 0.09% | 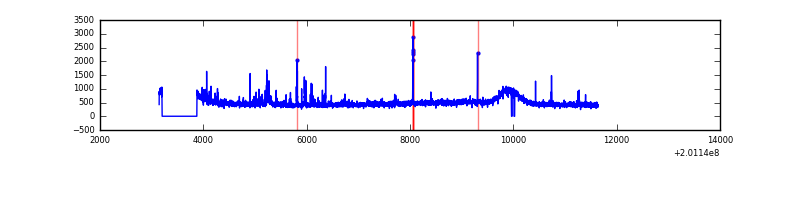 |
| B | 8501 | 7799 | 2 | 2 | 0.02% | 0.03% | 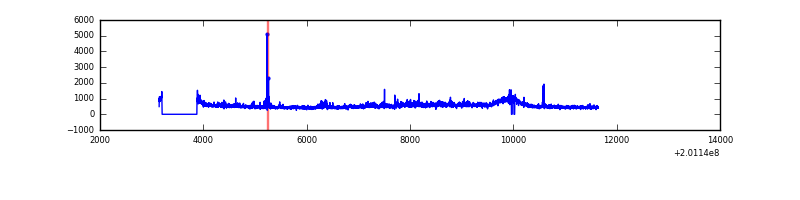 |
| C | 8501 | 7799 | 7 | 7 | 0.08% | 0.09% |  |
| D | 8501 | 7799 | 16 | 16 | 0.19% | 0.21% | 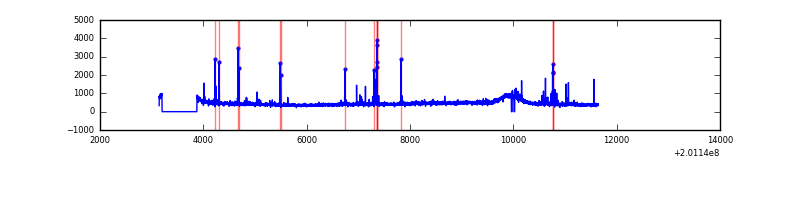 |
Top three noisy pixels from each quadrant. If the there are fewer than three noisy pixels in the level2.evt file, extra rows are filled as -1
| Pixel properties | Quadrant properties | ||||||
|---|---|---|---|---|---|---|---|
| Quadrant | DetID | PixID | Counts | Sigma | Mean | Median | Sigma |
| A | 0 | 118 | 135733 | 689.72 | 945 | 926 | 195.5 |
| A | 0 | 31 | 25925 | 127.9 | 945 | 926 | 195.5 |
| A | 0 | 226 | 21611 | 105.83 | 945 | 926 | 195.5 |
| B | 15 | 204 | 506346 | 2663.96 | 960 | 937 | 189.7 |
| B | 2 | 249 | 32599 | 166.89 | 960 | 937 | 189.7 |
| B | 4 | 81 | 21042 | 105.97 | 960 | 937 | 189.7 |
| C | 1 | 192 | 113823 | 512.9 | 926 | 934 | 220.1 |
| C | 15 | 208 | 28987 | 127.46 | 926 | 934 | 220.1 |
| C | 12 | 4 | 8995 | 36.62 | 926 | 934 | 220.1 |
| D | 9 | 85 | 45759 | 201.71 | 913 | 887 | 222.5 |
| D | 13 | 223 | 23829 | 103.13 | 913 | 887 | 222.5 |
| D | 2 | 206 | 19823 | 85.12 | 913 | 887 | 222.5 |
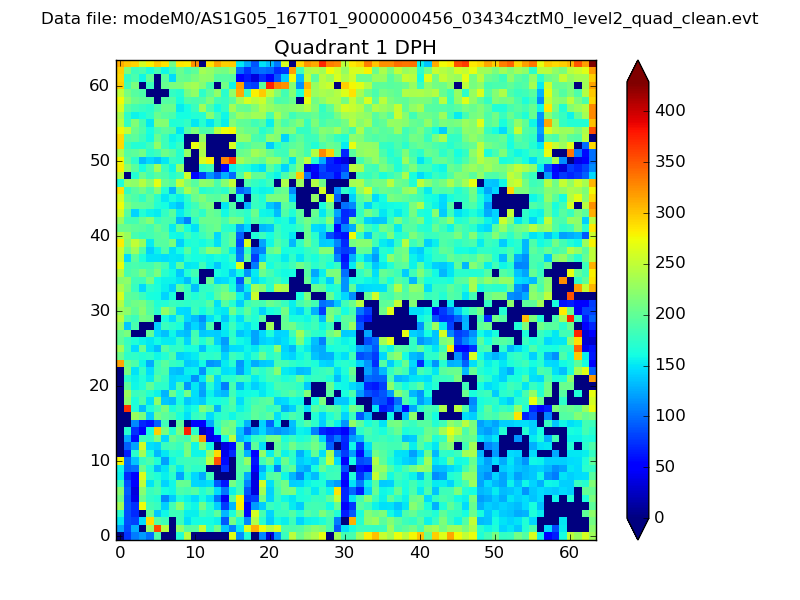
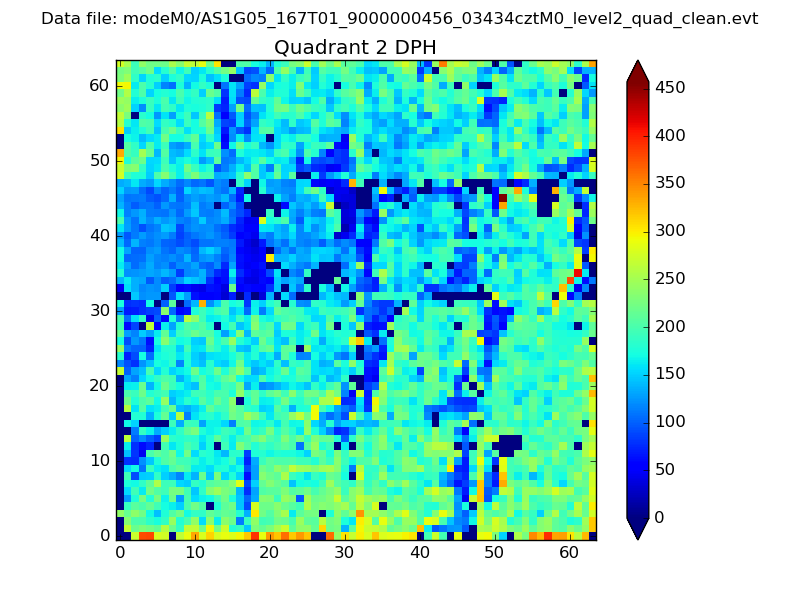
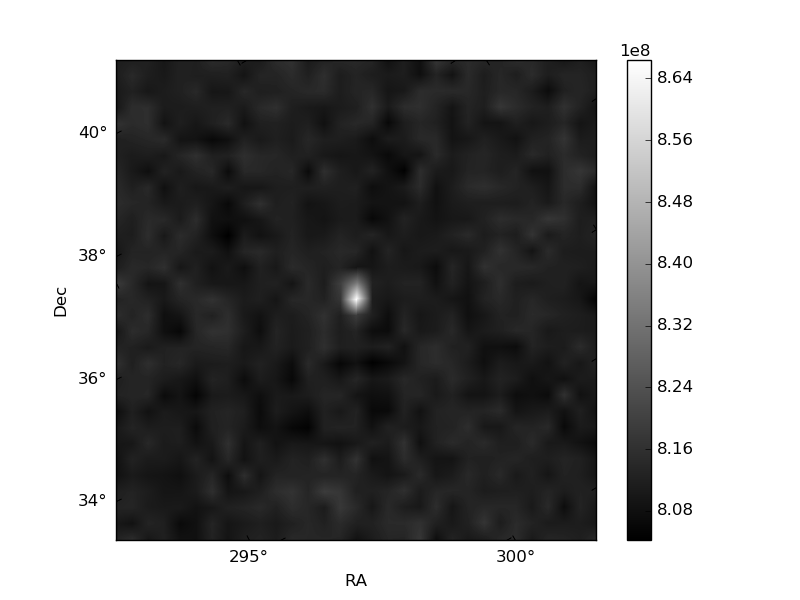
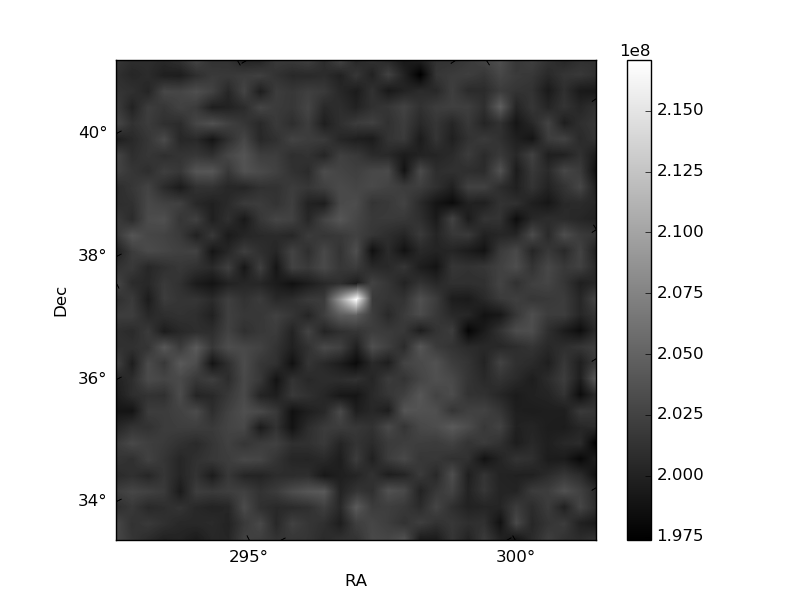
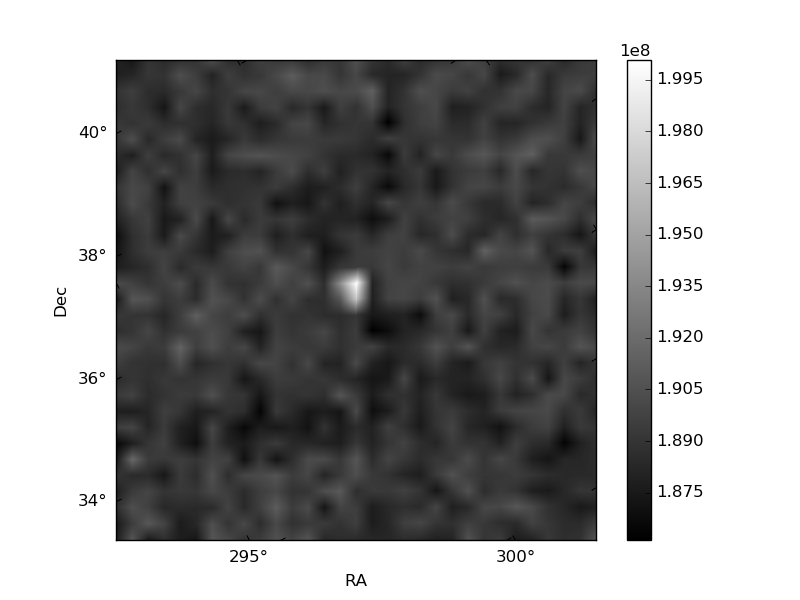
Histogram calculated using DETX and DETY for each event in the final _common_clean file
| Quadrant A | 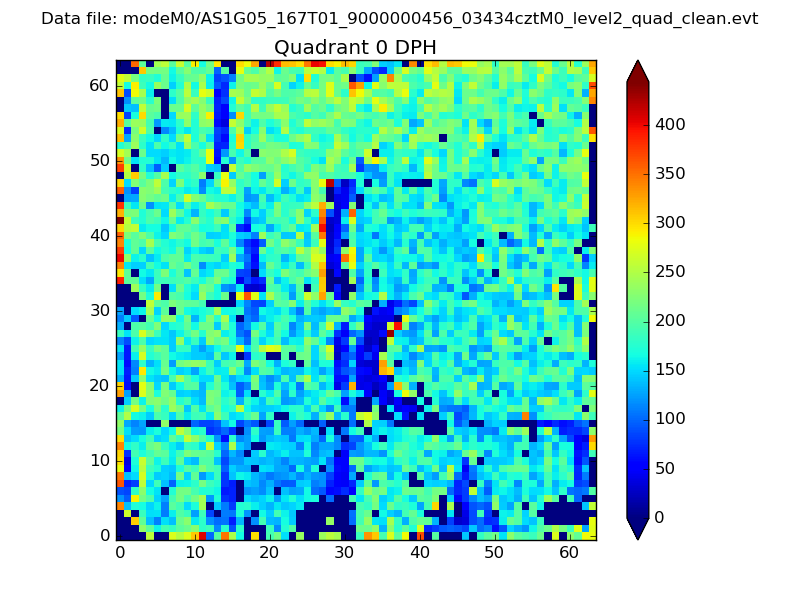 |
 |
Quadrant B |
|---|---|---|---|
| Quadrant D | 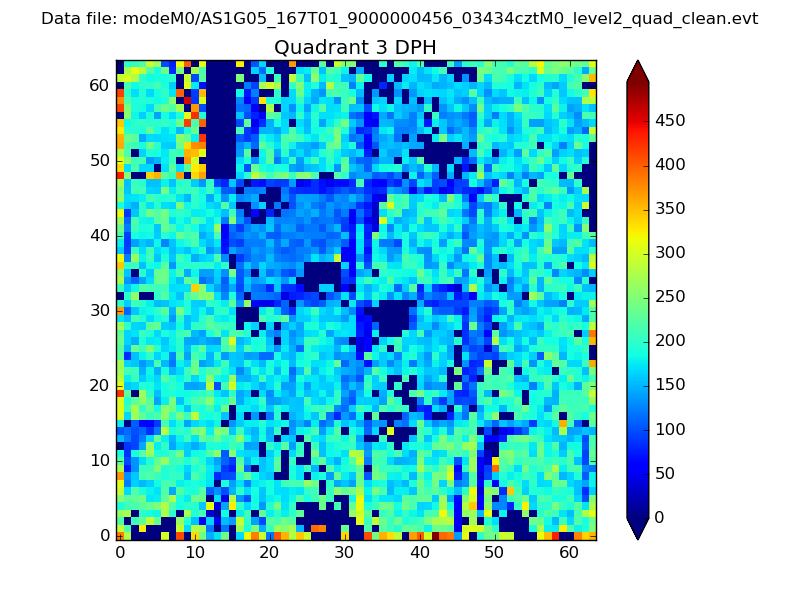 |
 |
Quadrant C |
| Plot type | Count rate plots | Images |
|---|---|---|
| Comparison with Poisson distribution Blue bars denote a histogram of data divided into 1 sec bins. Red curve is a Poisson curve with rate = median count rate of data. |
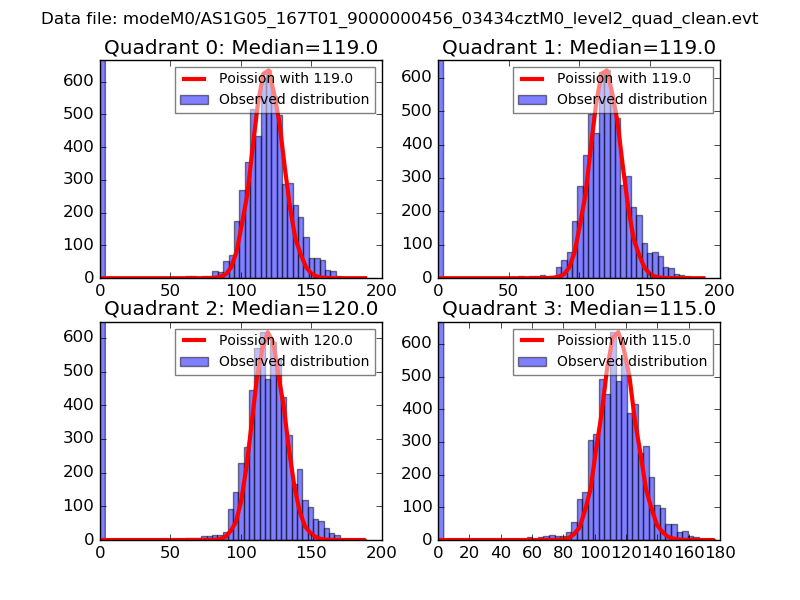 |
 |
| Quadrant-wise count rates Data is divided into 100 sec bins |
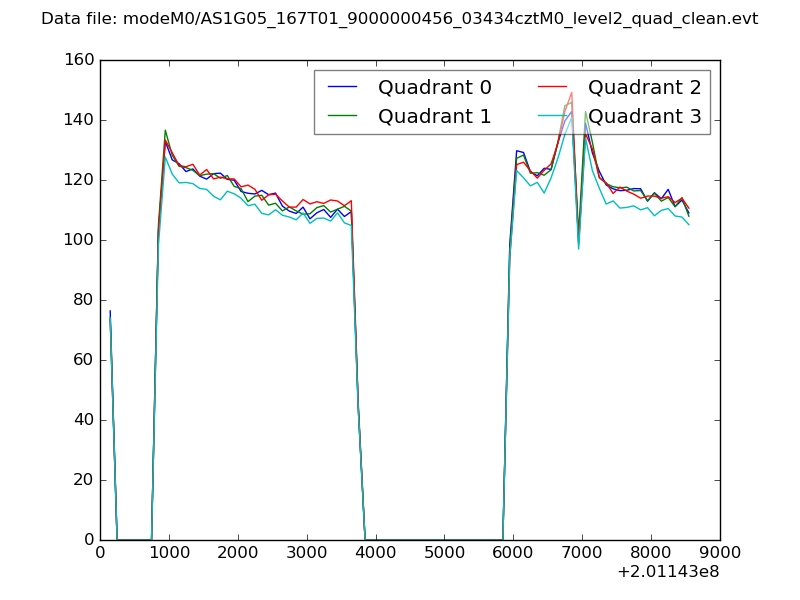 |
|
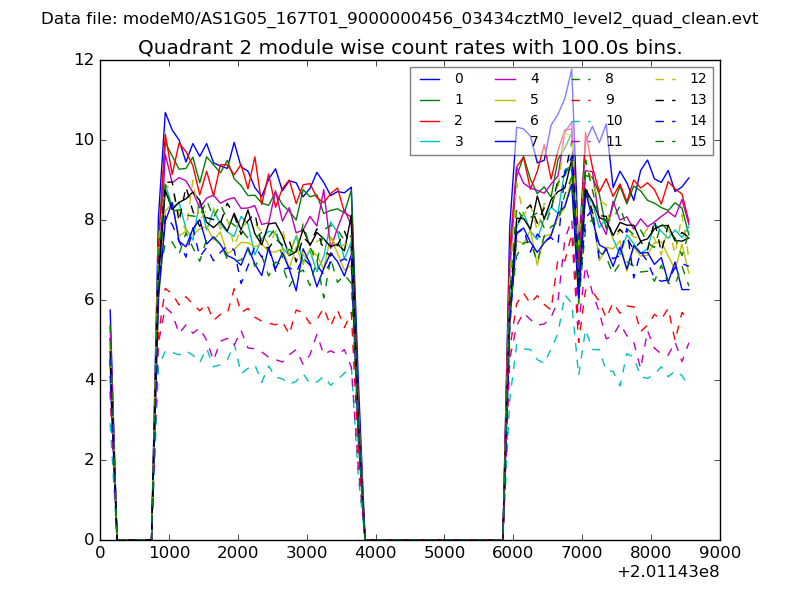
| Module-wise count rates for Quadrant A Data is divided into 100 sec bins |
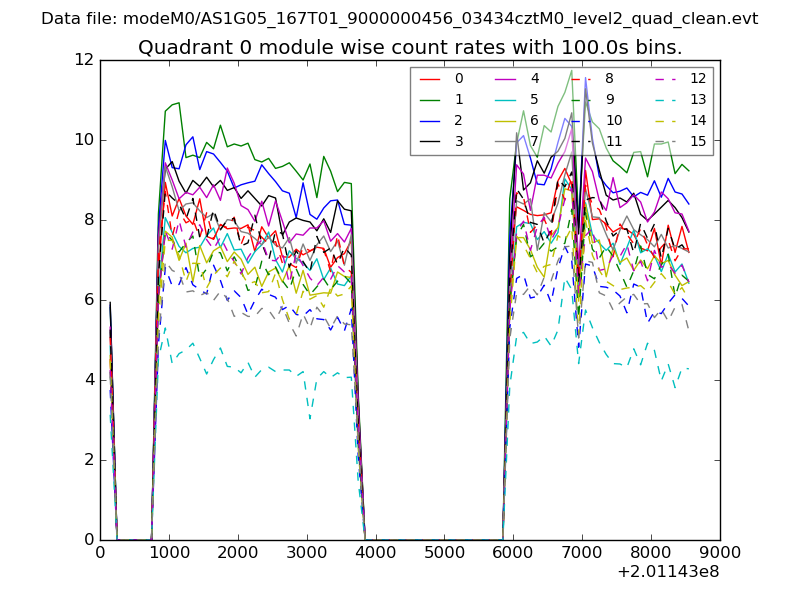 |
 |
| Module-wise count rates for Quadrant B Data is divided into 100 sec bins |
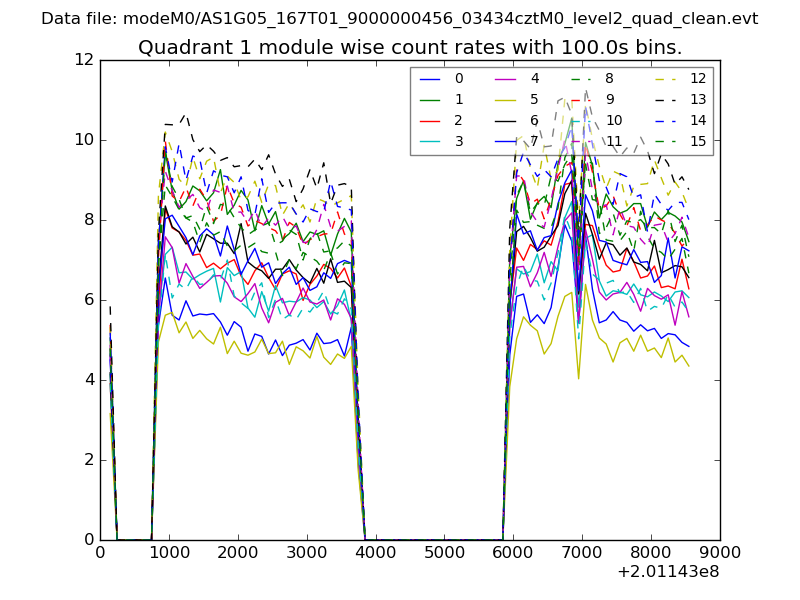 |
 |
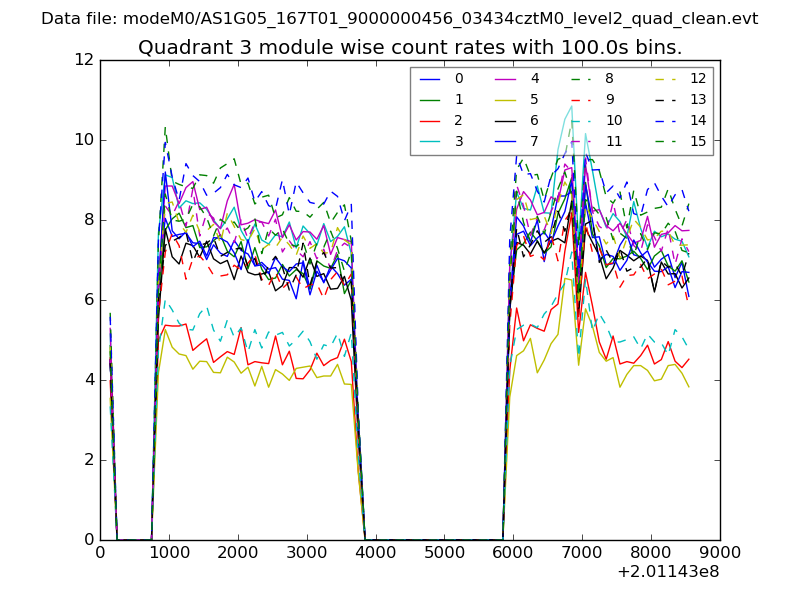
| Module-wise count rates for Quadrant C Data is divided into 100 sec bins |
 |
 |
| Module-wise count rates for Quadrant D Data is divided into 100 sec bins |
 |
 |
| Parameter | Plot |
|---|---|
| CZT HV Monitor | 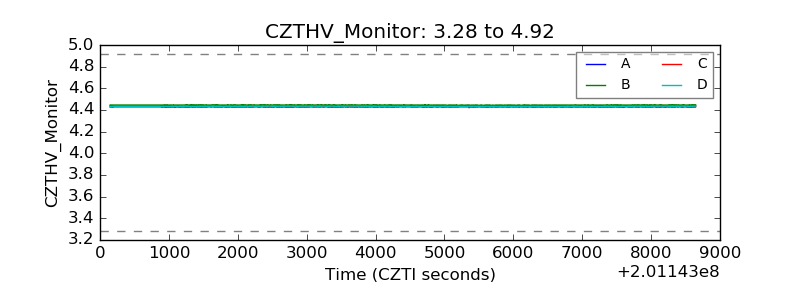 |
| D_VDD | 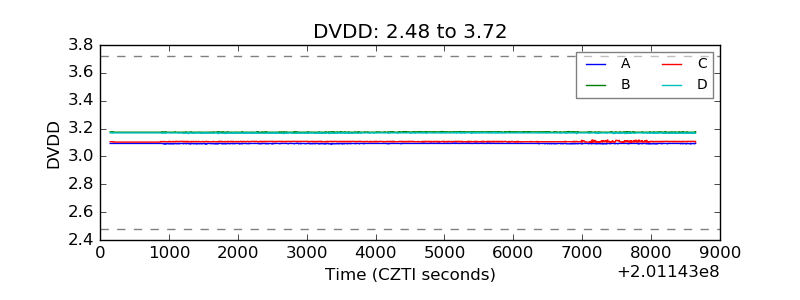 |
| Temperature 1 | 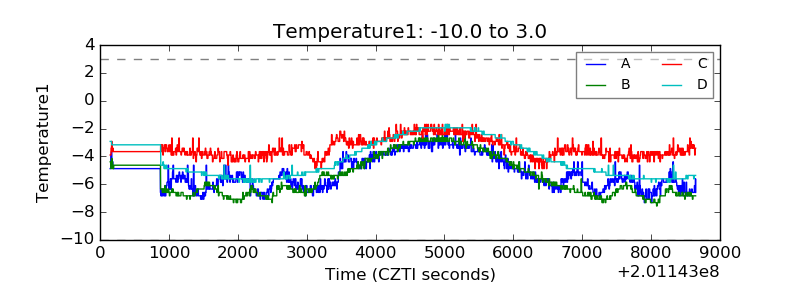 |
| Veto HV Monitor |  |
| Veto LLD | 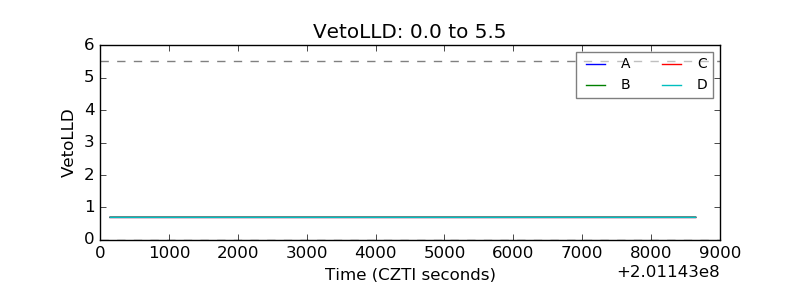 |
| Alpha Counter | 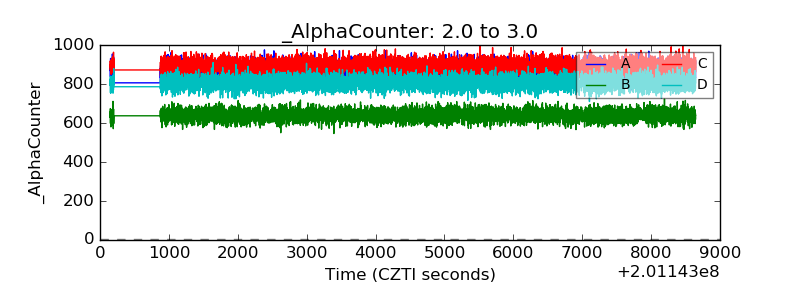 |
| _CPM_Rate | 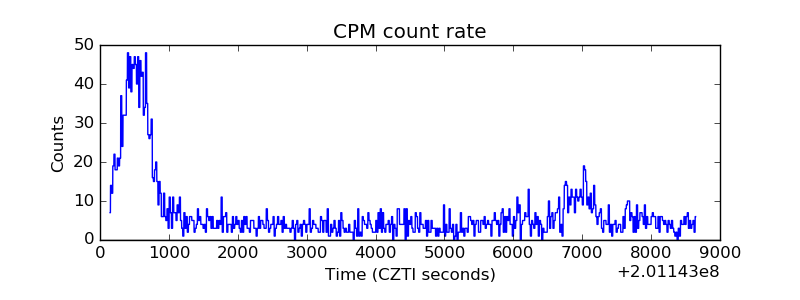 |
| CZT Counter | 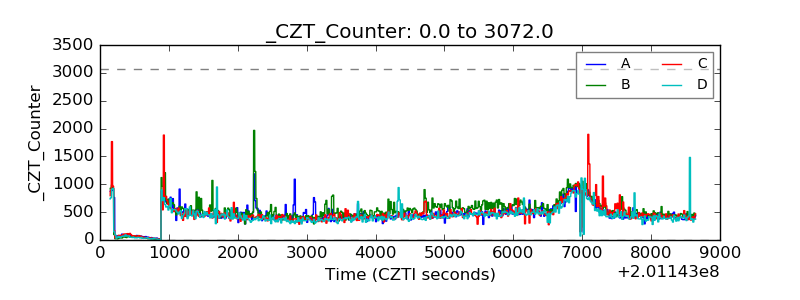 |
| +2.5 Volts monitor |  |
| +5 Volts monitor |  |
| _ROLL_ROT | 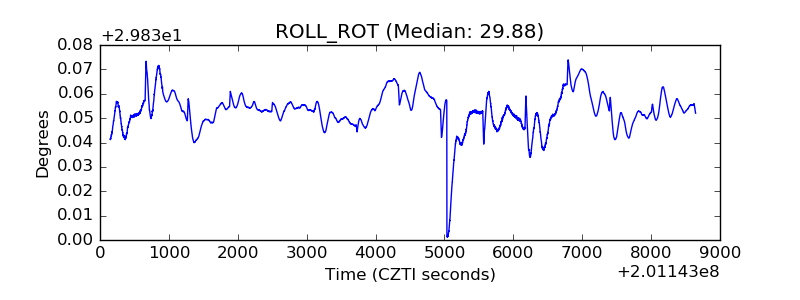 |
| _Roll_DEC | 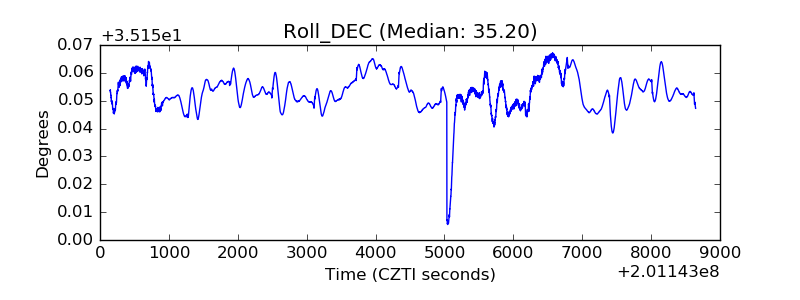 |
| _Roll_RA | 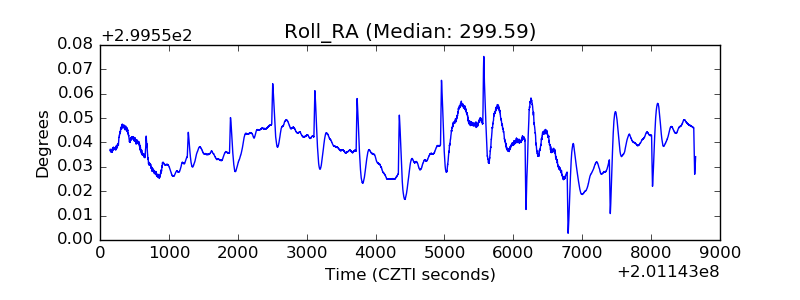 |
| Veto Counter | 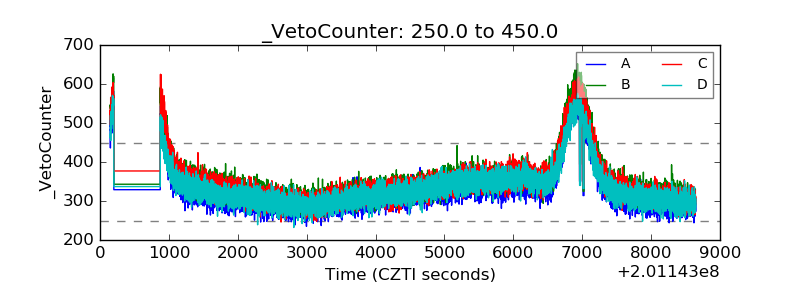 |