| Param | Original file | Final file |
|---|---|---|
| Filename | modeM0/AS1G05_167T01_9000000456_03435cztM0_level2.evt | modeM0/AS1G05_167T01_9000000456_03435cztM0_level2_quad_clean.evt |
| Size (bytes) | 586,333,440 | 111,271,680 |
| Size | 559.2 MB | 106.1 MB |
| Events in quadrant A | 3,910,199 | 706,693 |
| Events in quadrant B | 4,708,104 | 705,019 |
| Events in quadrant C | 4,781,917 | 706,174 |
| Events in quadrant D | 3,800,883 | 682,416 |
| Mode SS | |||
|---|---|---|---|
| Quadrant | BADHDUFLAG | Total packets | Discarded packets |
| A | 0 | 164 | 0 |
| B | 0 | 164 | 0 |
| C | 0 | 164 | 0 |
| D | 0 | 164 | 0 |
| Mode M0 | |||
|---|---|---|---|
| Quadrant | BADHDUFLAG | Total packets | Discarded packets |
| A | 0 | 17456 | 3 |
| B | 0 | 19559 | 2 |
| C | 0 | 20023 | 2 |
| D | 0 | 17555 | 2 |
| Quadrant | Total seconds | Saturated seconds | Saturation percentage |
|---|---|---|---|
| A | 8193 | 130 | 1.586720% |
| B | 8193 | 273 | 3.332113% |
| C | 8193 | 327 | 3.991212% |
| D | 8193 | 57 | 0.695716% |
Noise dominated data is calculated using 1-second bins in cleaned event files. If a bin has >2000 counts, and if more than 50% of those come from <1% of pixels, then it is considered to be noise-dominated and hence unusable.
| Quadrant | # 1 sec bins | Bins with >0 counts | Bins with >2000 counts | High rate bins dominated by noise | Noise dominated (total time) | Noise dominated (detector-on time) | Marked lightcurve |
|---|---|---|---|---|---|---|---|
| A | 8223 | 8195 | 8 | 8 | 0.10% | 0.10% | 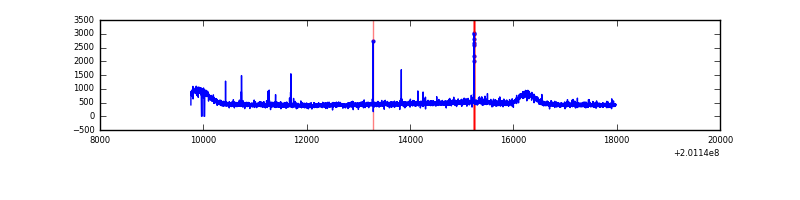 |
| B | 8223 | 8195 | 53 | 53 | 0.64% | 0.65% | 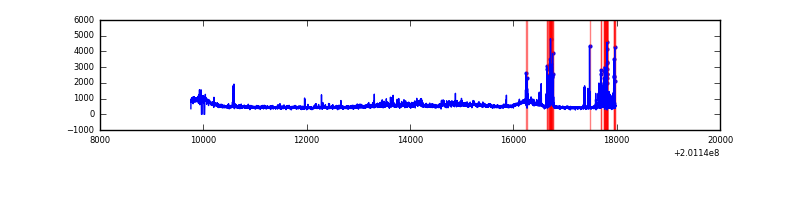 |
| C | 8223 | 8195 | 229 | 229 | 2.78% | 2.79% | 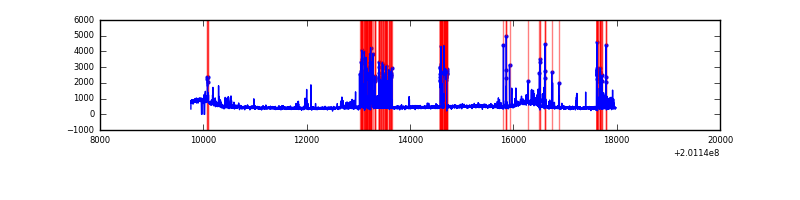 |
| D | 8223 | 8195 | 15 | 15 | 0.18% | 0.18% | 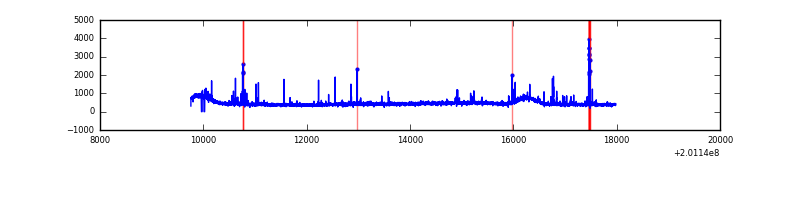 |
Top three noisy pixels from each quadrant. If the there are fewer than three noisy pixels in the level2.evt file, extra rows are filled as -1
| Pixel properties | Quadrant properties | ||||||
|---|---|---|---|---|---|---|---|
| Quadrant | DetID | PixID | Counts | Sigma | Mean | Median | Sigma |
| A | 0 | 118 | 25245 | 117.26 | 992 | 971 | 207.0 |
| A | 0 | 50 | 23034 | 106.58 | 992 | 971 | 207.0 |
| A | 14 | 249 | 13572 | 60.87 | 992 | 971 | 207.0 |
| B | 15 | 204 | 414323 | 2090.62 | 1003 | 980 | 197.7 |
| B | 2 | 249 | 339830 | 1713.84 | 1003 | 980 | 197.7 |
| B | 4 | 81 | 25089 | 121.94 | 1003 | 980 | 197.7 |
| C | 1 | 192 | 853437 | 3774.42 | 954 | 961 | 225.9 |
| C | 14 | 234 | 122447 | 537.89 | 954 | 961 | 225.9 |
| C | 8 | 208 | 38848 | 167.75 | 954 | 961 | 225.9 |
| D | 2 | 31 | 57976 | 243.4 | 958 | 931 | 234.4 |
| D | 13 | 223 | 28147 | 116.13 | 958 | 931 | 234.4 |
| D | 9 | 85 | 28015 | 115.56 | 958 | 931 | 234.4 |
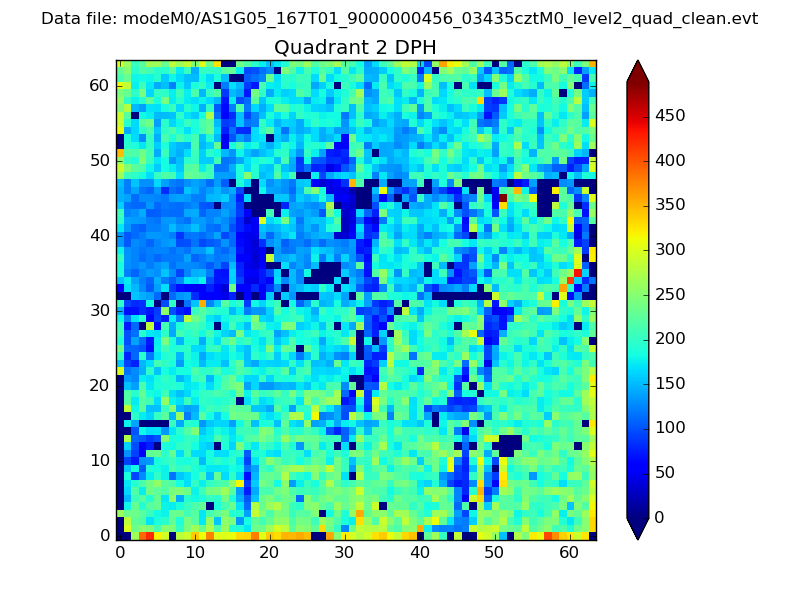
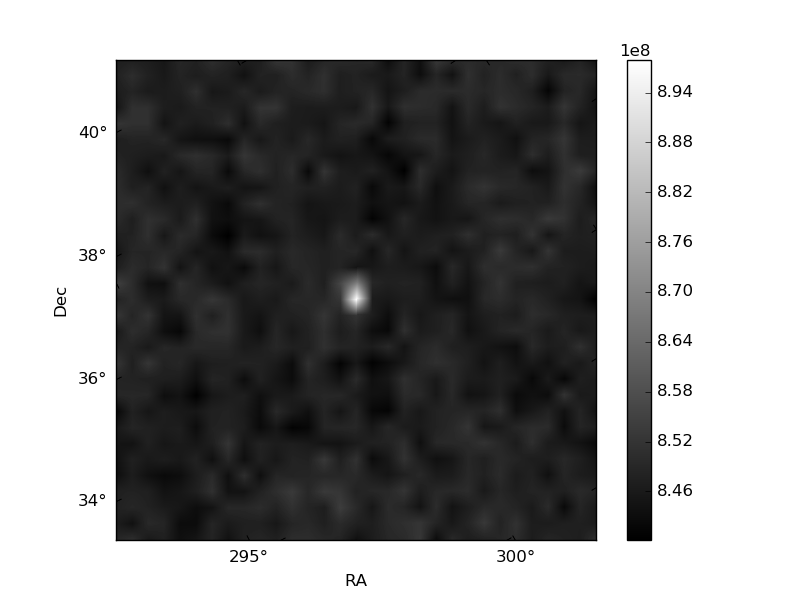
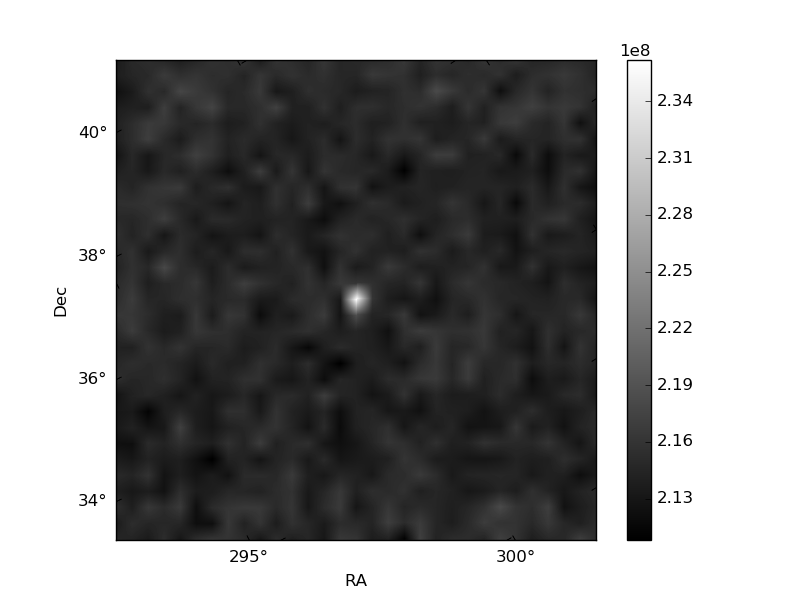
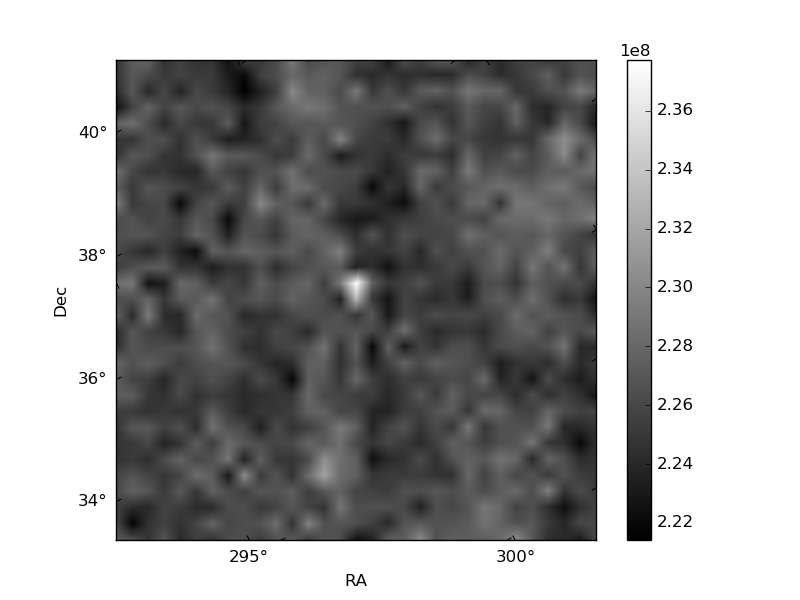
Histogram calculated using DETX and DETY for each event in the final _common_clean file
| Quadrant A | 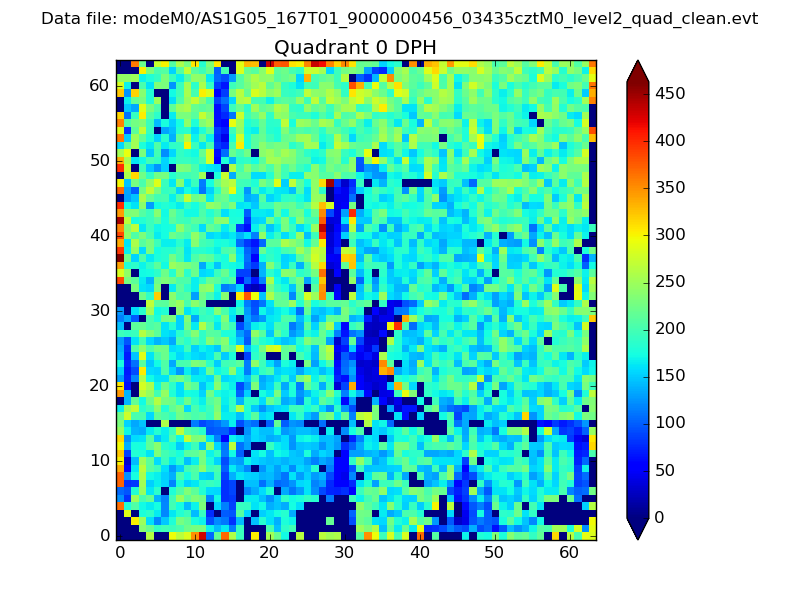 |
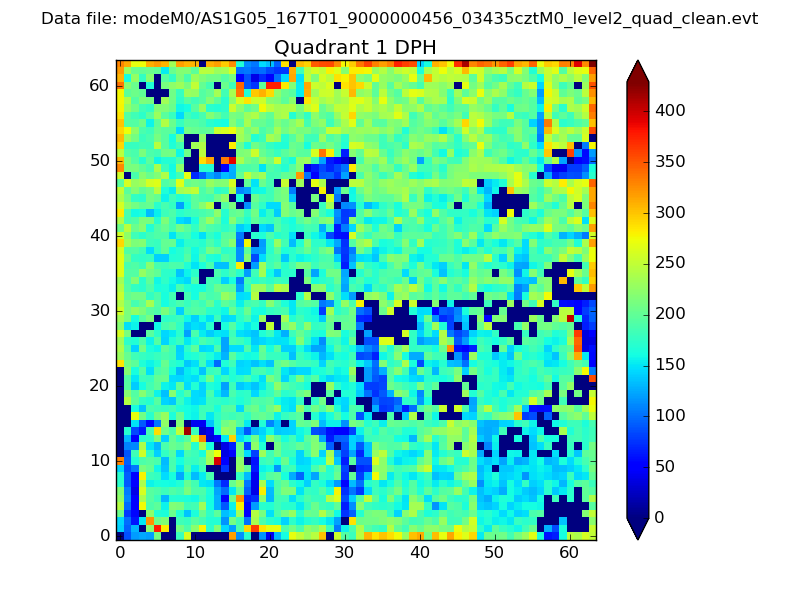 |
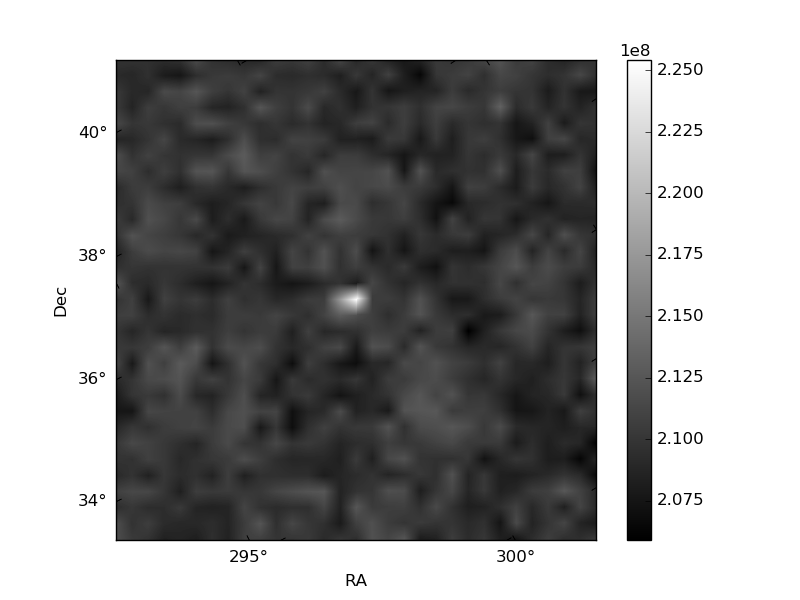
Quadrant B |
|---|---|---|---|
| Quadrant D | 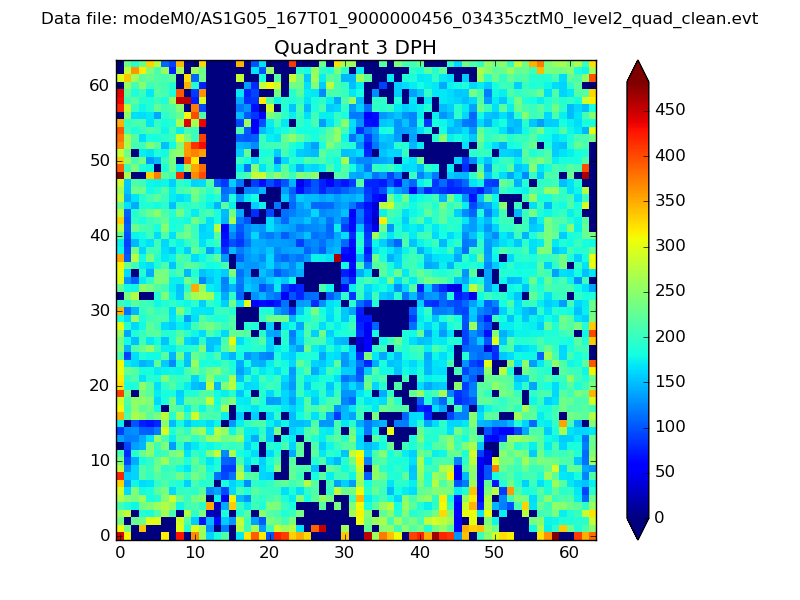 |
 |
Quadrant C |
| Plot type | Count rate plots | Images |
|---|---|---|
| Comparison with Poisson distribution Blue bars denote a histogram of data divided into 1 sec bins. Red curve is a Poisson curve with rate = median count rate of data. |
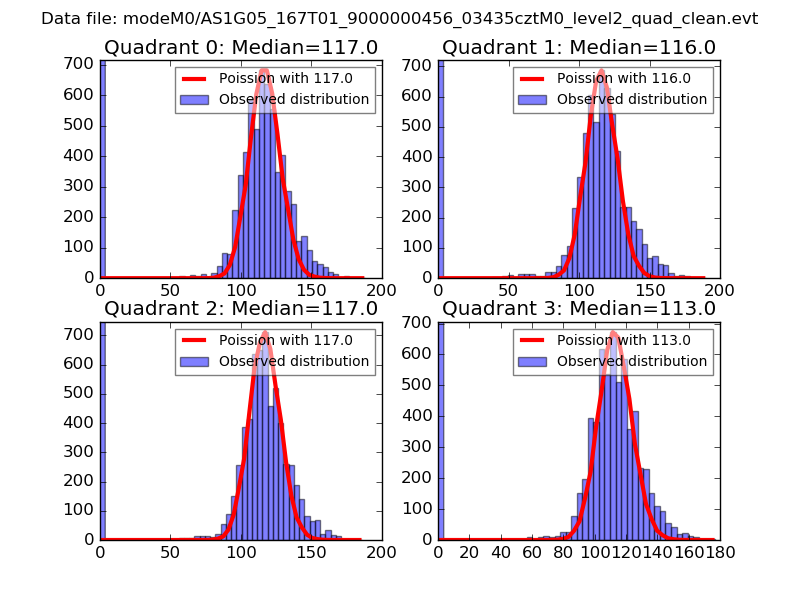 |
 |
| Quadrant-wise count rates Data is divided into 100 sec bins |
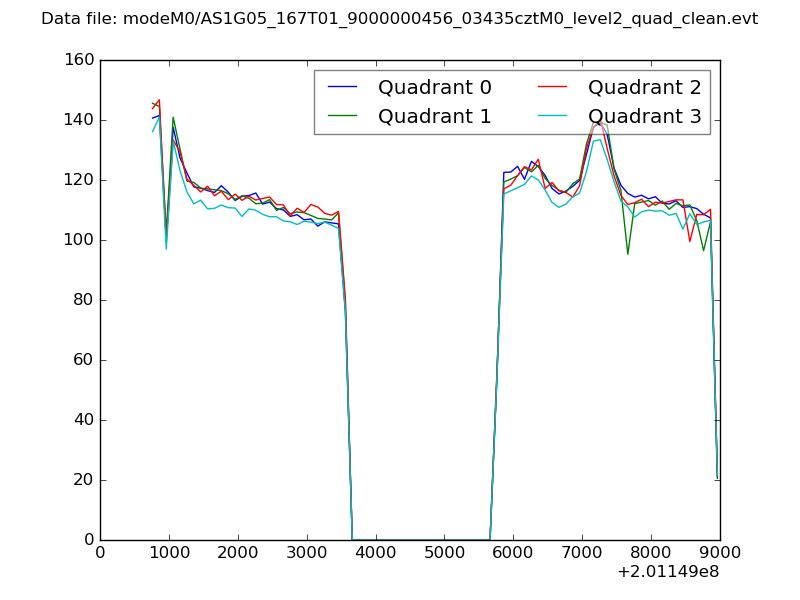 |
|
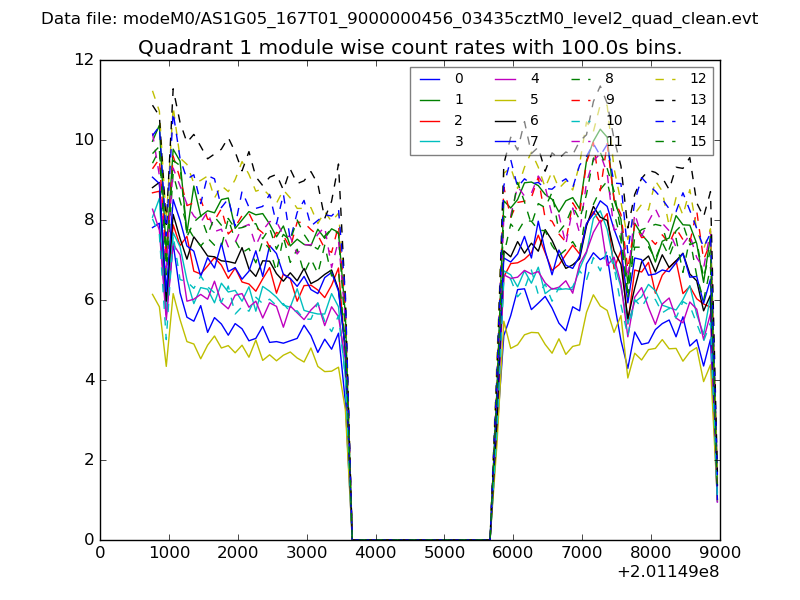
| Module-wise count rates for Quadrant A Data is divided into 100 sec bins |
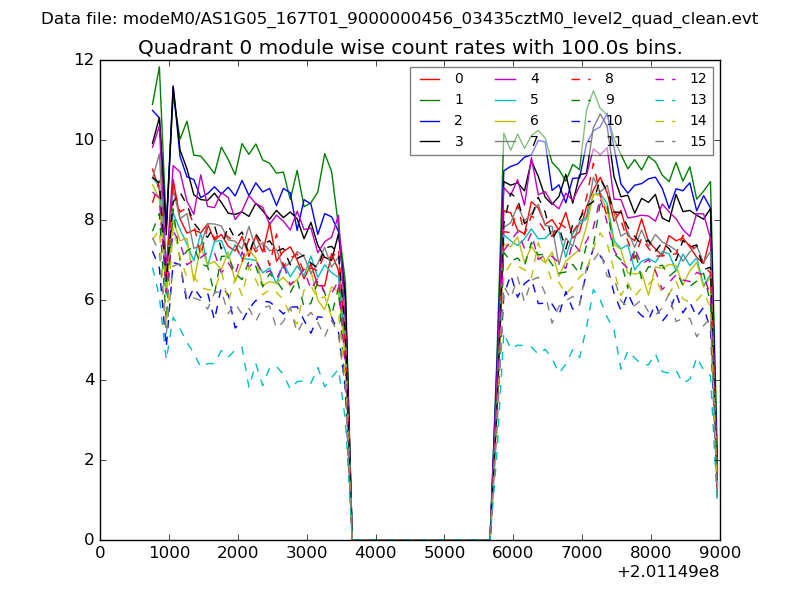 |
 |
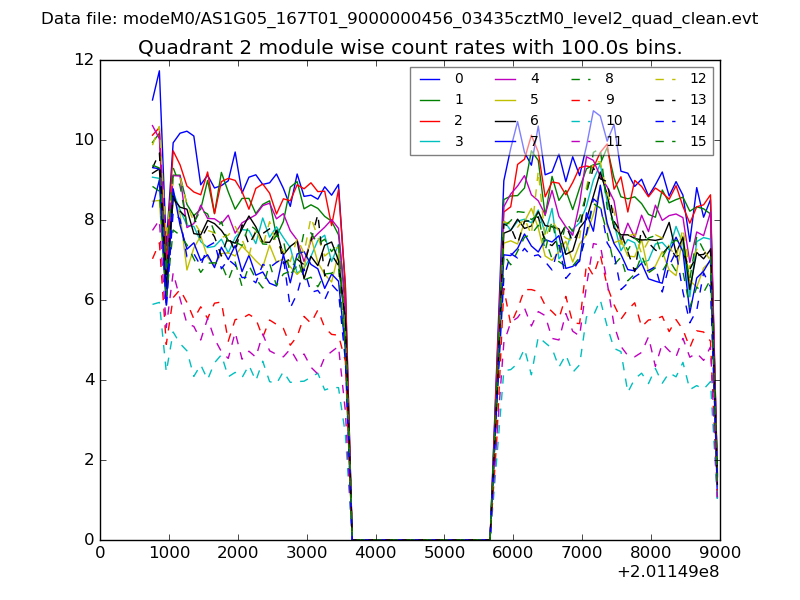
| Module-wise count rates for Quadrant B Data is divided into 100 sec bins |
 |
 |
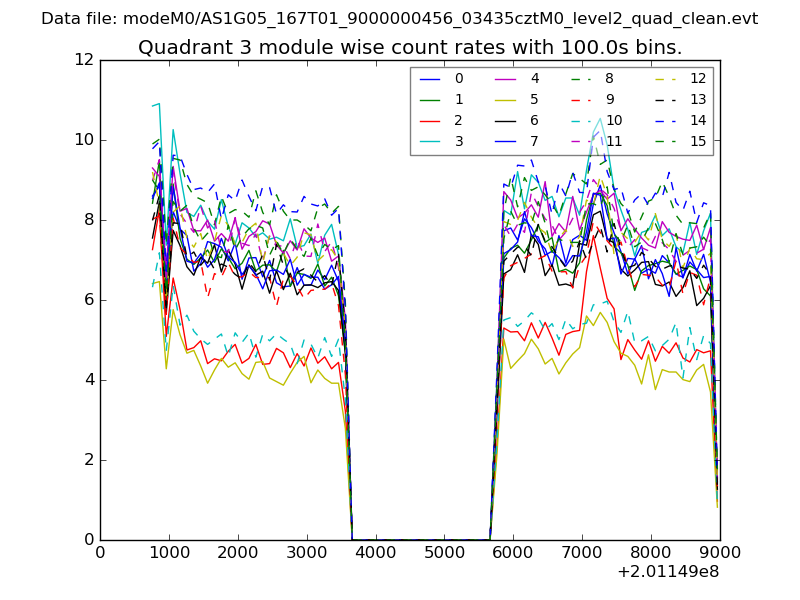
| Module-wise count rates for Quadrant C Data is divided into 100 sec bins |
 |
 |
| Module-wise count rates for Quadrant D Data is divided into 100 sec bins |
 |
 |
| Parameter | Plot |
|---|---|
| CZT HV Monitor | 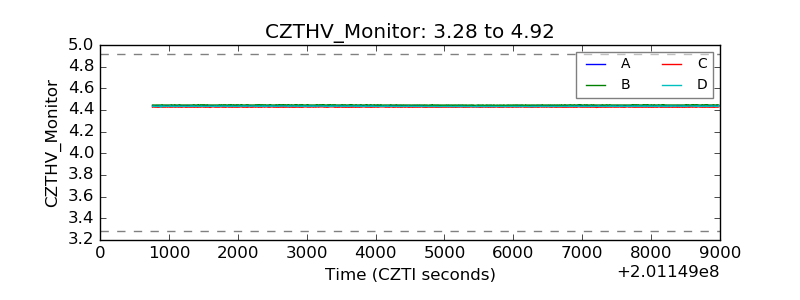 |
| D_VDD | 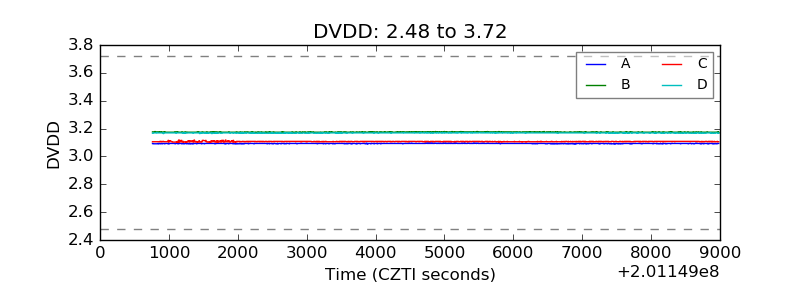 |
| Temperature 1 | 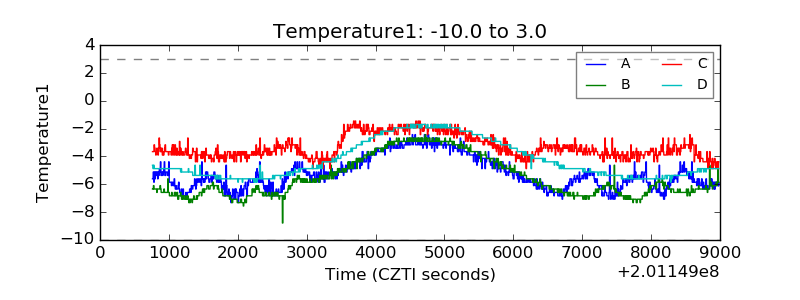 |
| Veto HV Monitor | 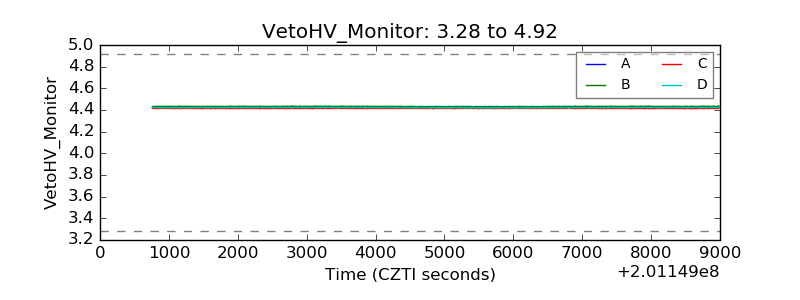 |
| Veto LLD | 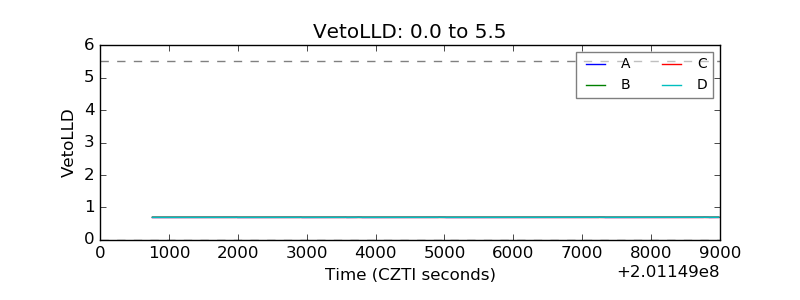 |
| Alpha Counter | 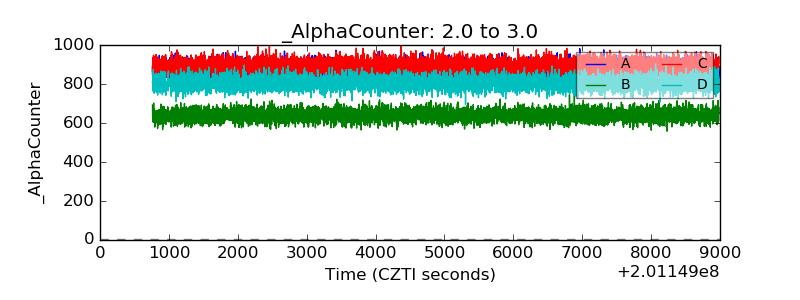 |
| _CPM_Rate | 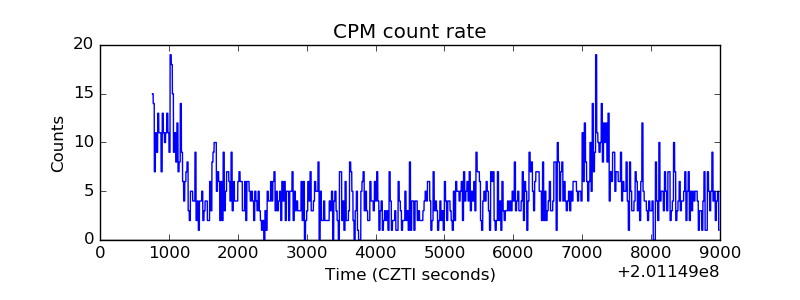 |
| CZT Counter | 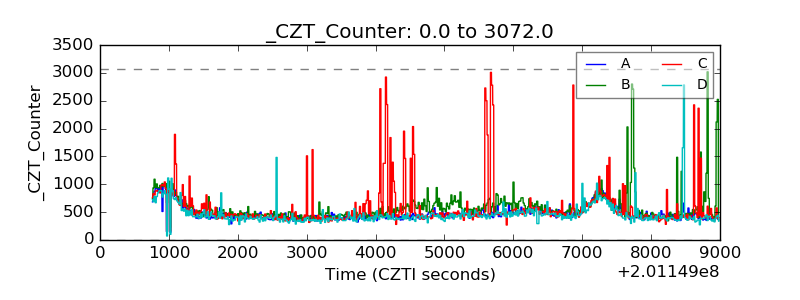 |
| +2.5 Volts monitor |  |
| +5 Volts monitor |  |
| _ROLL_ROT | 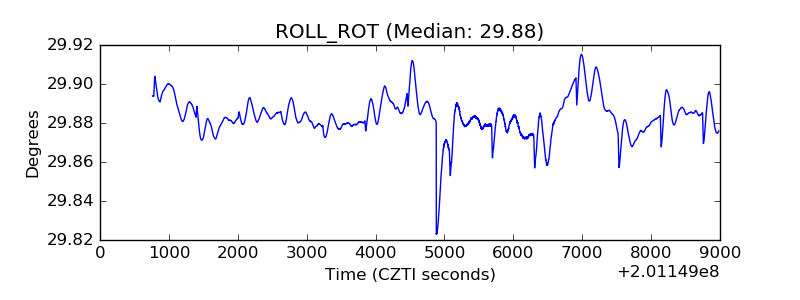 |
| _Roll_DEC | 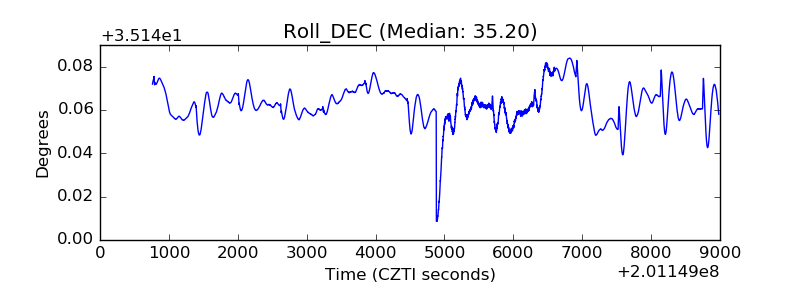 |
| _Roll_RA | 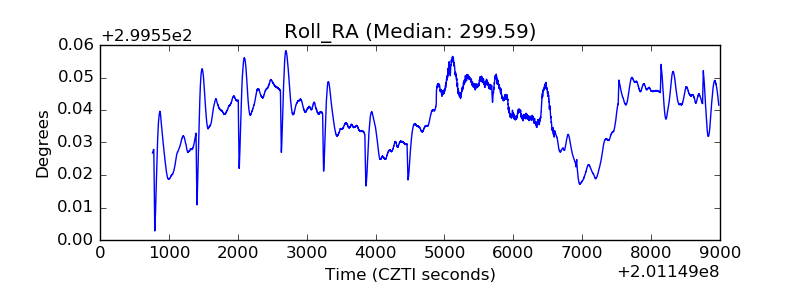 |
| Veto Counter | 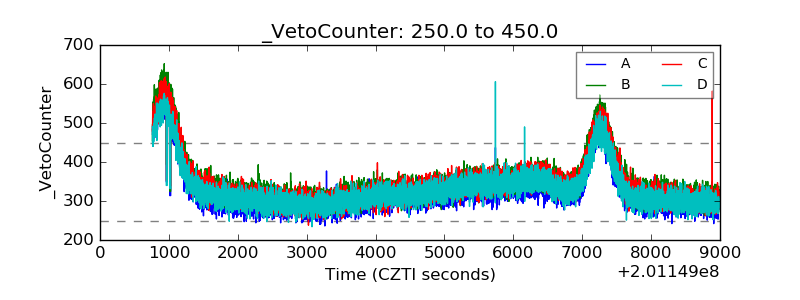 |