| Param | Original file | Final file |
|---|---|---|
| Filename | modeM0/AS1G05_167T01_9000000456_03436cztM0_level2.evt | modeM0/AS1G05_167T01_9000000456_03436cztM0_level2_quad_clean.evt |
| Size (bytes) | 531,898,560 | 100,002,240 |
| Size | 507.3 MB | 95.4 MB |
| Events in quadrant A | 3,599,195 | 628,334 |
| Events in quadrant B | 4,344,128 | 625,958 |
| Events in quadrant C | 4,241,076 | 630,360 |
| Events in quadrant D | 3,401,288 | 608,480 |
| Mode M9 | |||
|---|---|---|---|
| Quadrant | BADHDUFLAG | Total packets | Discarded packets |
| A | 0 | 2 | 0 |
| B | 0 | 2 | 0 |
| C | 0 | 2 | 0 |
| D | 0 | 2 | 0 |
| Mode SS | |||
|---|---|---|---|
| Quadrant | BADHDUFLAG | Total packets | Discarded packets |
| A | 0 | 156 | 0 |
| B | 0 | 156 | 0 |
| C | 0 | 156 | 0 |
| D | 0 | 156 | 0 |
| Mode M0 | |||
|---|---|---|---|
| Quadrant | BADHDUFLAG | Total packets | Discarded packets |
| A | 0 | 16012 | 2 |
| B | 0 | 18022 | 1 |
| C | 0 | 18100 | 1 |
| D | 0 | 16038 | 1 |
| Quadrant | Total seconds | Saturated seconds | Saturation percentage |
|---|---|---|---|
| A | 7695 | 142 | 1.845354% |
| B | 7695 | 287 | 3.729695% |
| C | 7695 | 294 | 3.820663% |
| D | 7695 | 118 | 1.533463% |
Noise dominated data is calculated using 1-second bins in cleaned event files. If a bin has >2000 counts, and if more than 50% of those come from <1% of pixels, then it is considered to be noise-dominated and hence unusable.
| Quadrant | # 1 sec bins | Bins with >0 counts | Bins with >2000 counts | High rate bins dominated by noise | Noise dominated (total time) | Noise dominated (detector-on time) | Marked lightcurve |
|---|---|---|---|---|---|---|---|
| A | 7900 | 7697 | 10 | 10 | 0.13% | 0.13% |  |
| B | 7900 | 7697 | 106 | 106 | 1.34% | 1.38% |  |
| C | 7900 | 7697 | 198 | 198 | 2.51% | 2.57% | 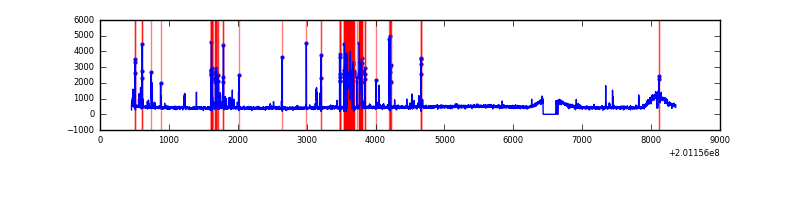 |
| D | 7900 | 7697 | 17 | 17 | 0.22% | 0.22% | 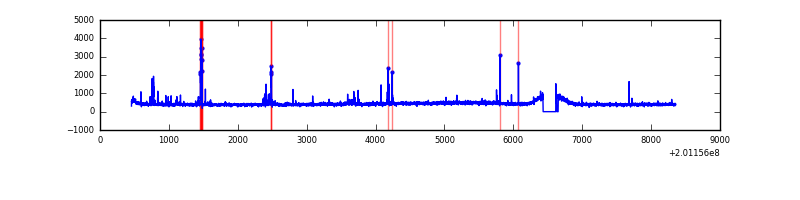 |
Top three noisy pixels from each quadrant. If the there are fewer than three noisy pixels in the level2.evt file, extra rows are filled as -1
| Pixel properties | Quadrant properties | ||||||
|---|---|---|---|---|---|---|---|
| Quadrant | DetID | PixID | Counts | Sigma | Mean | Median | Sigma |
| A | 0 | 118 | 91096 | 494.83 | 886 | 868 | 182.3 |
| A | 8 | 15 | 30537 | 162.71 | 886 | 868 | 182.3 |
| A | 14 | 249 | 23443 | 123.81 | 886 | 868 | 182.3 |
| B | 2 | 249 | 382805 | 2188.45 | 893 | 873 | 174.5 |
| B | 4 | 81 | 324301 | 1853.23 | 893 | 873 | 174.5 |
| B | 15 | 204 | 152282 | 867.57 | 893 | 873 | 174.5 |
| C | 1 | 192 | 725505 | 3674.08 | 847 | 853 | 197.2 |
| C | 14 | 234 | 130357 | 656.6 | 847 | 853 | 197.2 |
| C | 15 | 208 | 38706 | 191.92 | 847 | 853 | 197.2 |
| D | 13 | 223 | 61276 | 293.65 | 854 | 827 | 205.9 |
| D | 2 | 31 | 52343 | 250.26 | 854 | 827 | 205.9 |
| D | 9 | 85 | 27825 | 131.15 | 854 | 827 | 205.9 |
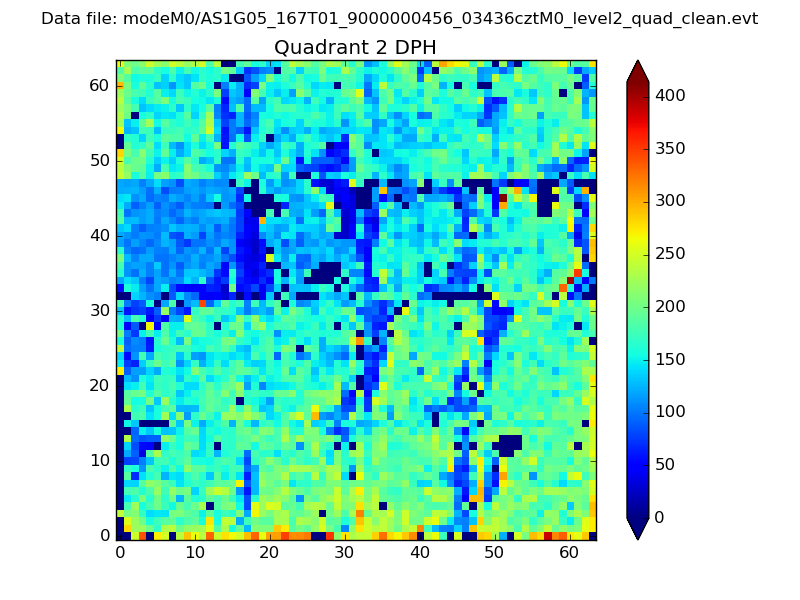
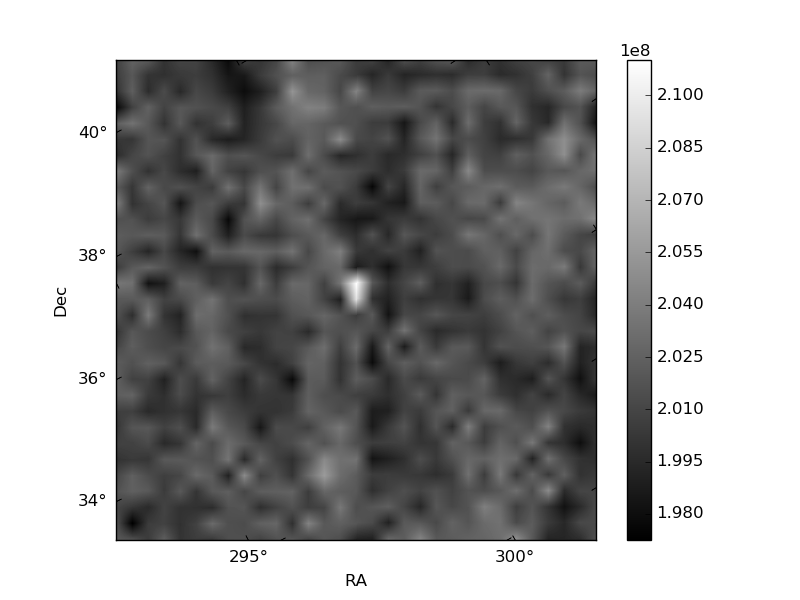
Histogram calculated using DETX and DETY for each event in the final _common_clean file
| Quadrant A | 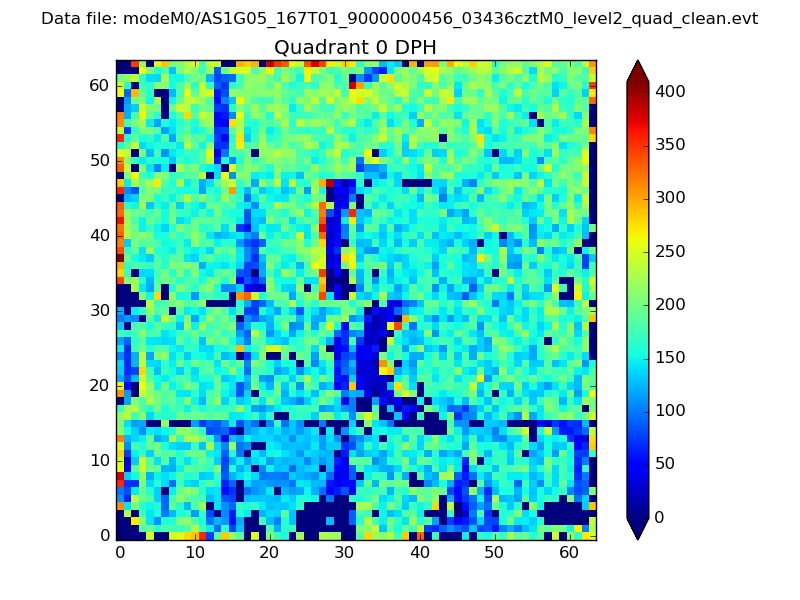 |
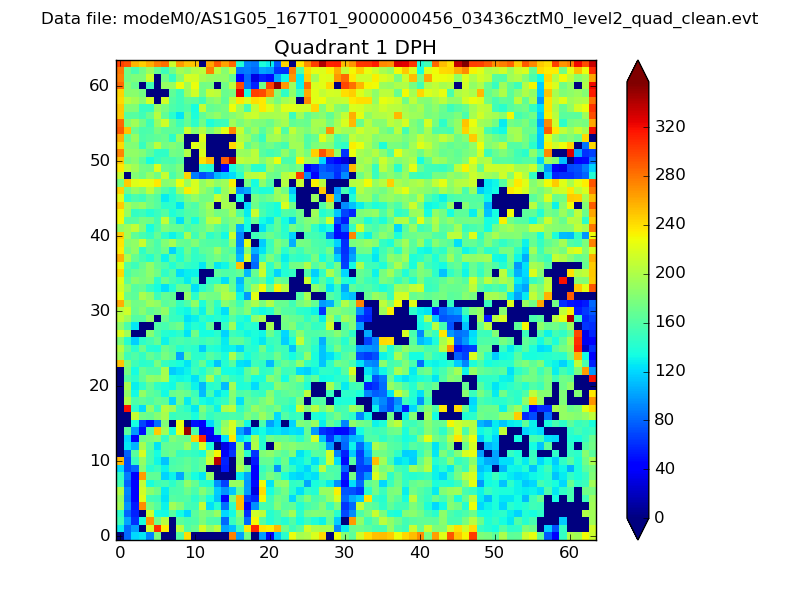 |
Quadrant B |
|---|---|---|---|
| Quadrant D | 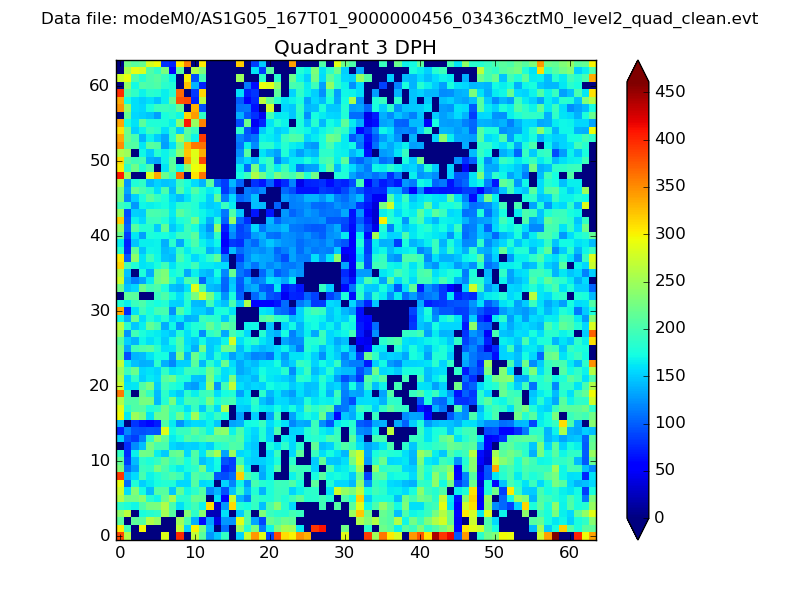 |
 |
Quadrant C |
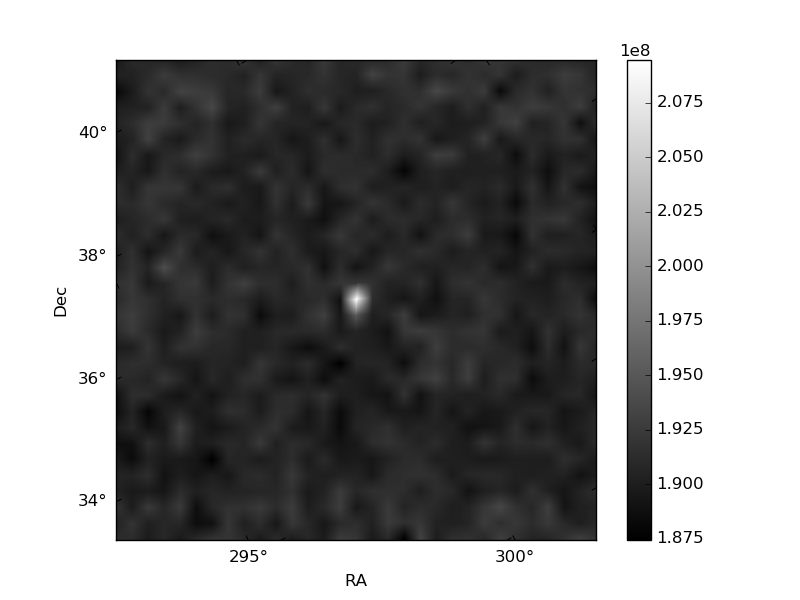
| Plot type | Count rate plots | Images |
|---|---|---|
| Comparison with Poisson distribution Blue bars denote a histogram of data divided into 1 sec bins. Red curve is a Poisson curve with rate = median count rate of data. |
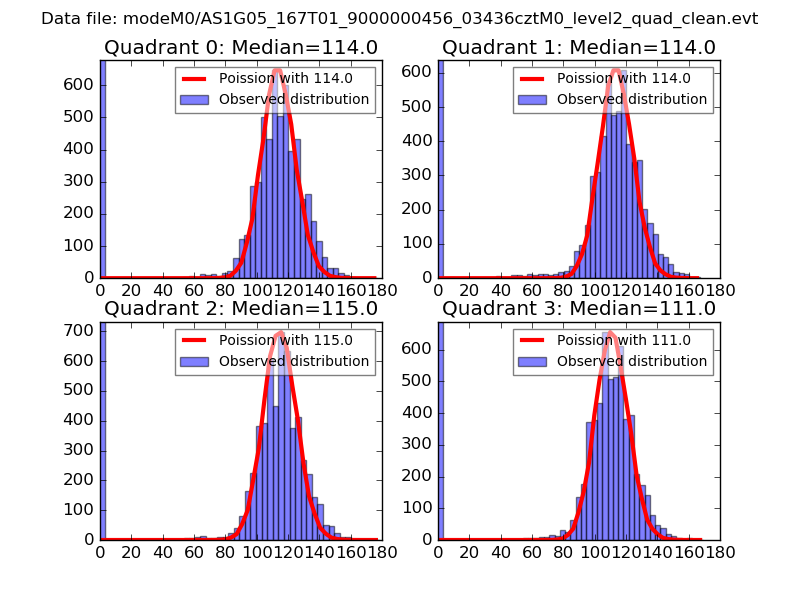 |
 |
| Quadrant-wise count rates Data is divided into 100 sec bins |
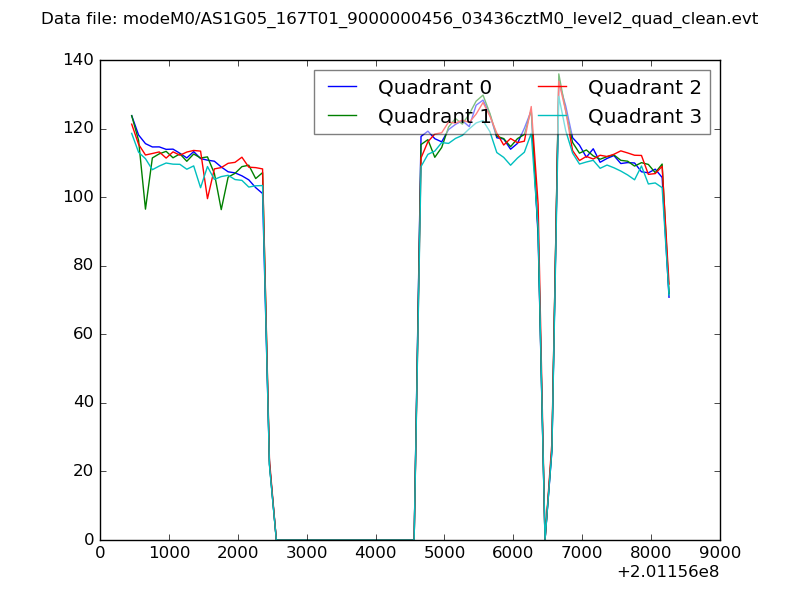 |
|
| Module-wise count rates for Quadrant A Data is divided into 100 sec bins |
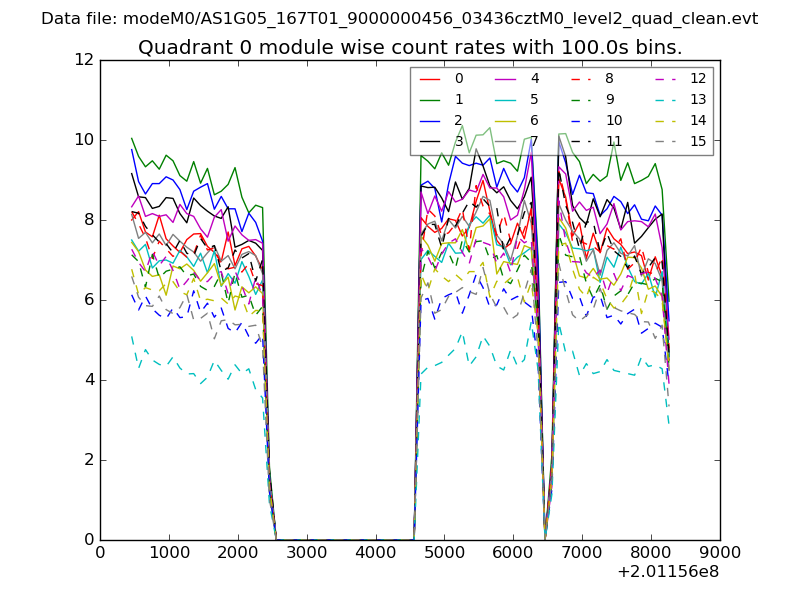 |
 |
| Module-wise count rates for Quadrant B Data is divided into 100 sec bins |
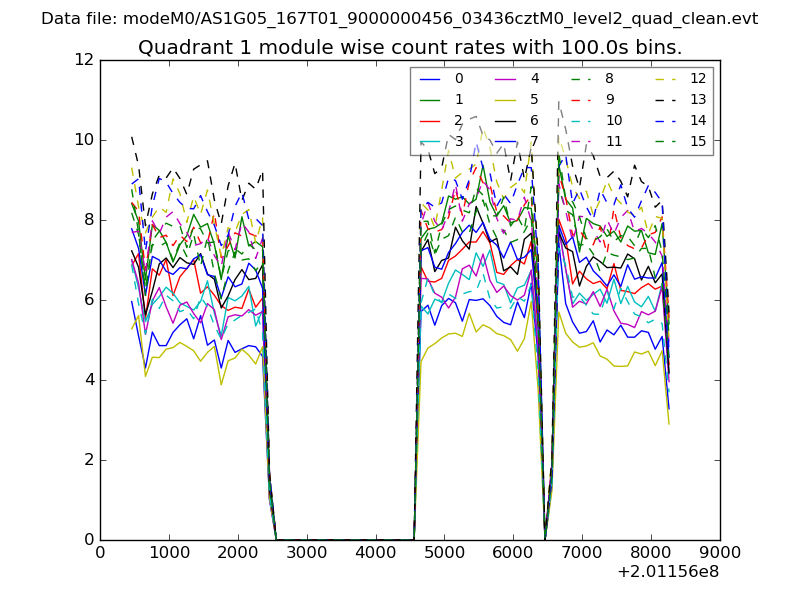 |
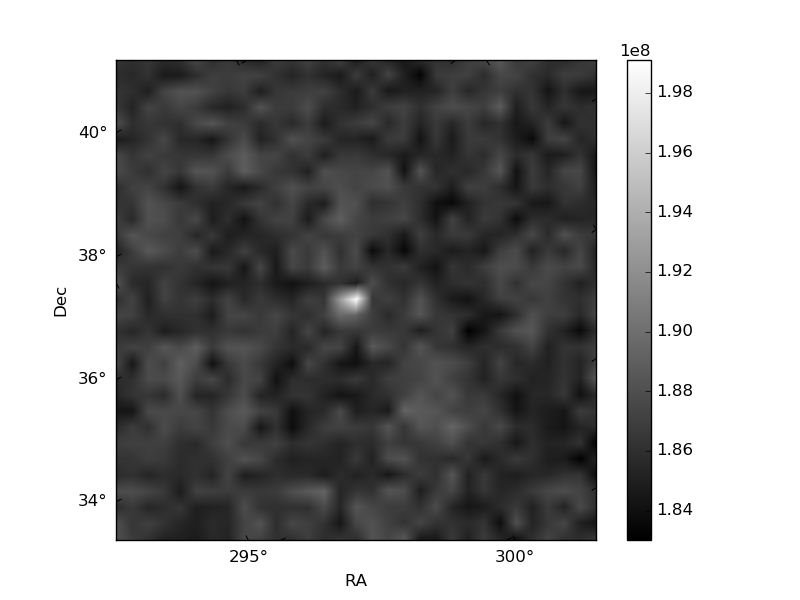 |
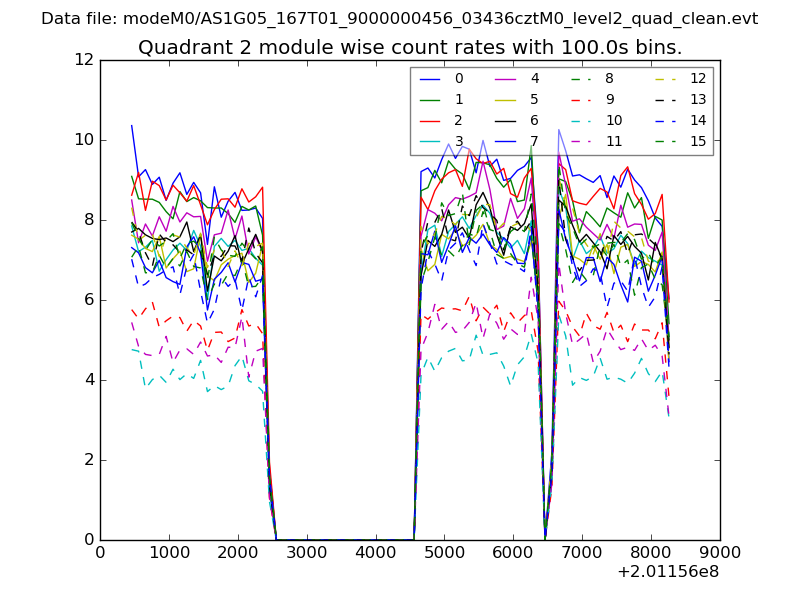
| Module-wise count rates for Quadrant C Data is divided into 100 sec bins |
 |
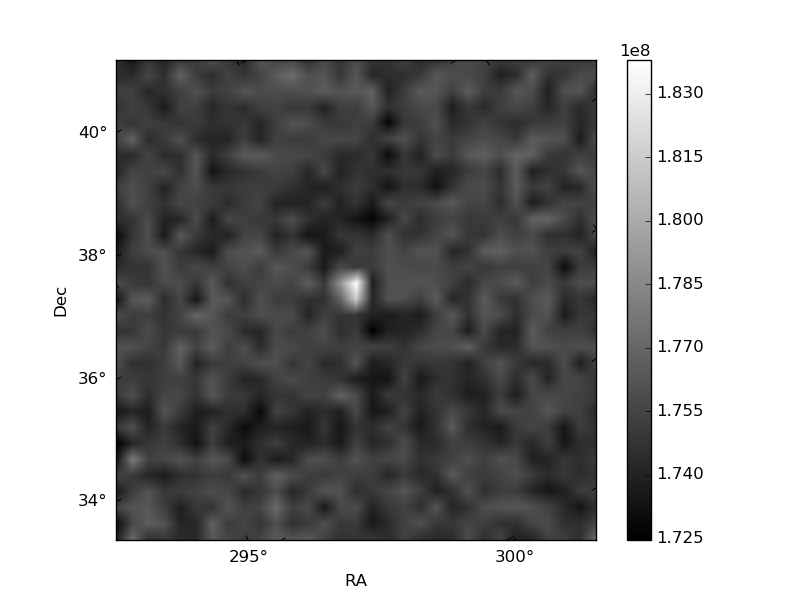 |
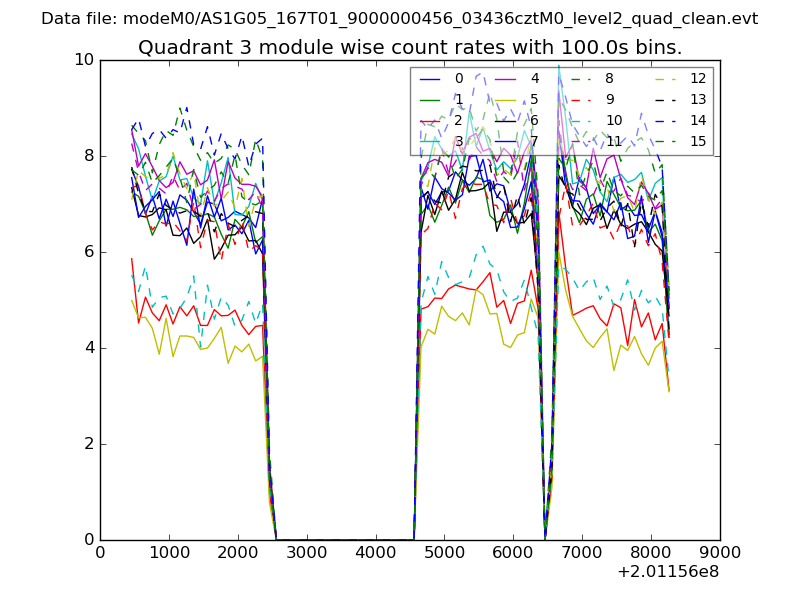
| Module-wise count rates for Quadrant D Data is divided into 100 sec bins |
 |
 |
| Parameter | Plot |
|---|---|
| CZT HV Monitor | 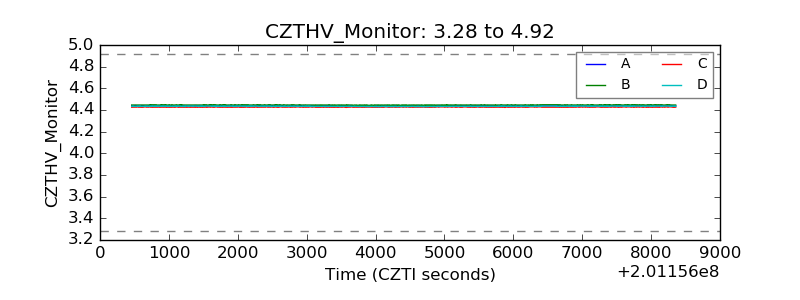 |
| D_VDD | 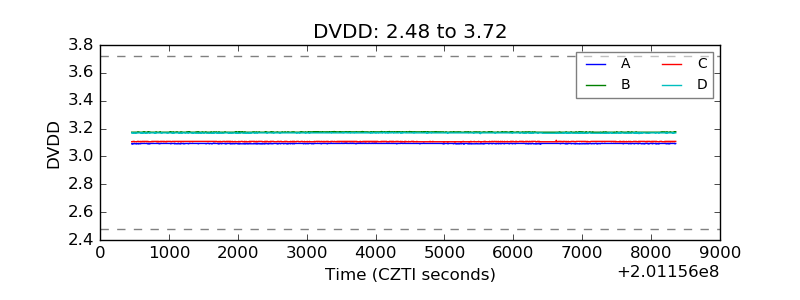 |
| Temperature 1 | 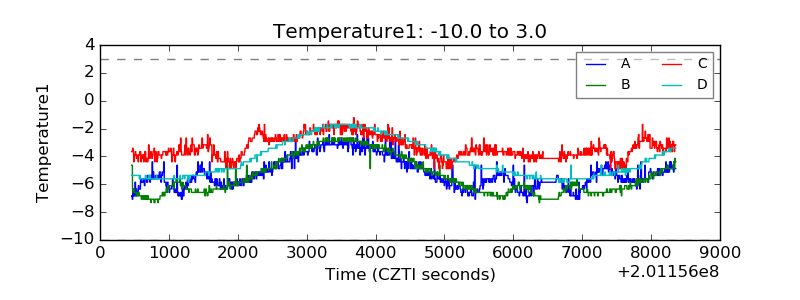 |
| Veto HV Monitor | 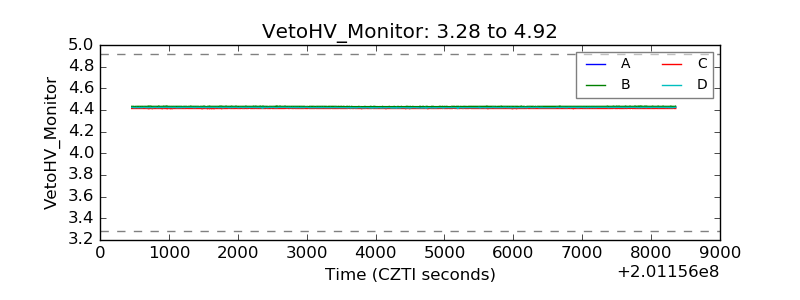 |
| Veto LLD | 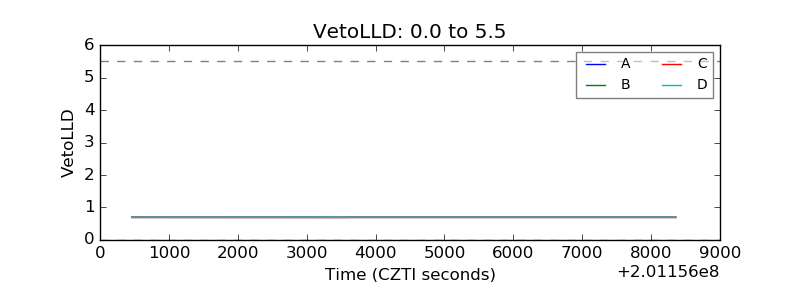 |
| Alpha Counter | 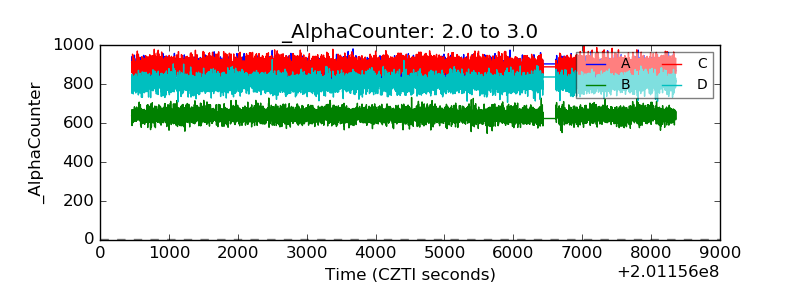 |
| _CPM_Rate | 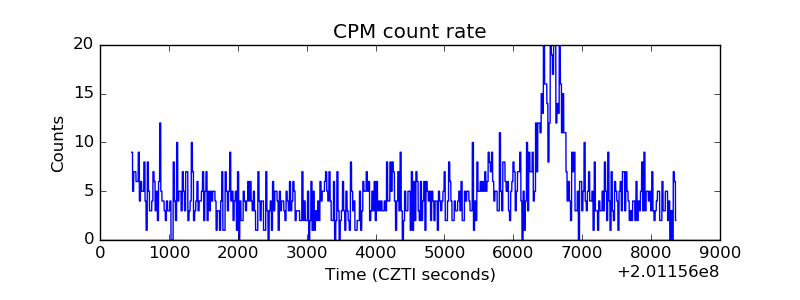 |
| CZT Counter | 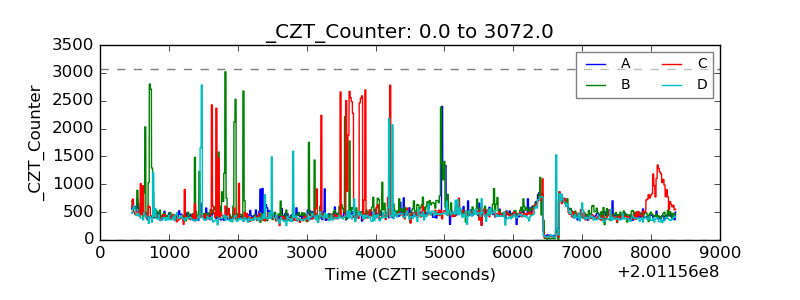 |
| +2.5 Volts monitor |  |
| +5 Volts monitor |  |
| _ROLL_ROT | 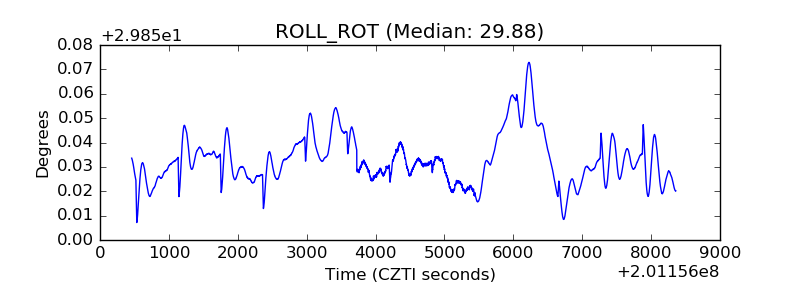 |
| _Roll_DEC | 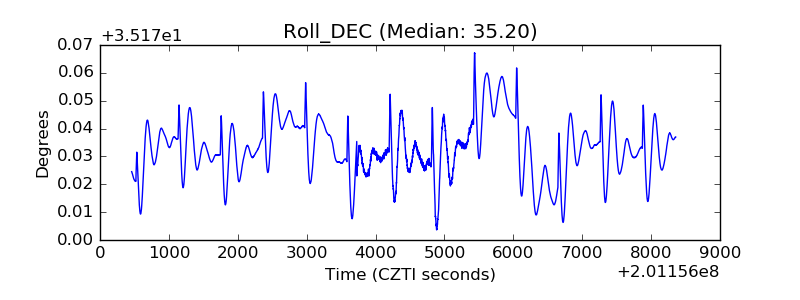 |
| _Roll_RA | 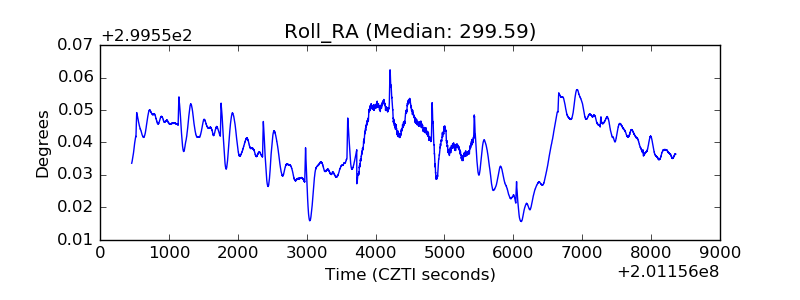 |
| Veto Counter | 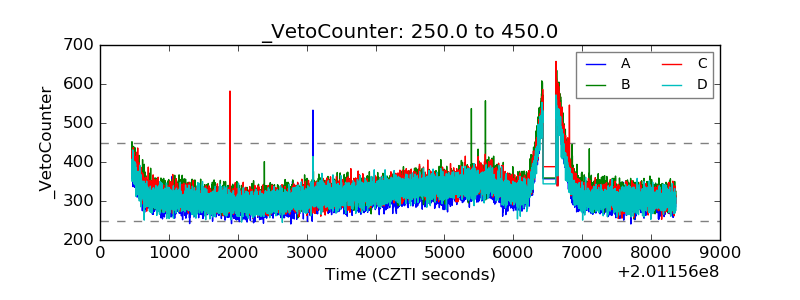 |