| Param | Original file | Final file |
|---|---|---|
| Filename | modeM0/AS1G05_167T01_9000000456_03438cztM0_level2.evt | modeM0/AS1G05_167T01_9000000456_03438cztM0_level2_quad_clean.evt |
| Size (bytes) | 781,263,360 | 130,472,640 |
| Size | 745.1 MB | 124.4 MB |
| Events in quadrant A | 5,825,126 | 783,473 |
| Events in quadrant B | 6,135,661 | 788,805 |
| Events in quadrant C | 5,657,444 | 789,902 |
| Events in quadrant D | 5,230,980 | 761,089 |
| Mode M9 | |||
|---|---|---|---|
| Quadrant | BADHDUFLAG | Total packets | Discarded packets |
| A | 0 | 12 | 0 |
| B | 0 | 12 | 0 |
| C | 0 | 12 | 0 |
| D | 0 | 12 | 0 |
| Mode SS | |||
|---|---|---|---|
| Quadrant | BADHDUFLAG | Total packets | Discarded packets |
| A | 0 | 242 | 0 |
| B | 0 | 242 | 0 |
| C | 0 | 242 | 0 |
| D | 0 | 242 | 0 |
| Mode M0 | |||
|---|---|---|---|
| Quadrant | BADHDUFLAG | Total packets | Discarded packets |
| A | 0 | 25264 | 3 |
| B | 0 | 25453 | 2 |
| C | 0 | 25192 | 2 |
| D | 0 | 24597 | 2 |
| Quadrant | Total seconds | Saturated seconds | Saturation percentage |
|---|---|---|---|
| A | 11976 | 145 | 1.210755% |
| B | 11976 | 112 | 0.935204% |
| C | 11976 | 67 | 0.559452% |
| D | 11976 | 101 | 0.843353% |
Noise dominated data is calculated using 1-second bins in cleaned event files. If a bin has >2000 counts, and if more than 50% of those come from <1% of pixels, then it is considered to be noise-dominated and hence unusable.
| Quadrant | # 1 sec bins | Bins with >0 counts | Bins with >2000 counts | High rate bins dominated by noise | Noise dominated (total time) | Noise dominated (detector-on time) | Marked lightcurve |
|---|---|---|---|---|---|---|---|
| A | 13151 | 11979 | 16 | 16 | 0.12% | 0.13% | 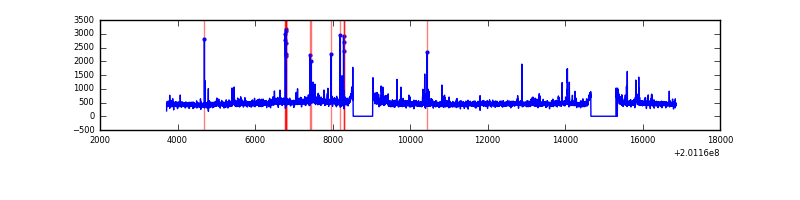 |
| B | 13151 | 11979 | 2 | 2 | 0.02% | 0.02% | 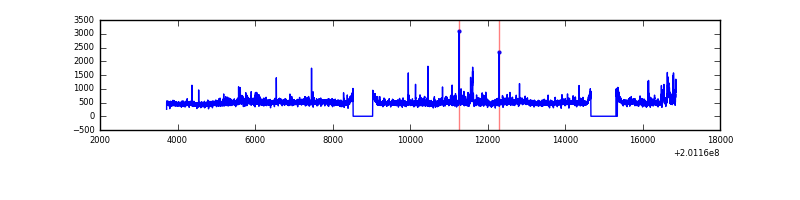 |
| C | 13151 | 11979 | 8 | 8 | 0.06% | 0.07% | 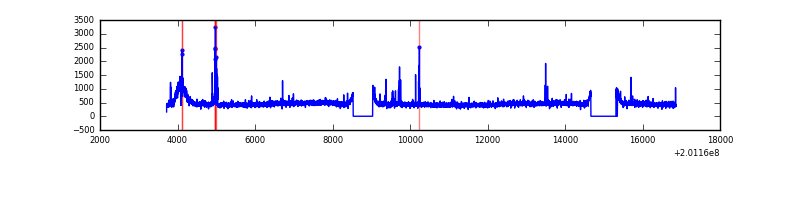 |
| D | 13151 | 11979 | 13 | 13 | 0.10% | 0.11% | 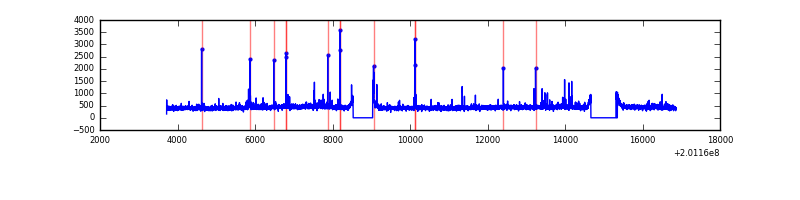 |
Top three noisy pixels from each quadrant. If the there are fewer than three noisy pixels in the level2.evt file, extra rows are filled as -1
| Pixel properties | Quadrant properties | ||||||
|---|---|---|---|---|---|---|---|
| Quadrant | DetID | PixID | Counts | Sigma | Mean | Median | Sigma |
| A | 8 | 15 | 210748 | 735.68 | 1383 | 1355 | 284.6 |
| A | 0 | 118 | 96116 | 332.93 | 1383 | 1355 | 284.6 |
| A | 0 | 50 | 93333 | 323.15 | 1383 | 1355 | 284.6 |
| B | 15 | 204 | 546044 | 2003.96 | 1400 | 1370 | 271.8 |
| B | 14 | 167 | 88229 | 319.57 | 1400 | 1370 | 271.8 |
| B | 0 | 228 | 23993 | 83.23 | 1400 | 1370 | 271.8 |
| C | 1 | 192 | 311192 | 993.32 | 1340 | 1345 | 311.9 |
| C | 15 | 208 | 84893 | 267.84 | 1340 | 1345 | 311.9 |
| C | 12 | 4 | 13113 | 37.73 | 1340 | 1345 | 311.9 |
| D | 14 | 34 | 39608 | 117.69 | 1337 | 1296 | 325.5 |
| D | 9 | 85 | 37471 | 111.12 | 1337 | 1296 | 325.5 |
| D | 13 | 223 | 27402 | 80.19 | 1337 | 1296 | 325.5 |
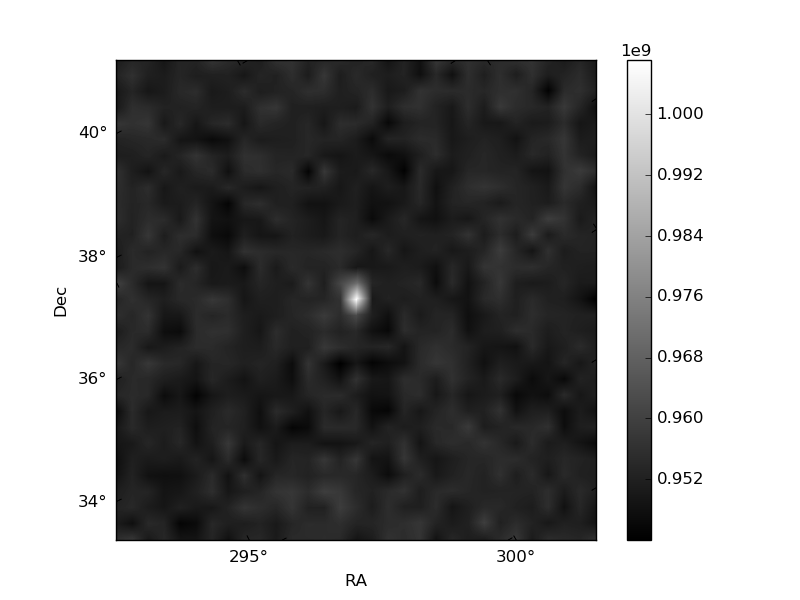
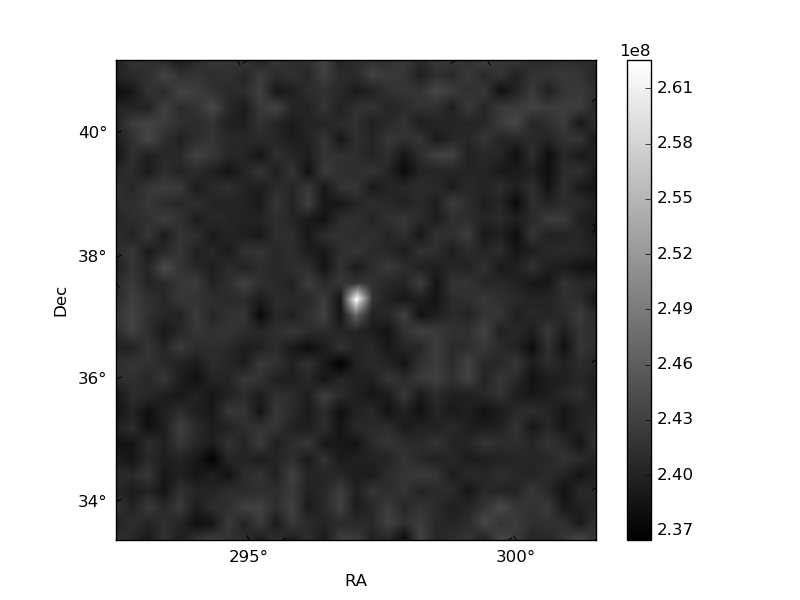
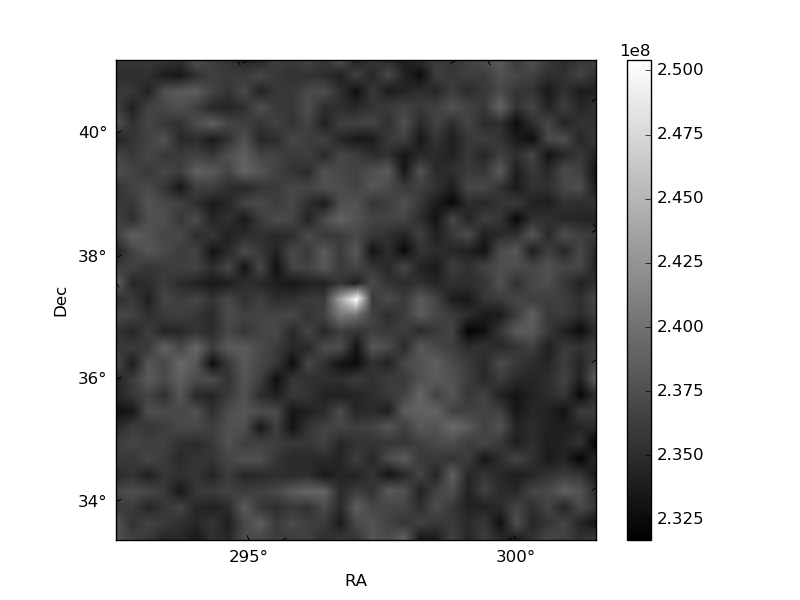
Histogram calculated using DETX and DETY for each event in the final _common_clean file
| Quadrant A | 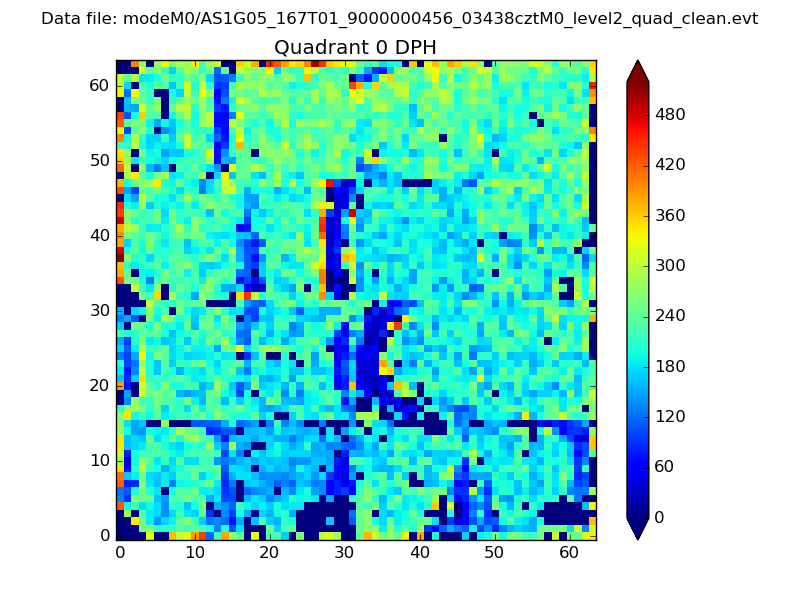 |
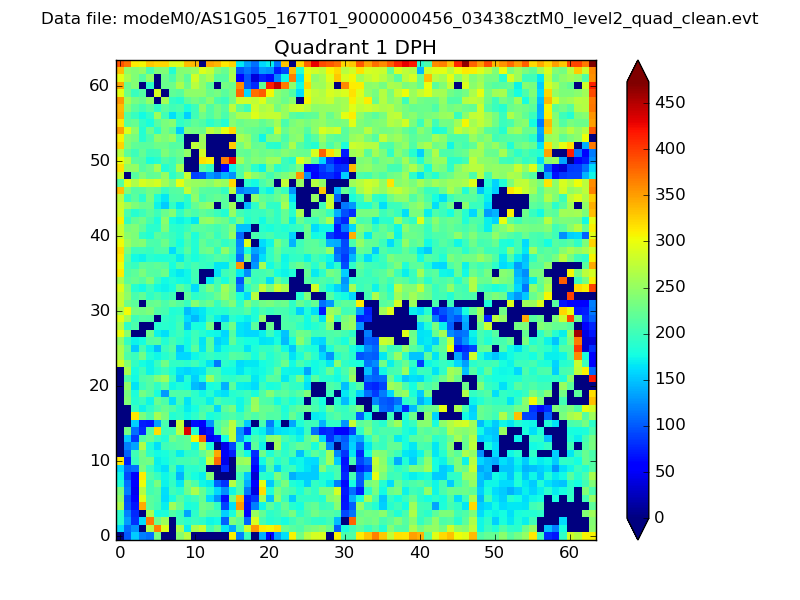 |
Quadrant B |
|---|---|---|---|
| Quadrant D | 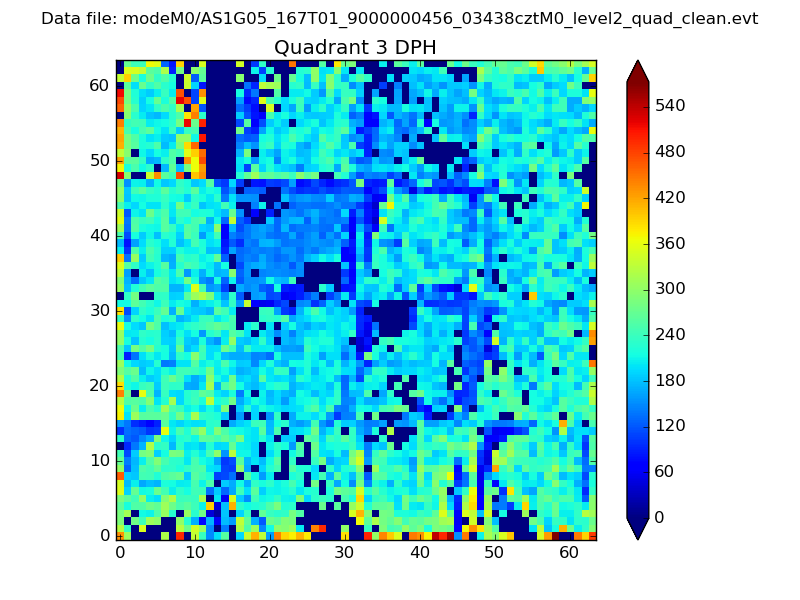 |
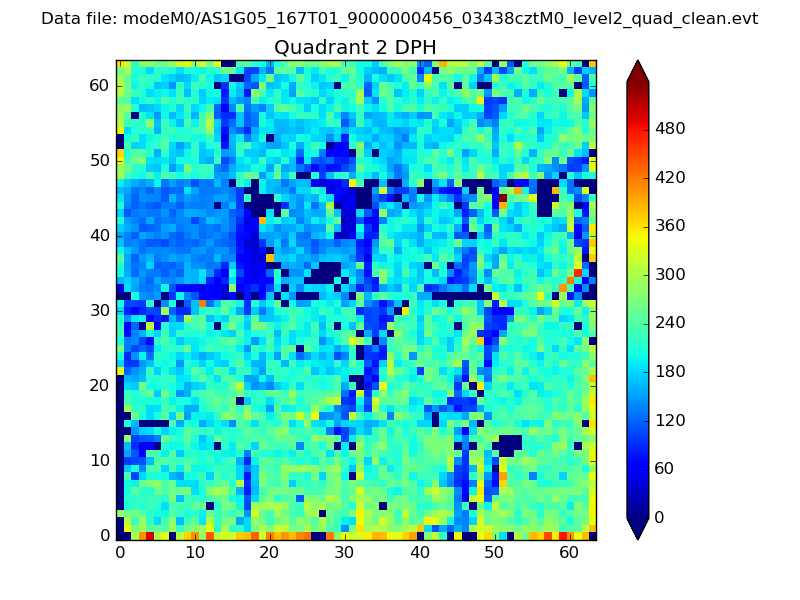 |
Quadrant C |
| Plot type | Count rate plots | Images |
|---|---|---|
| Comparison with Poisson distribution Blue bars denote a histogram of data divided into 1 sec bins. Red curve is a Poisson curve with rate = median count rate of data. |
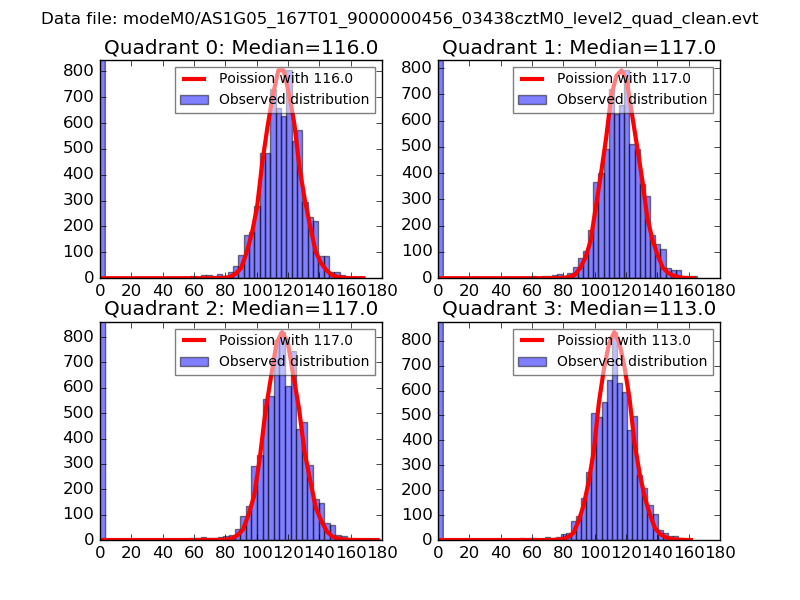 |
 |
| Quadrant-wise count rates Data is divided into 100 sec bins |
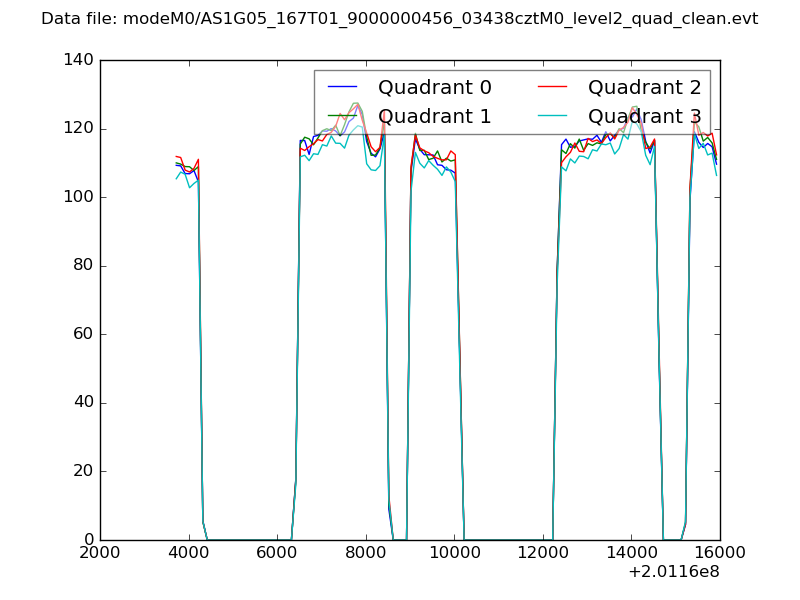 |
|
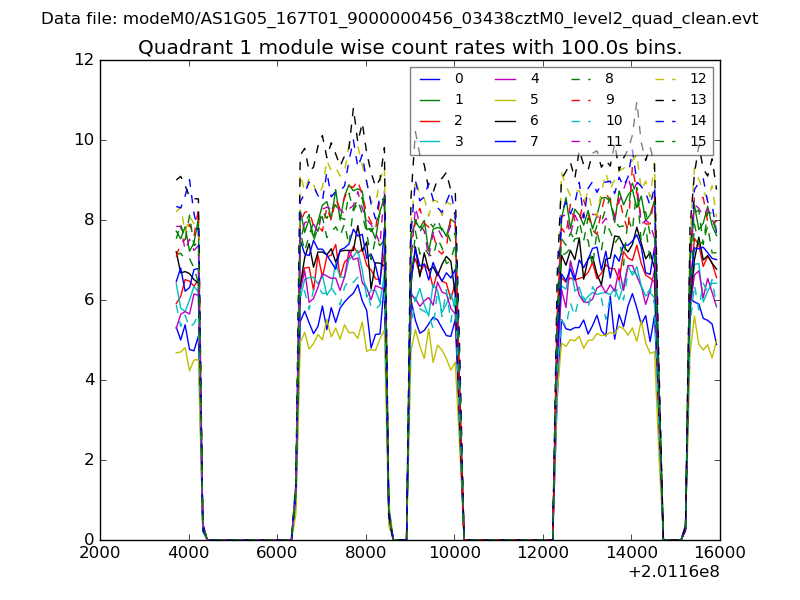
| Module-wise count rates for Quadrant A Data is divided into 100 sec bins |
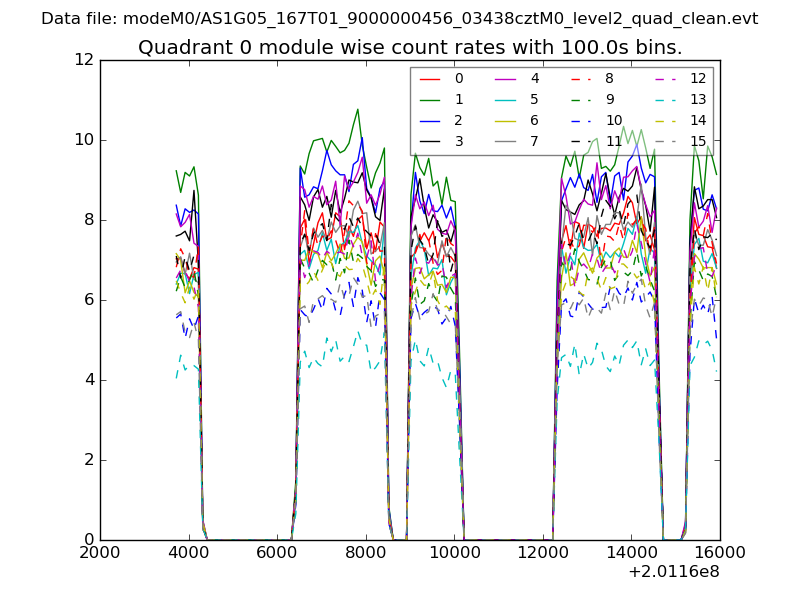 |
 |
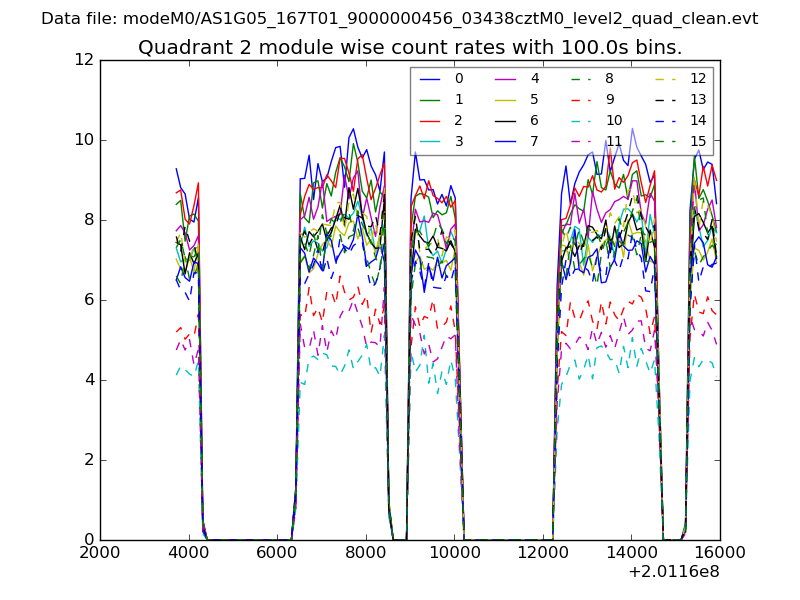
| Module-wise count rates for Quadrant B Data is divided into 100 sec bins |
 |
 |
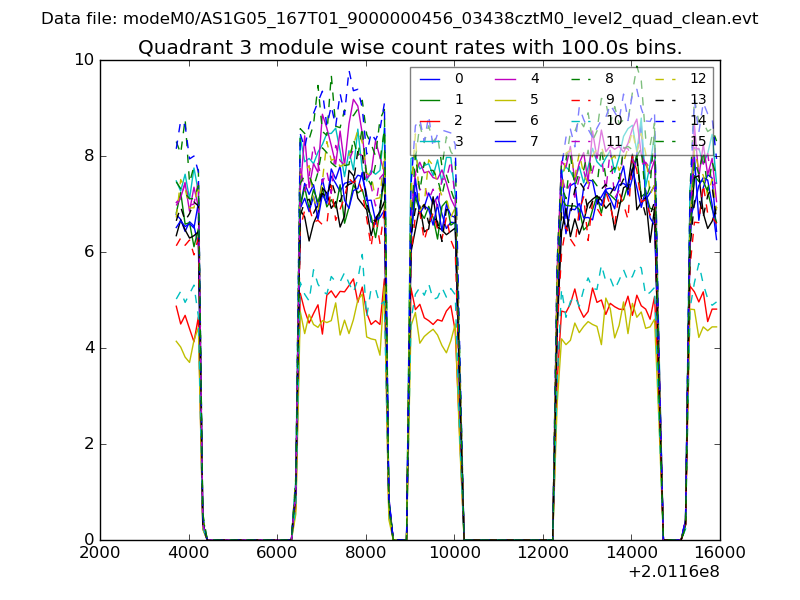
| Module-wise count rates for Quadrant C Data is divided into 100 sec bins |
 |
 |
| Module-wise count rates for Quadrant D Data is divided into 100 sec bins |
 |
 |
| Parameter | Plot |
|---|---|
| CZT HV Monitor | 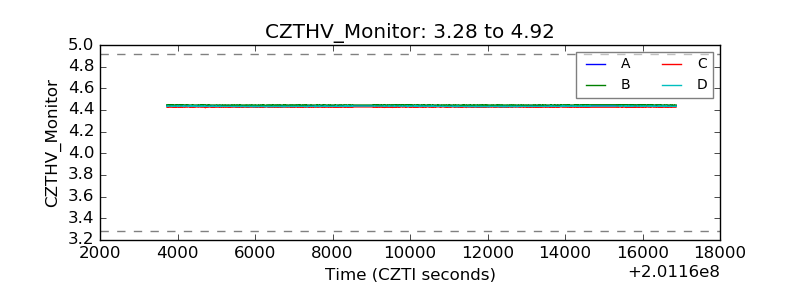 |
| D_VDD | 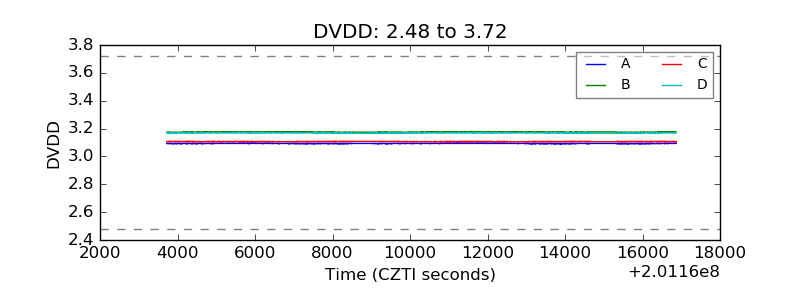 |
| Temperature 1 | 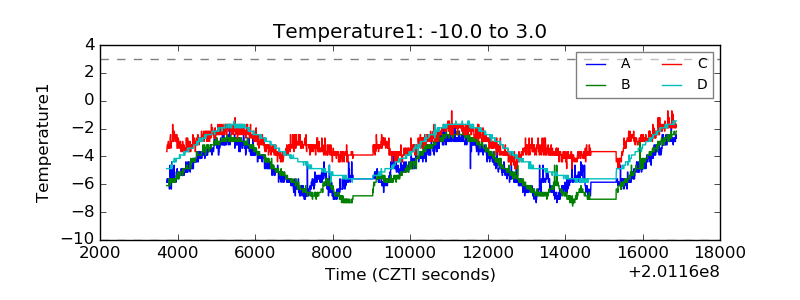 |
| Veto HV Monitor | 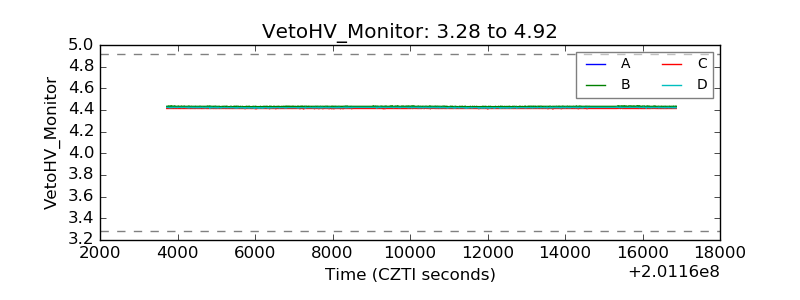 |
| Veto LLD | 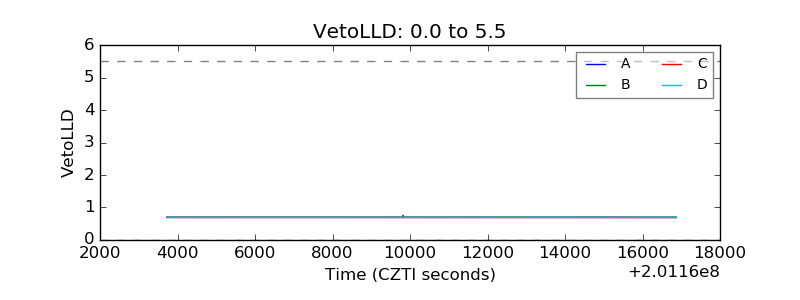 |
| Alpha Counter | 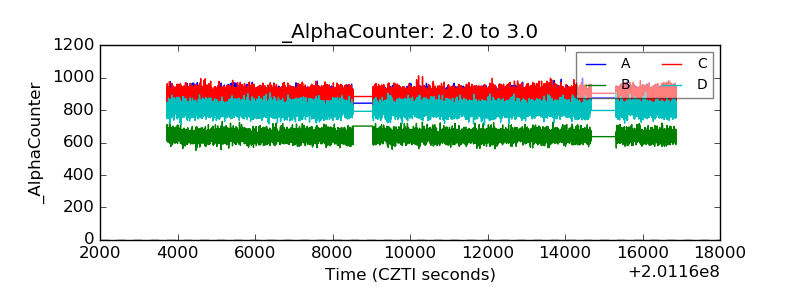 |
| _CPM_Rate | 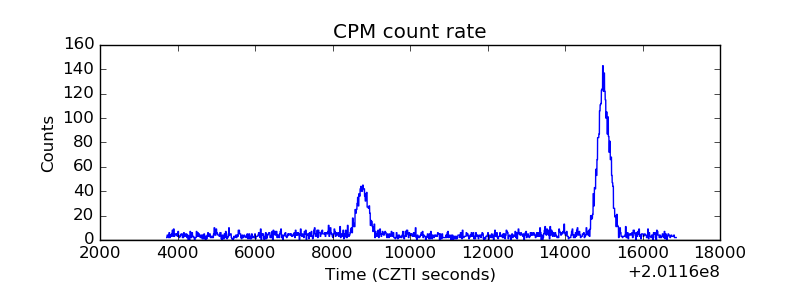 |
| CZT Counter | 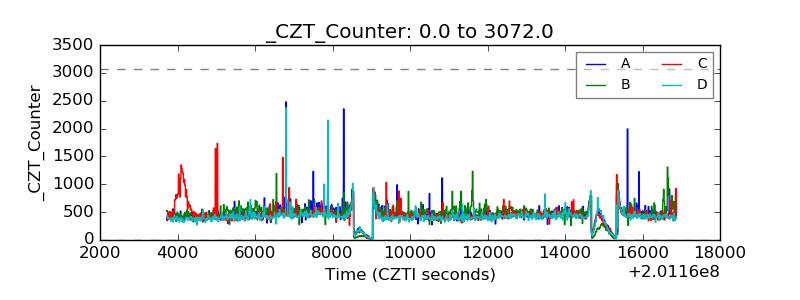 |
| +2.5 Volts monitor |  |
| +5 Volts monitor |  |
| _ROLL_ROT | 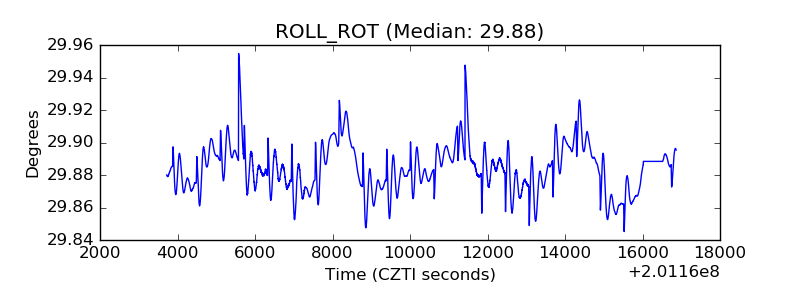 |
| _Roll_DEC | 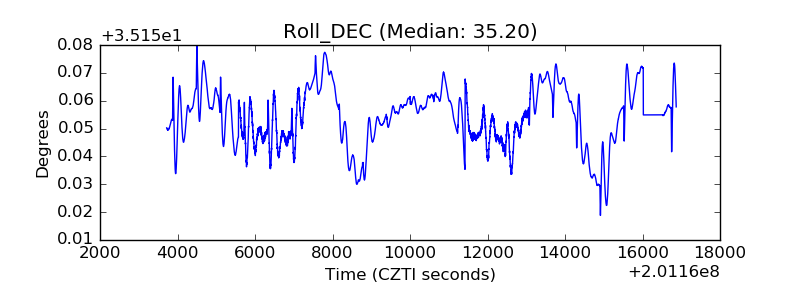 |
| _Roll_RA | 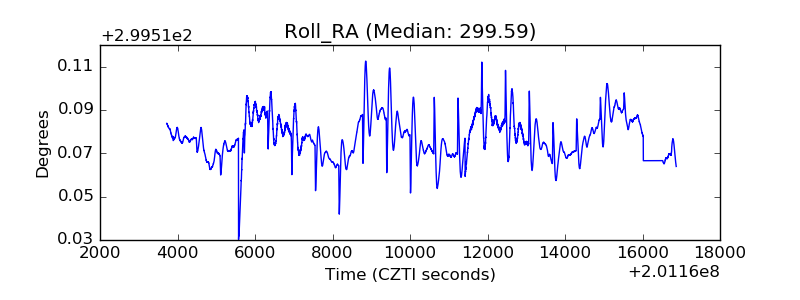 |
| Veto Counter | 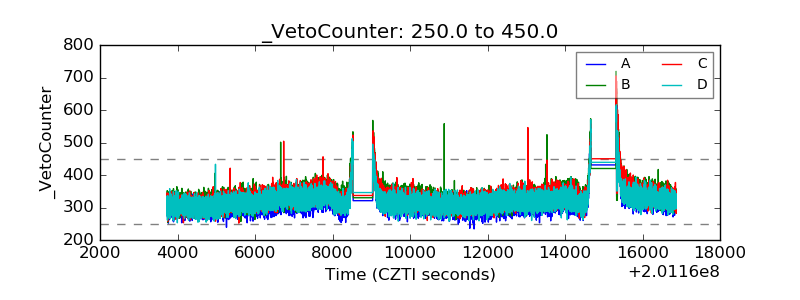 |