| Param | Original file | Final file |
|---|---|---|
| Filename | modeM0/AS1G05_167T01_9000000456_03439cztM0_level2.evt | modeM0/AS1G05_167T01_9000000456_03439cztM0_level2_quad_clean.evt |
| Size (bytes) | 528,719,040 | 70,151,040 |
| Size | 504.2 MB | 66.9 MB |
| Events in quadrant A | 3,318,323 | 414,928 |
| Events in quadrant B | 4,109,179 | 413,519 |
| Events in quadrant C | 4,988,187 | 408,787 |
| Events in quadrant D | 3,122,379 | 400,115 |
| Mode M9 | |||
|---|---|---|---|
| Quadrant | BADHDUFLAG | Total packets | Discarded packets |
| A | 0 | 8 | 0 |
| B | 0 | 8 | 0 |
| C | 0 | 8 | 0 |
| D | 0 | 8 | 0 |
| Mode SS | |||
|---|---|---|---|
| Quadrant | BADHDUFLAG | Total packets | Discarded packets |
| A | 0 | 142 | 0 |
| B | 0 | 142 | 0 |
| C | 0 | 142 | 0 |
| D | 0 | 142 | 0 |
| Mode M0 | |||
|---|---|---|---|
| Quadrant | BADHDUFLAG | Total packets | Discarded packets |
| A | 0 | 14582 | 3 |
| B | 0 | 16545 | 2 |
| C | 0 | 19719 | 2 |
| D | 0 | 14373 | 2 |
| Quadrant | Total seconds | Saturated seconds | Saturation percentage |
|---|---|---|---|
| A | 6983 | 103 | 1.475011% |
| B | 6983 | 157 | 2.248317% |
| C | 6983 | 682 | 9.766576% |
| D | 6983 | 75 | 1.074037% |
Noise dominated data is calculated using 1-second bins in cleaned event files. If a bin has >2000 counts, and if more than 50% of those come from <1% of pixels, then it is considered to be noise-dominated and hence unusable.
| Quadrant | # 1 sec bins | Bins with >0 counts | Bins with >2000 counts | High rate bins dominated by noise | Noise dominated (total time) | Noise dominated (detector-on time) | Marked lightcurve |
|---|---|---|---|---|---|---|---|
| A | 7848 | 6985 | 0 | 0 | 0.00% | 0.00% | 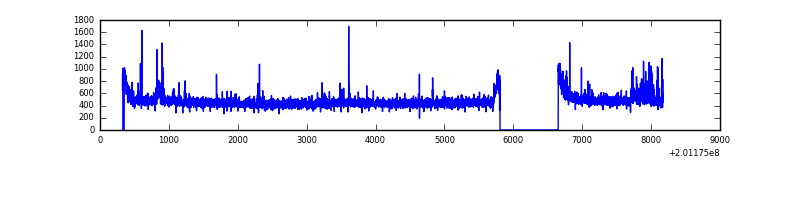 |
| B | 7848 | 6985 | 45 | 45 | 0.57% | 0.64% | 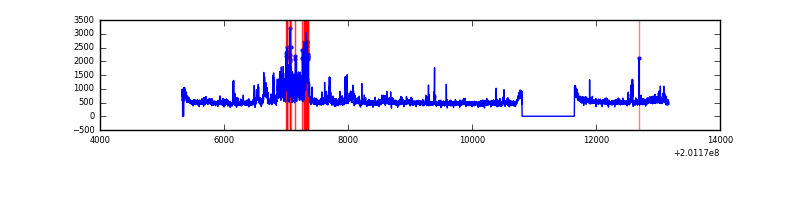 |
| C | 7847 | 6983 | 538 | 538 | 6.86% | 7.70% | 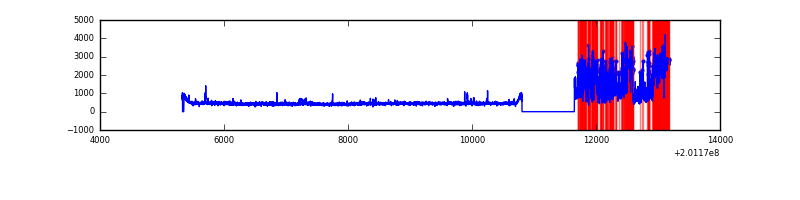 |
| D | 7848 | 6985 | 5 | 5 | 0.06% | 0.07% | 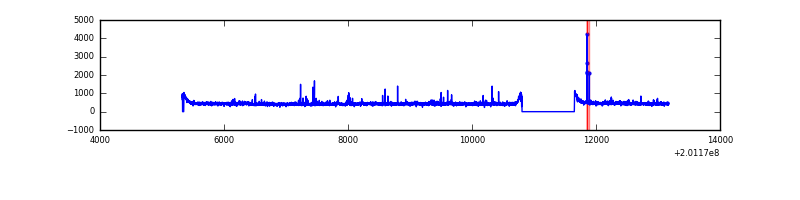 |
Top three noisy pixels from each quadrant. If the there are fewer than three noisy pixels in the level2.evt file, extra rows are filled as -1
| Pixel properties | Quadrant properties | ||||||
|---|---|---|---|---|---|---|---|
| Quadrant | DetID | PixID | Counts | Sigma | Mean | Median | Sigma |
| A | 15 | 249 | 60123 | 343.75 | 829 | 810 | 172.5 |
| A | 0 | 50 | 46562 | 265.16 | 829 | 810 | 172.5 |
| A | 12 | 194 | 8757 | 46.05 | 829 | 810 | 172.5 |
| B | 14 | 167 | 523143 | 3213.43 | 832 | 812 | 162.5 |
| B | 15 | 204 | 312818 | 1919.49 | 832 | 812 | 162.5 |
| B | 0 | 228 | 12093 | 69.4 | 832 | 812 | 162.5 |
| C | 1 | 192 | 1953799 | 10765.11 | 772 | 776 | 181.4 |
| C | 7 | 220 | 10592 | 54.1 | 772 | 776 | 181.4 |
| C | 13 | 61 | 6431 | 31.17 | 772 | 776 | 181.4 |
| D | 13 | 223 | 19778 | 97.86 | 798 | 773 | 194.2 |
| D | 5 | 233 | 18930 | 93.49 | 798 | 773 | 194.2 |
| D | 9 | 85 | 18121 | 89.33 | 798 | 773 | 194.2 |
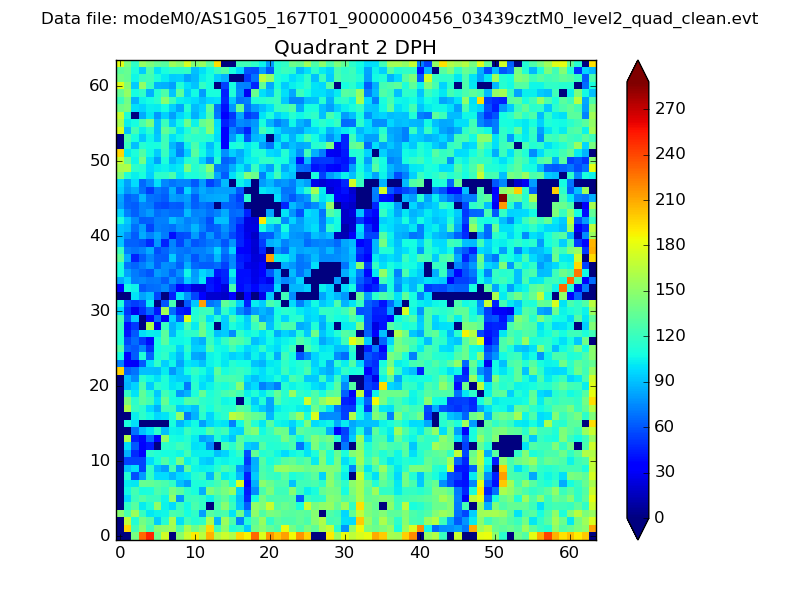
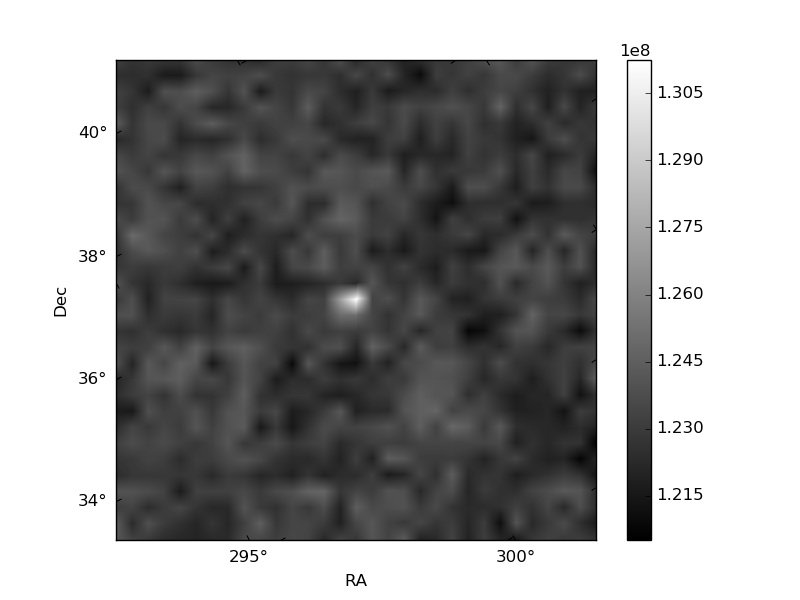
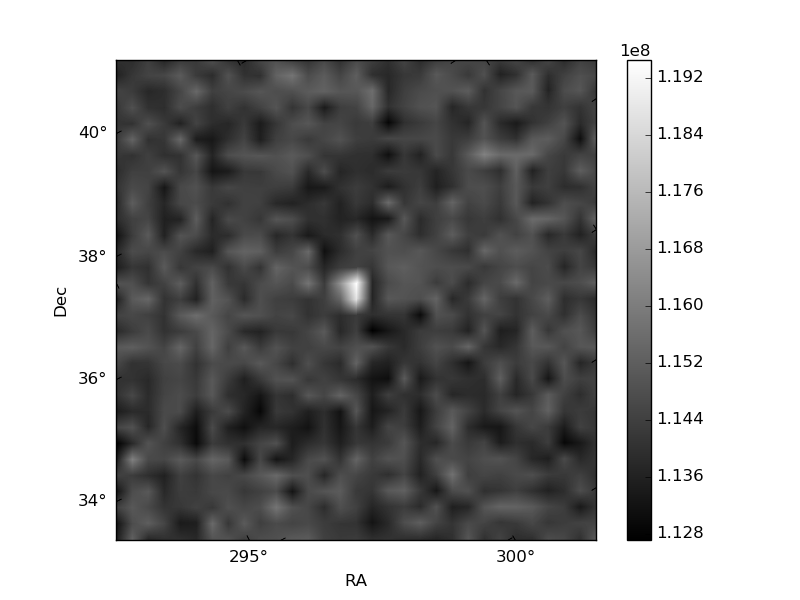
Histogram calculated using DETX and DETY for each event in the final _common_clean file
| Quadrant A | 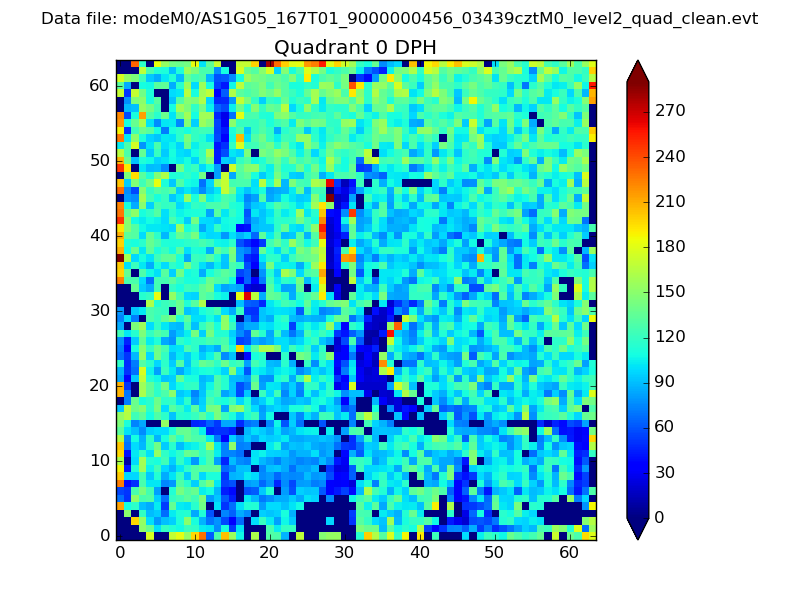 |
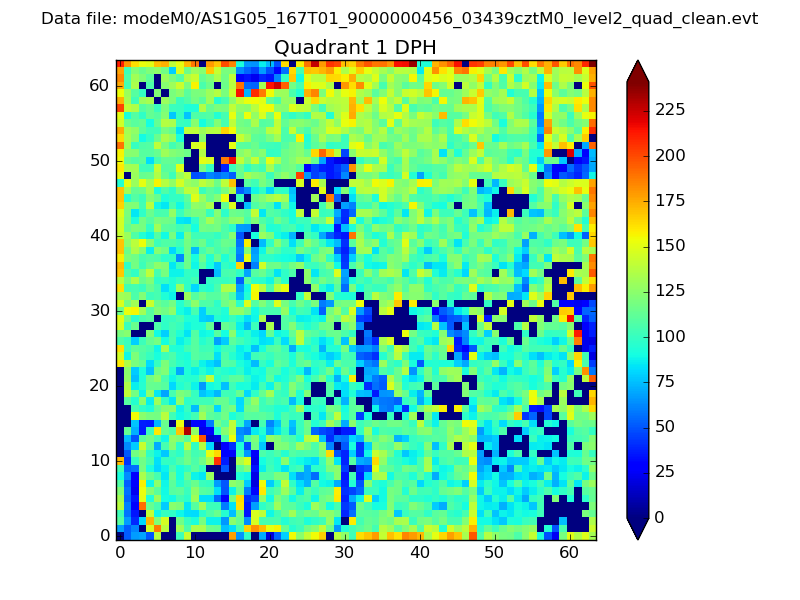 |
Quadrant B |
|---|---|---|---|
| Quadrant D | 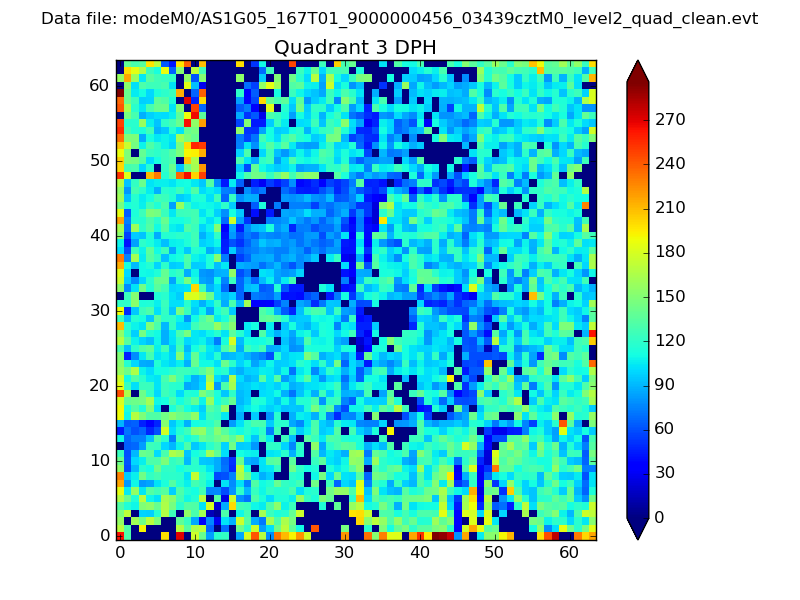 |
 |
Quadrant C |
| Plot type | Count rate plots | Images |
|---|---|---|
| Comparison with Poisson distribution Blue bars denote a histogram of data divided into 1 sec bins. Red curve is a Poisson curve with rate = median count rate of data. |
 |
 |
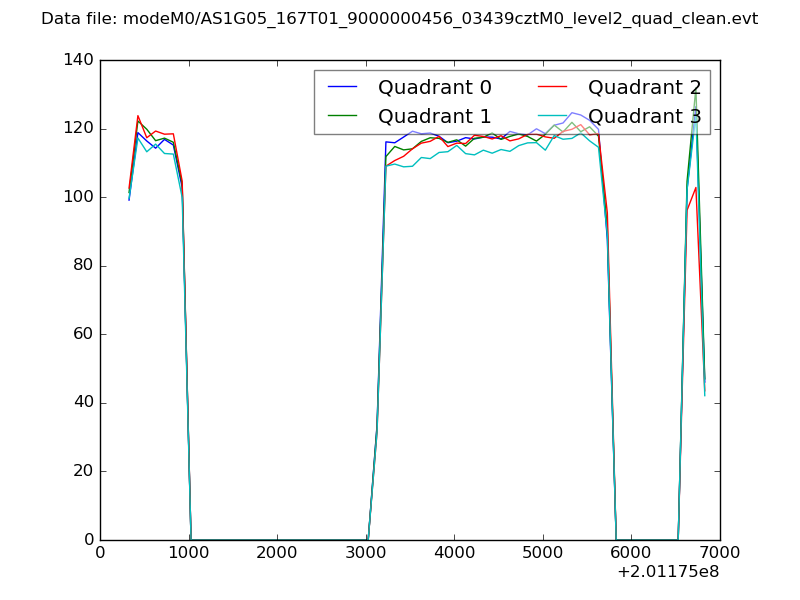
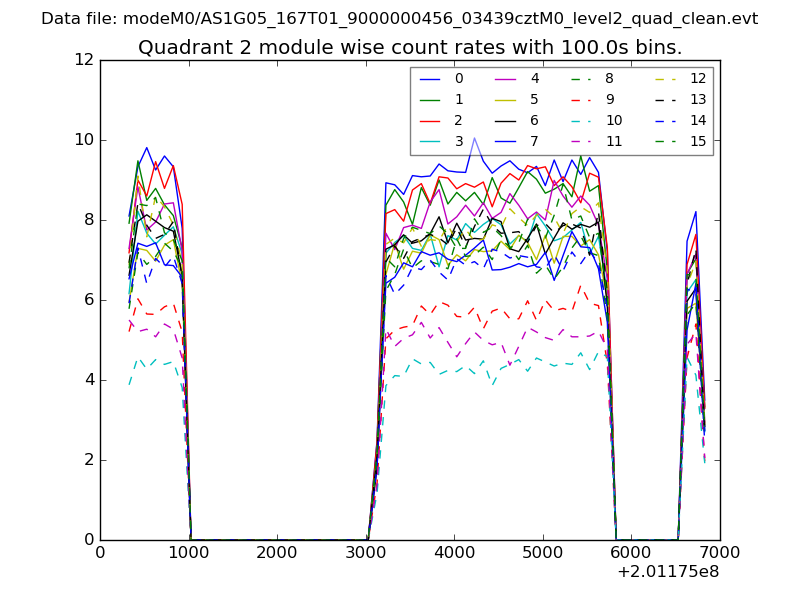
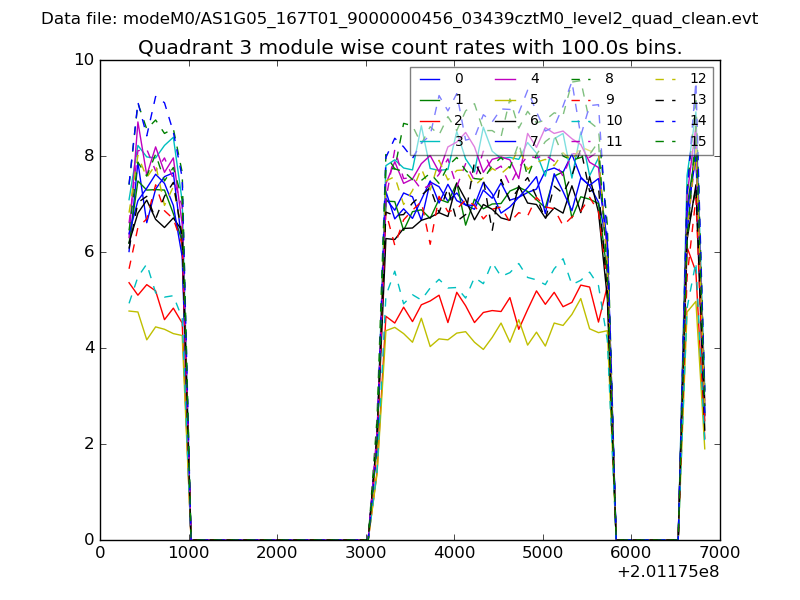
| Quadrant-wise count rates Data is divided into 100 sec bins |
 |
|
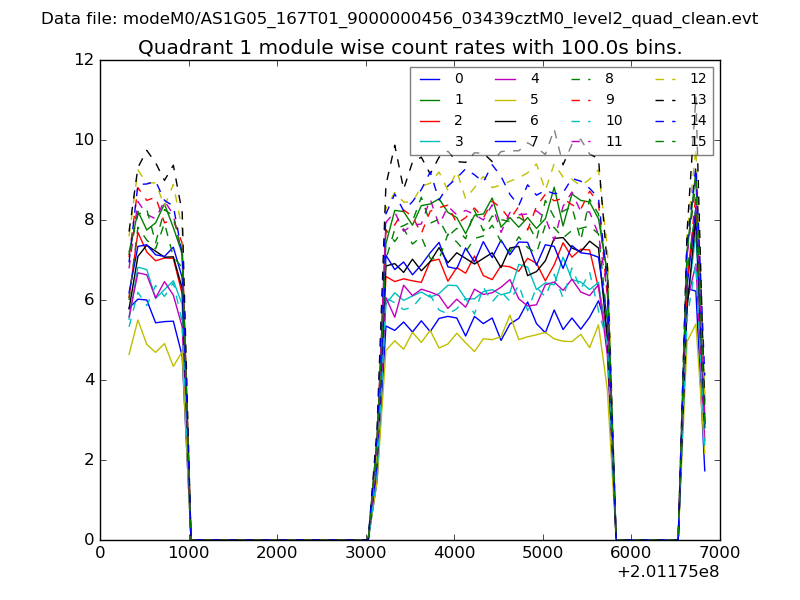
| Module-wise count rates for Quadrant A Data is divided into 100 sec bins |
 |
 |
| Module-wise count rates for Quadrant B Data is divided into 100 sec bins |
 |
 |
| Module-wise count rates for Quadrant C Data is divided into 100 sec bins |
 |
 |
| Module-wise count rates for Quadrant D Data is divided into 100 sec bins |
 |
 |
| Parameter | Plot |
|---|---|
| CZT HV Monitor | 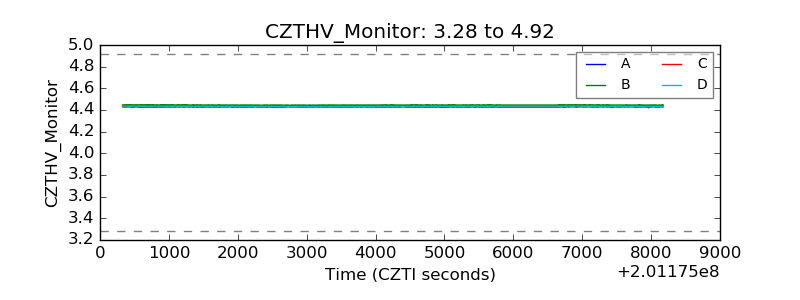 |
| D_VDD | 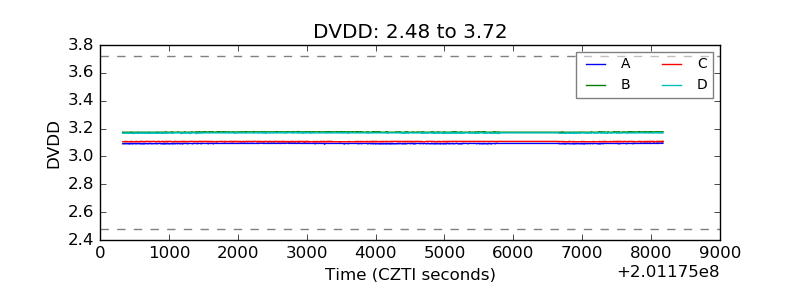 |
| Temperature 1 | 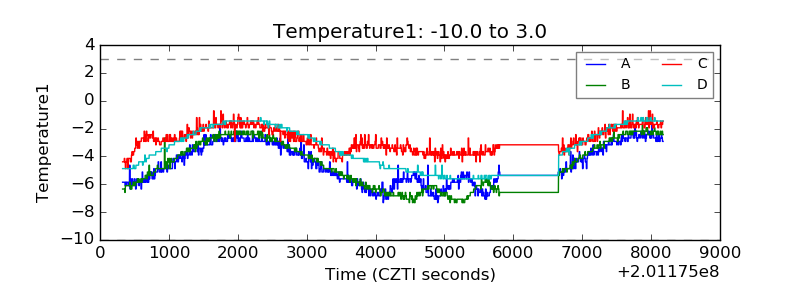 |
| Veto HV Monitor | 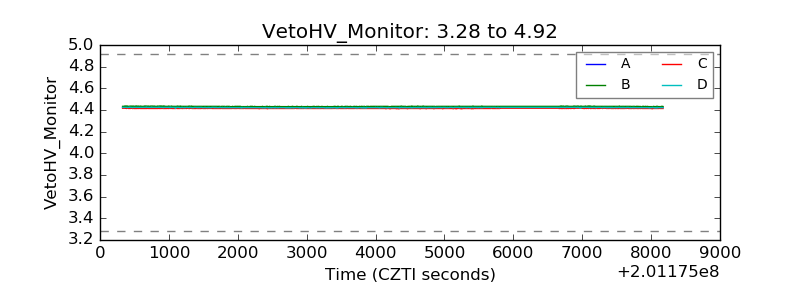 |
| Veto LLD | 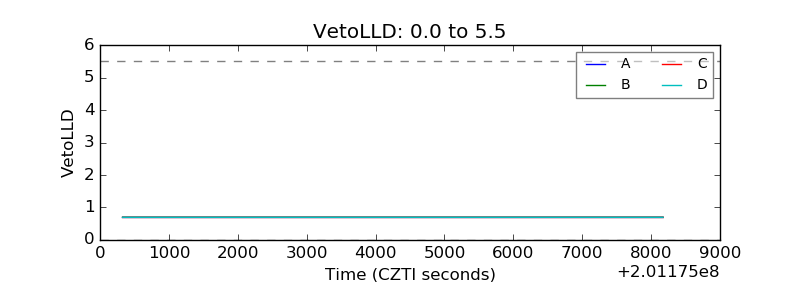 |
| Alpha Counter | 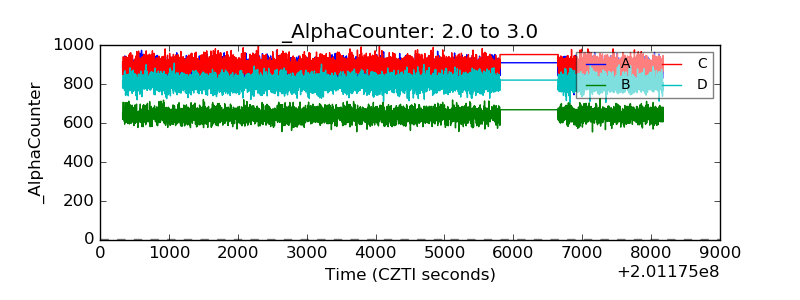 |
| _CPM_Rate | 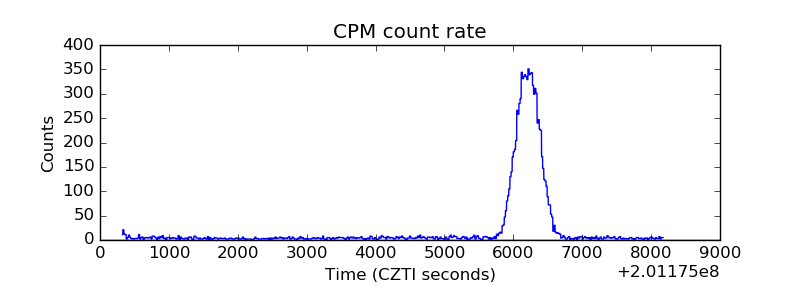 |
| CZT Counter | 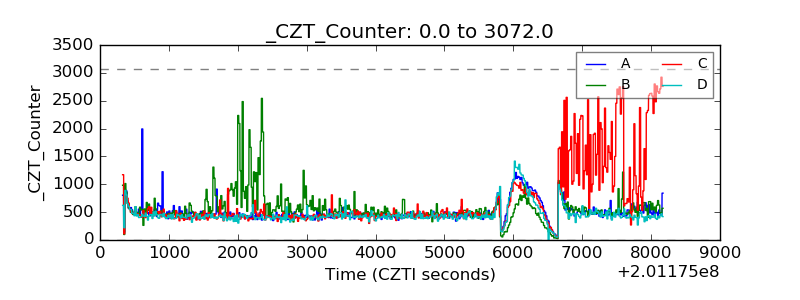 |
| +2.5 Volts monitor | 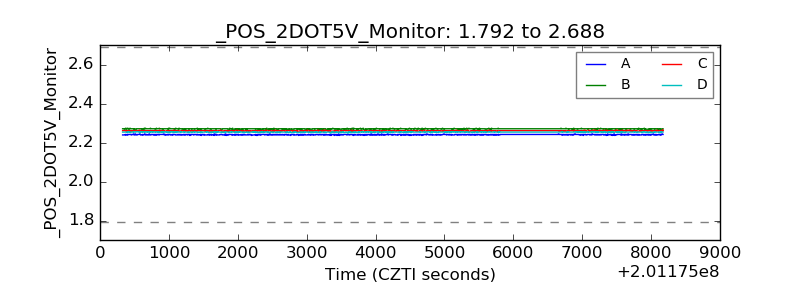 |
| +5 Volts monitor |  |
| _ROLL_ROT | 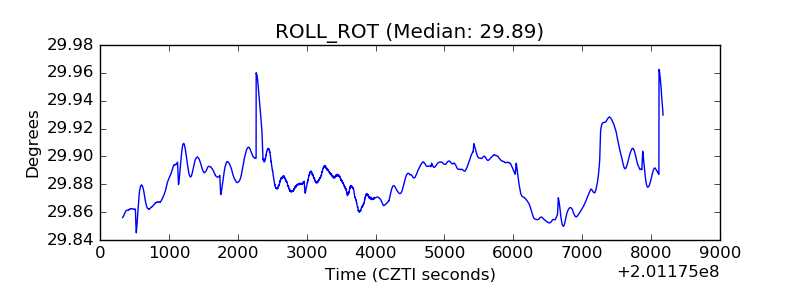 |
| _Roll_DEC | 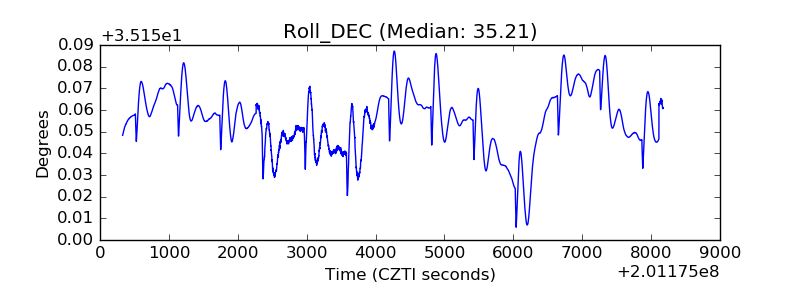 |
| _Roll_RA | 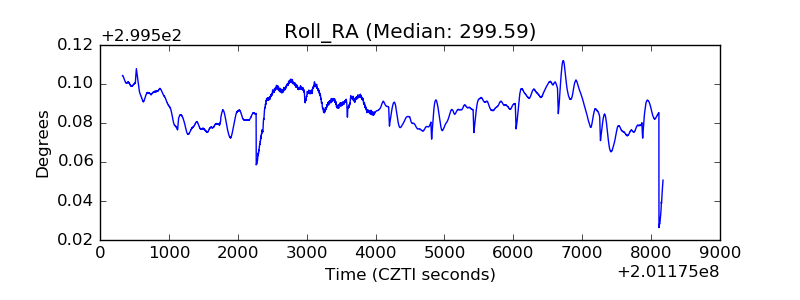 |
| Veto Counter | 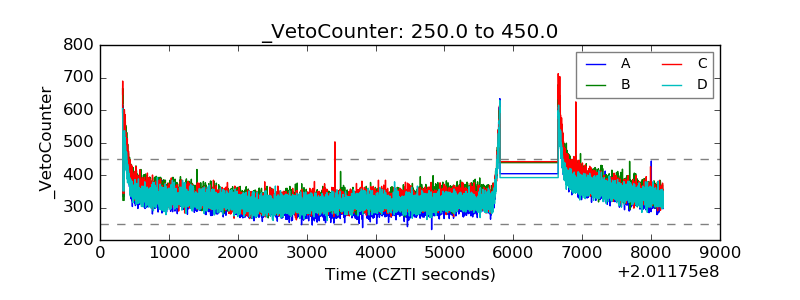 |