| Param | Original file | Final file |
|---|---|---|
| Filename | modeM0/AS1G05_167T01_9000000456_03440cztM0_level2.evt | modeM0/AS1G05_167T01_9000000456_03440cztM0_level2_quad_clean.evt |
| Size (bytes) | 716,126,400 | 56,707,200 |
| Size | 683.0 MB | 54.1 MB |
| Events in quadrant A | 3,284,196 | 355,912 |
| Events in quadrant B | 3,522,318 | 349,875 |
| Events in quadrant C | 11,391,037 | 212,932 |
| Events in quadrant D | 3,049,605 | 342,852 |
| Mode M9 | |||
|---|---|---|---|
| Quadrant | BADHDUFLAG | Total packets | Discarded packets |
| A | 0 | 10 | 0 |
| B | 0 | 10 | 0 |
| C | 0 | 10 | 0 |
| D | 0 | 10 | 0 |
| Mode SS | |||
|---|---|---|---|
| Quadrant | BADHDUFLAG | Total packets | Discarded packets |
| A | 0 | 132 | 0 |
| B | 0 | 132 | 0 |
| C | 0 | 132 | 0 |
| D | 0 | 132 | 0 |
| Mode M0 | |||
|---|---|---|---|
| Quadrant | BADHDUFLAG | Total packets | Discarded packets |
| A | 0 | 13956 | 2 |
| B | 0 | 14559 | 1 |
| C | 0 | 38185 | 1 |
| D | 0 | 13593 | 1 |
| Quadrant | Total seconds | Saturated seconds | Saturation percentage |
|---|---|---|---|
| A | 6512 | 78 | 1.197789% |
| B | 6512 | 66 | 1.013514% |
| C | 6512 | 3289 | 50.506757% |
| D | 6512 | 65 | 0.998157% |
Noise dominated data is calculated using 1-second bins in cleaned event files. If a bin has >2000 counts, and if more than 50% of those come from <1% of pixels, then it is considered to be noise-dominated and hence unusable.
| Quadrant | # 1 sec bins | Bins with >0 counts | Bins with >2000 counts | High rate bins dominated by noise | Noise dominated (total time) | Noise dominated (detector-on time) | Marked lightcurve |
|---|---|---|---|---|---|---|---|
| A | 7552 | 6512 | 8 | 8 | 0.11% | 0.12% | 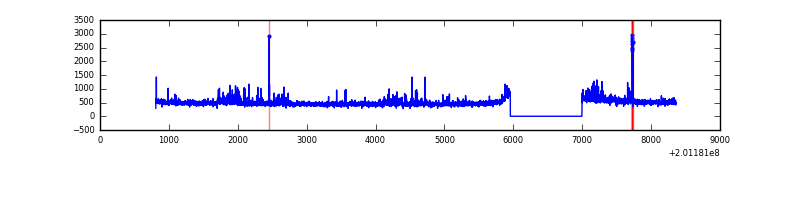 |
| B | 7552 | 6512 | 2 | 2 | 0.03% | 0.03% | 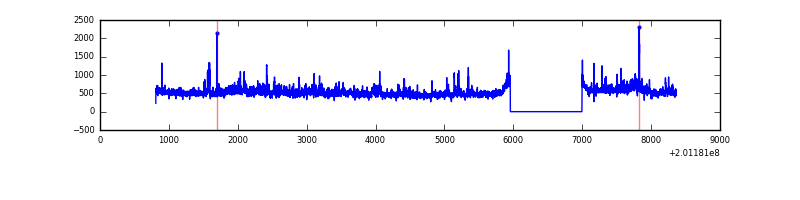 |
| C | 7552 | 6512 | 3067 | 3067 | 40.61% | 47.10% | 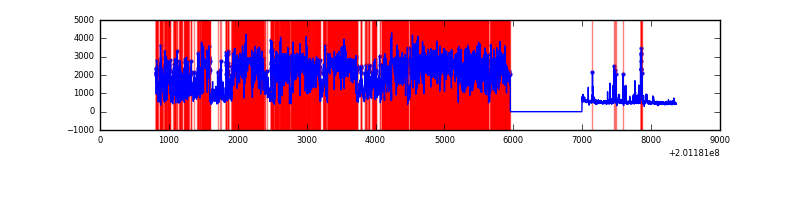 |
| D | 7552 | 6512 | 13 | 13 | 0.17% | 0.20% | 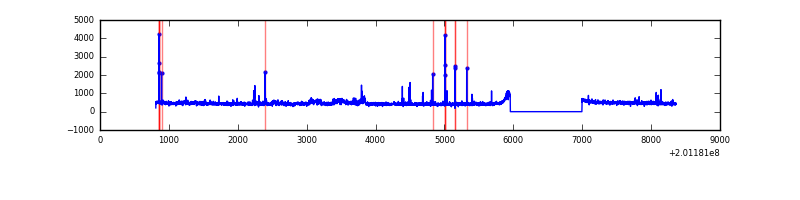 |
Top three noisy pixels from each quadrant. If the there are fewer than three noisy pixels in the level2.evt file, extra rows are filled as -1
| Pixel properties | Quadrant properties | ||||||
|---|---|---|---|---|---|---|---|
| Quadrant | DetID | PixID | Counts | Sigma | Mean | Median | Sigma |
| A | 14 | 249 | 133024 | 827.5 | 777 | 762 | 159.8 |
| A | 15 | 249 | 84144 | 521.68 | 777 | 762 | 159.8 |
| A | 0 | 149 | 36439 | 223.21 | 777 | 762 | 159.8 |
| B | 15 | 204 | 353474 | 2315.97 | 784 | 765 | 152.3 |
| B | 14 | 167 | 50450 | 326.24 | 784 | 765 | 152.3 |
| B | 0 | 228 | 17721 | 111.34 | 784 | 765 | 152.3 |
| C | 1 | 192 | 8807860 | 64142.03 | 594 | 600 | 137.3 |
| C | 7 | 220 | 243389 | 1768.2 | 594 | 600 | 137.3 |
| C | 14 | 223 | 12035 | 83.28 | 594 | 600 | 137.3 |
| D | 2 | 37 | 108272 | 584.58 | 753 | 733 | 184.0 |
| D | 2 | 31 | 22220 | 116.8 | 753 | 733 | 184.0 |
| D | 9 | 85 | 21396 | 112.32 | 753 | 733 | 184.0 |
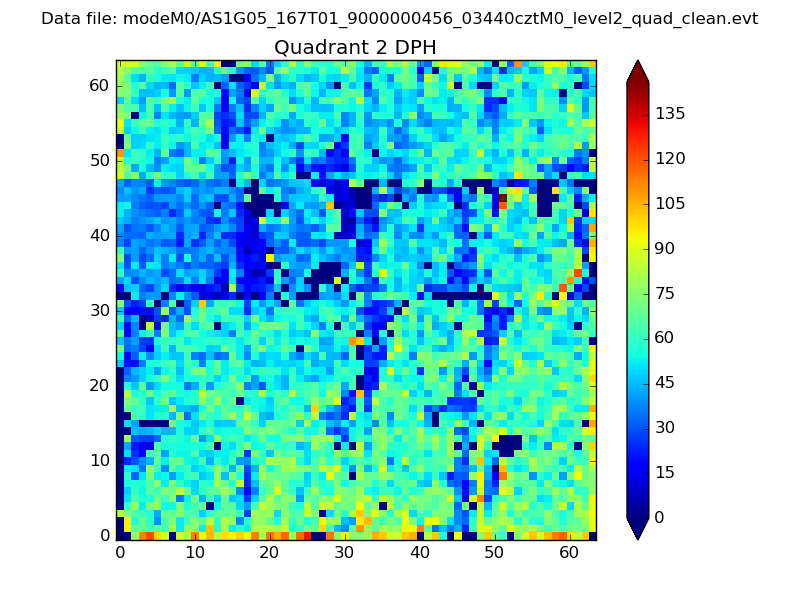
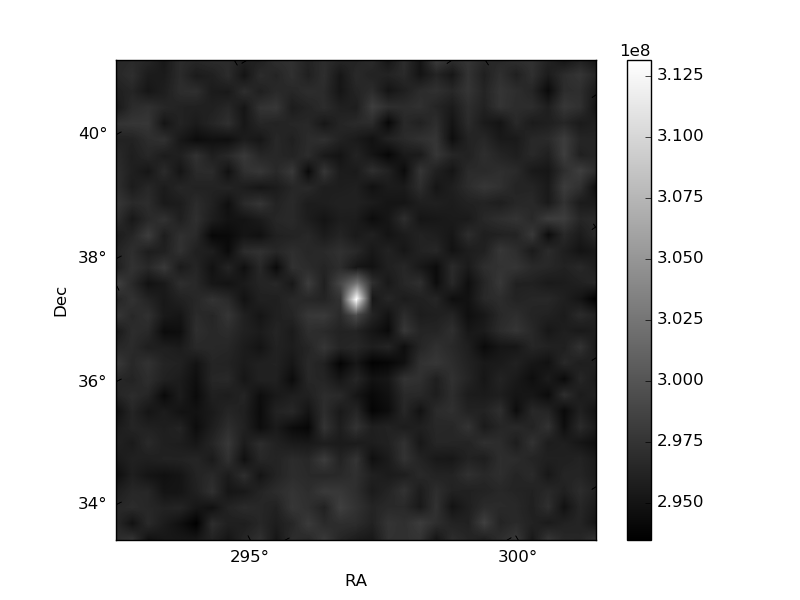
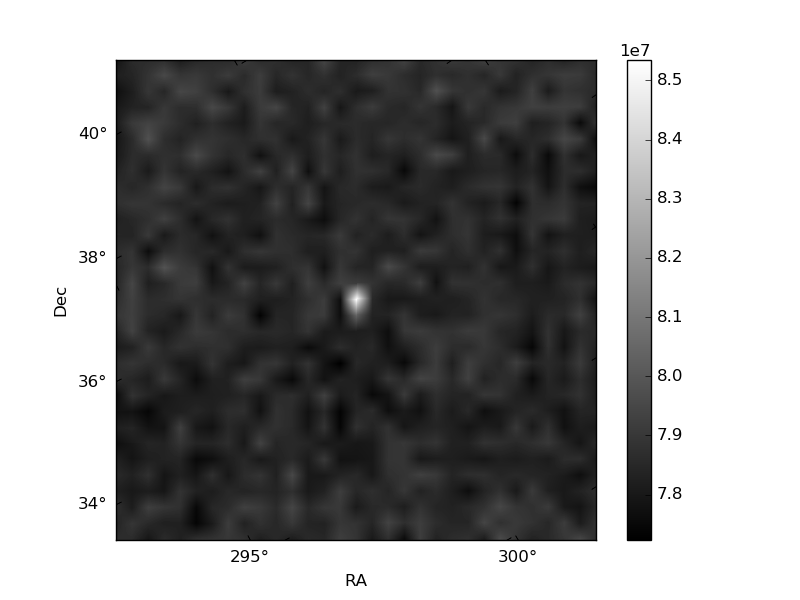
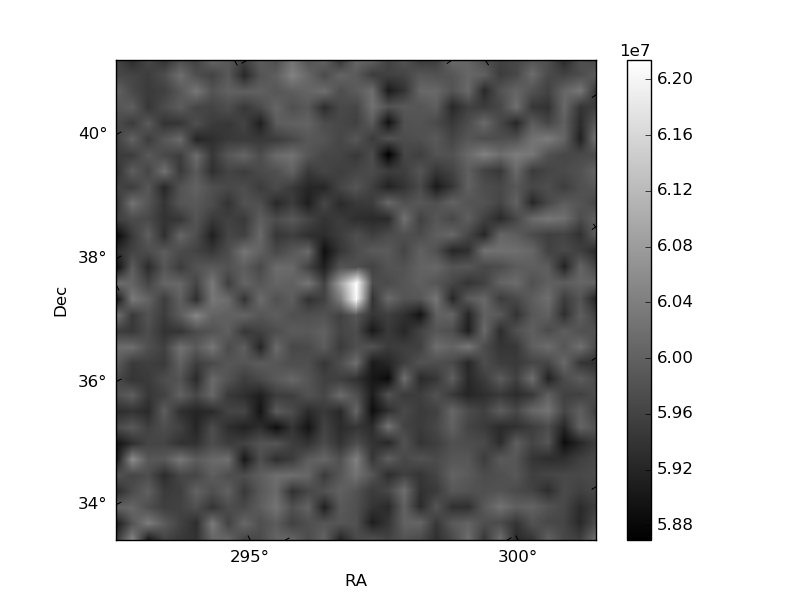
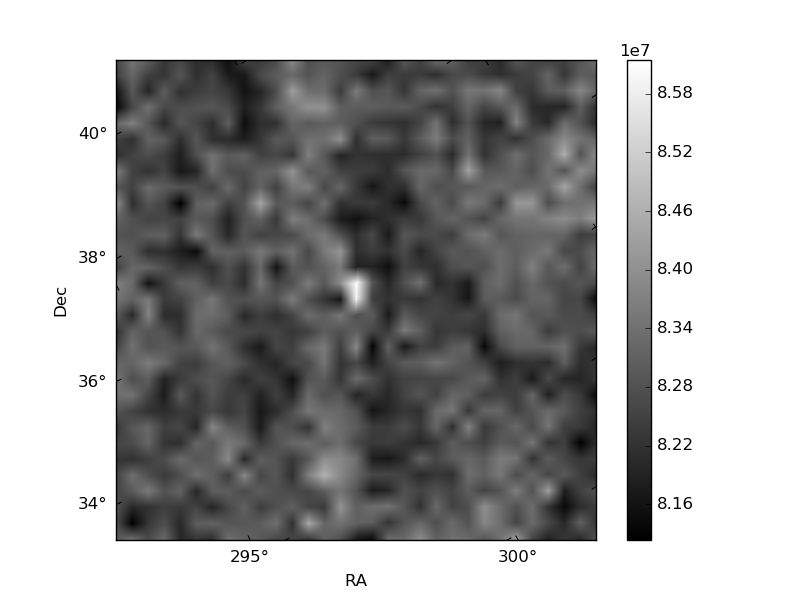
Histogram calculated using DETX and DETY for each event in the final _common_clean file
| Quadrant A | 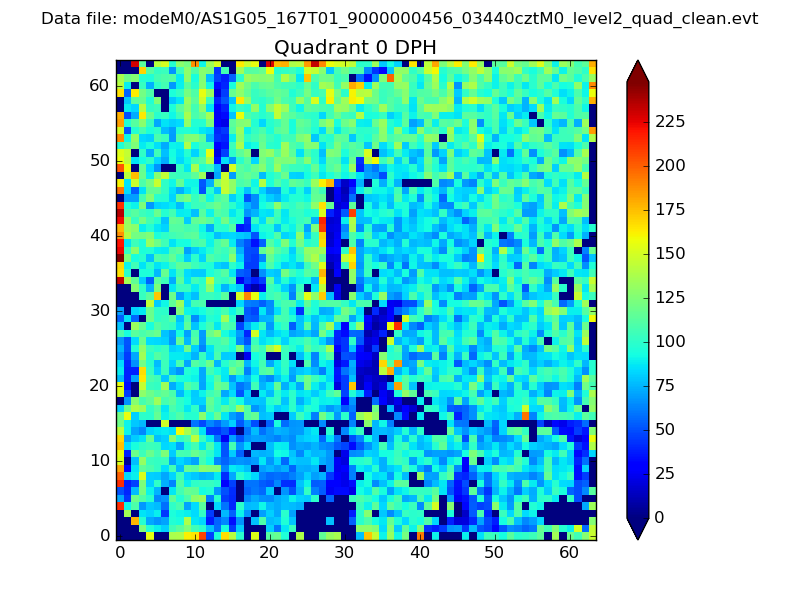 |
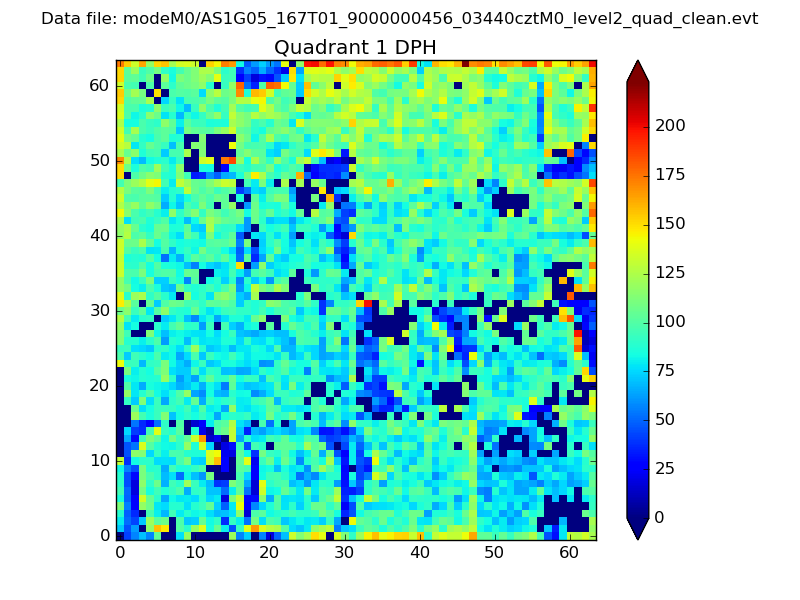 |
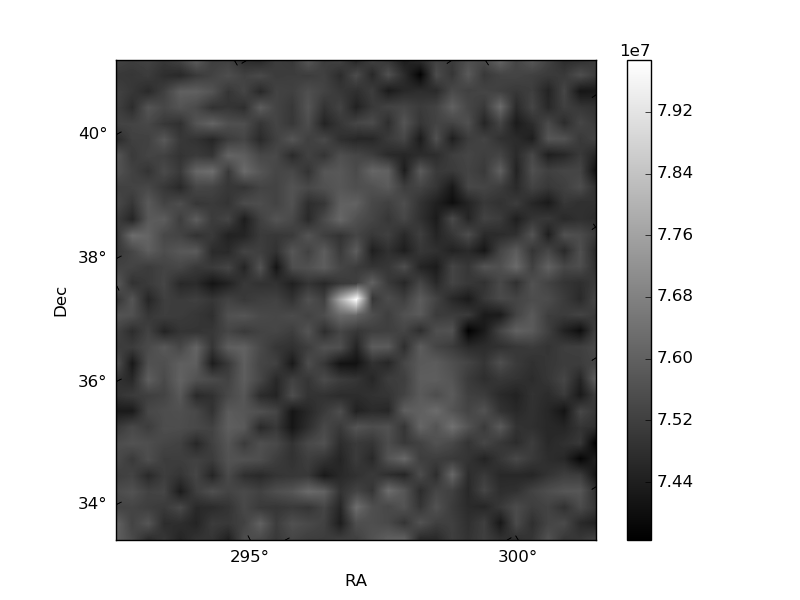
Quadrant B |
|---|---|---|---|
| Quadrant D | 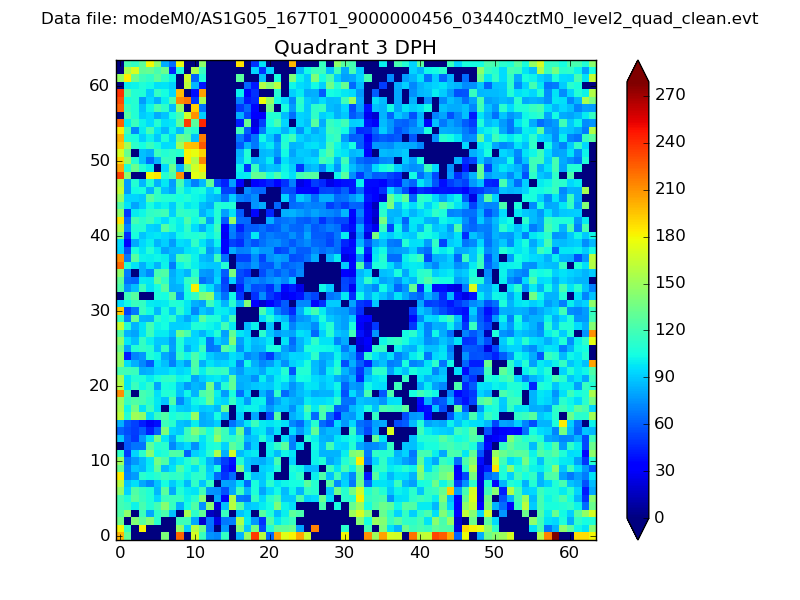 |
 |
Quadrant C |
| Plot type | Count rate plots | Images |
|---|---|---|
| Comparison with Poisson distribution Blue bars denote a histogram of data divided into 1 sec bins. Red curve is a Poisson curve with rate = median count rate of data. |
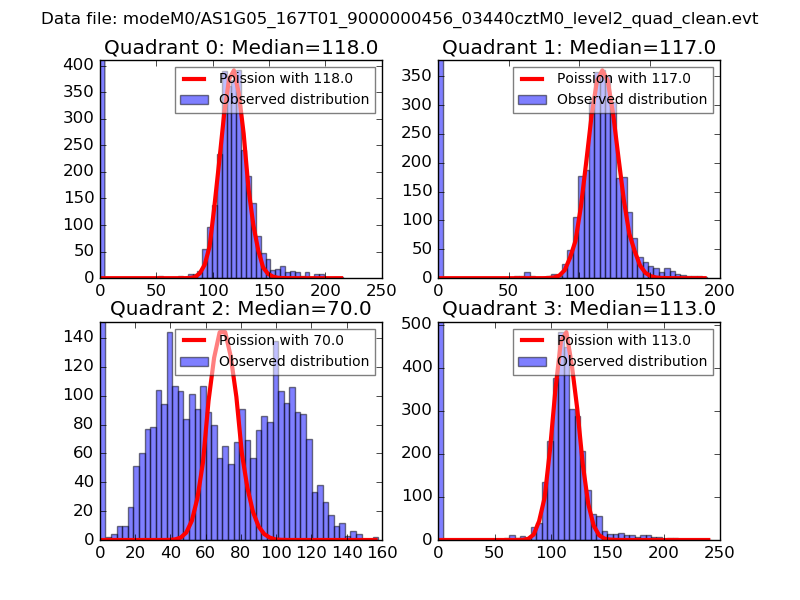 |
 |
| Quadrant-wise count rates Data is divided into 100 sec bins |
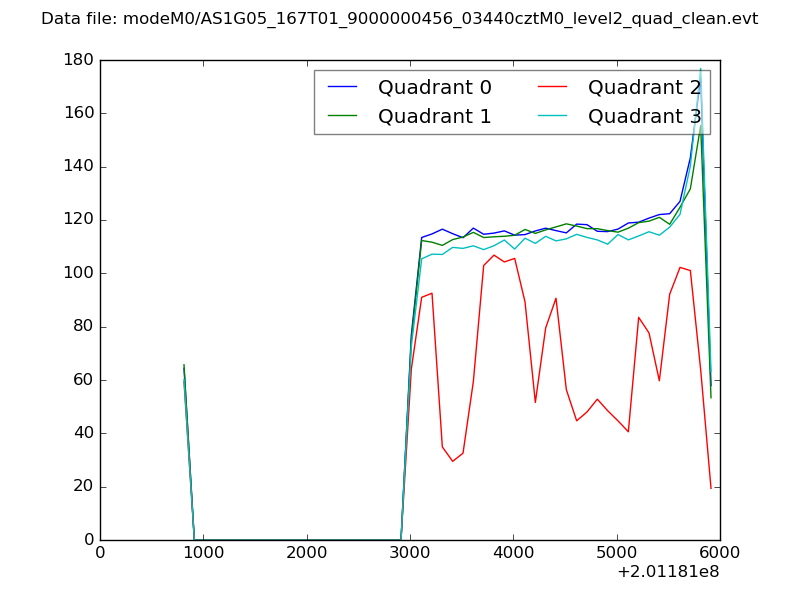 |
|
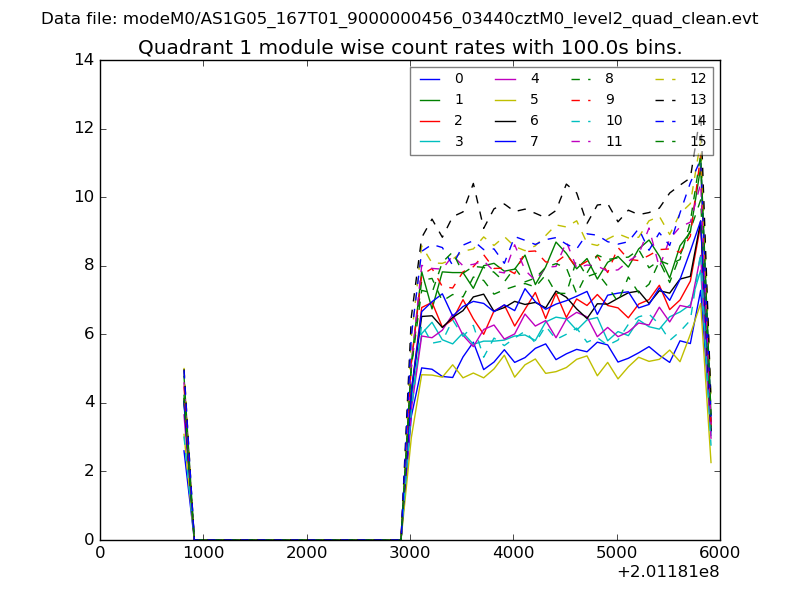
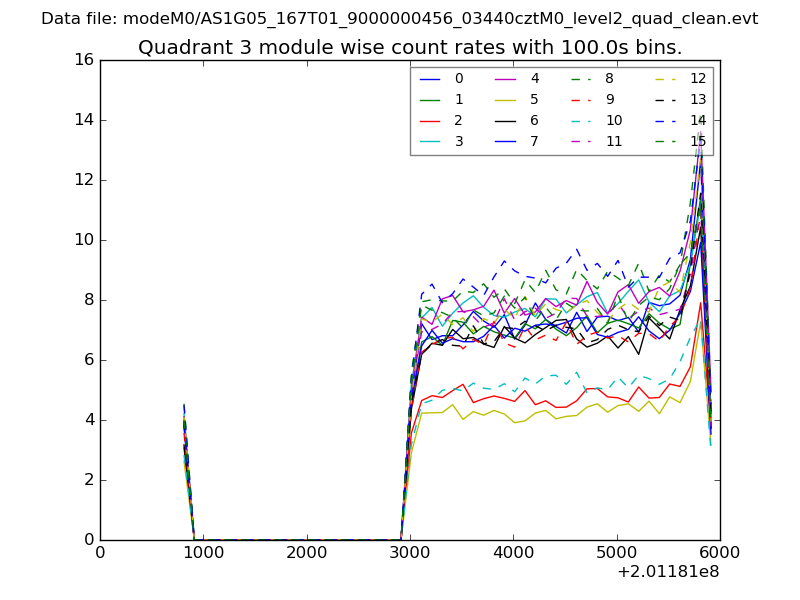
| Module-wise count rates for Quadrant A Data is divided into 100 sec bins |
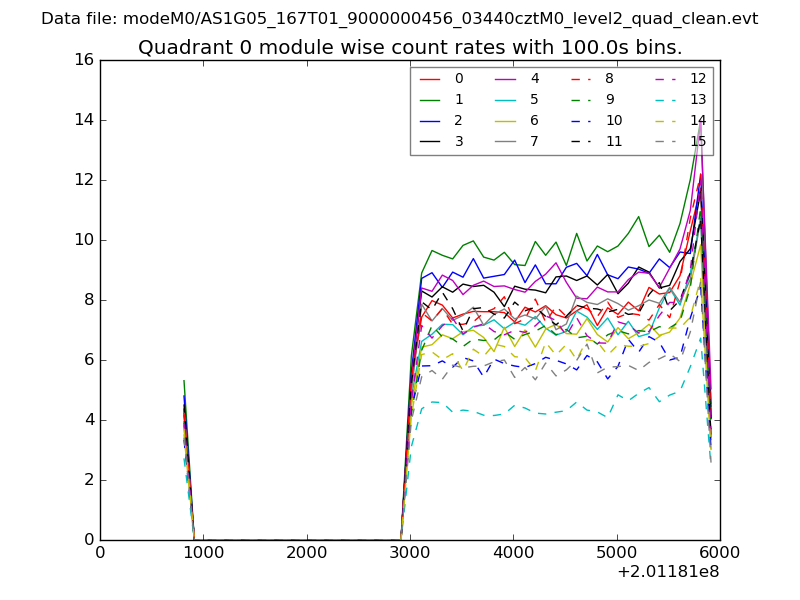 |
 |
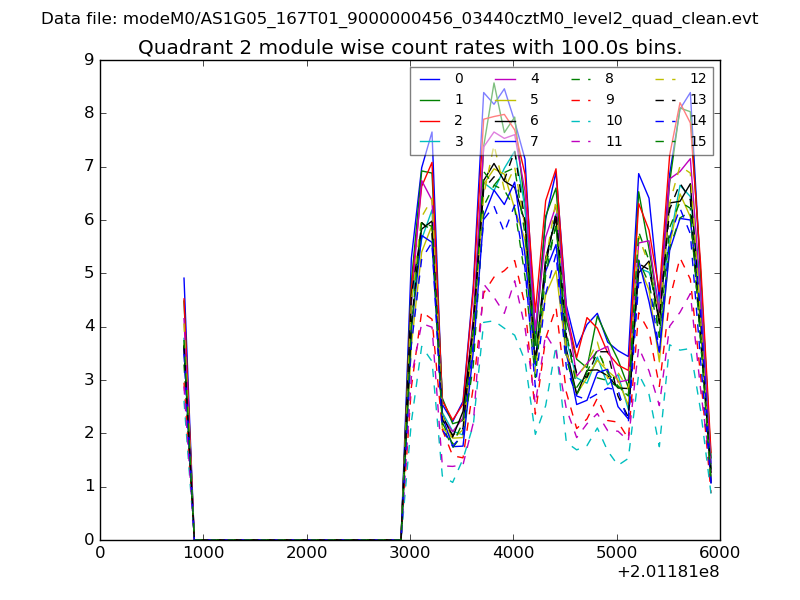
| Module-wise count rates for Quadrant B Data is divided into 100 sec bins |
 |
 |
| Module-wise count rates for Quadrant C Data is divided into 100 sec bins |
 |
 |
| Module-wise count rates for Quadrant D Data is divided into 100 sec bins |
 |
 |
| Parameter | Plot |
|---|---|
| CZT HV Monitor | 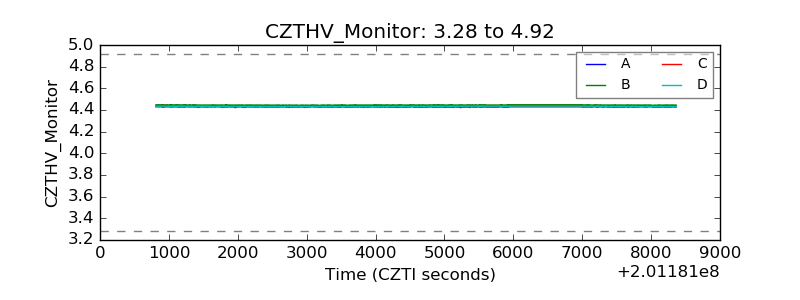 |
| D_VDD | 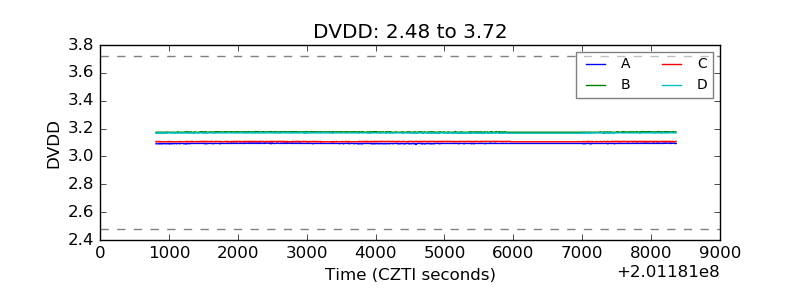 |
| Temperature 1 | 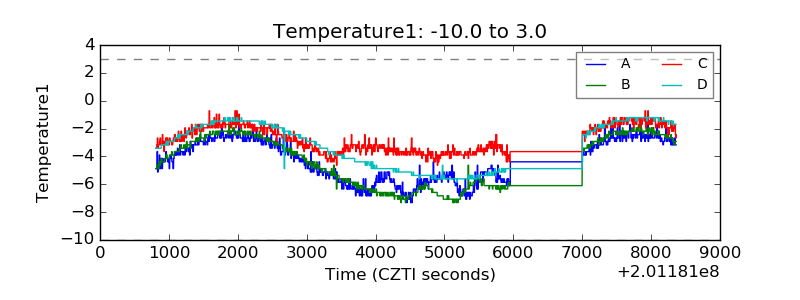 |
| Veto HV Monitor | 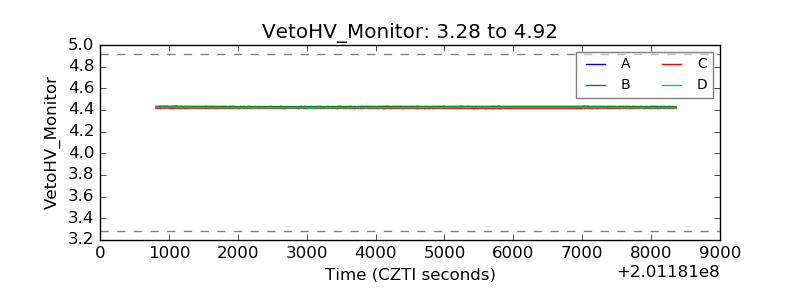 |
| Veto LLD | 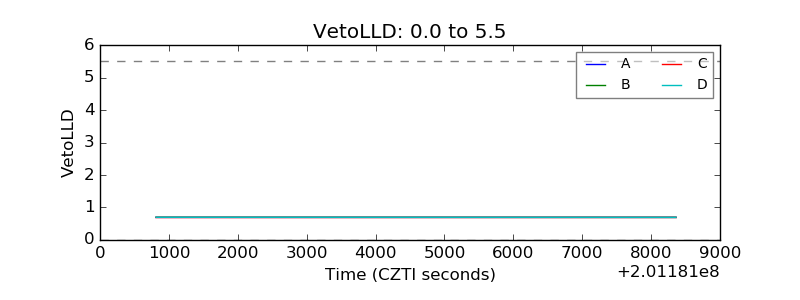 |
| Alpha Counter | 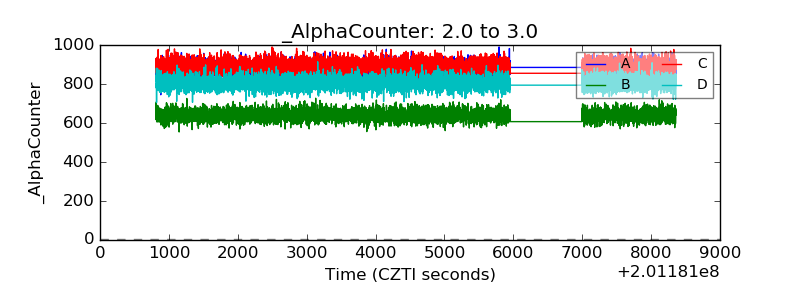 |
| _CPM_Rate | 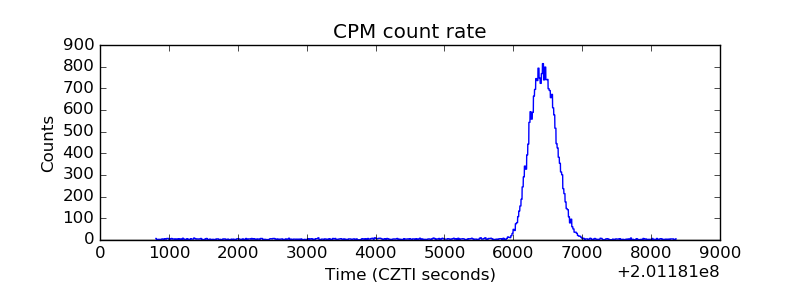 |
| CZT Counter | 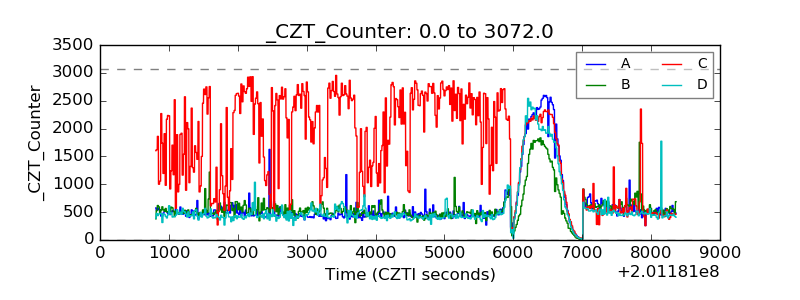 |
| +2.5 Volts monitor |  |
| +5 Volts monitor | 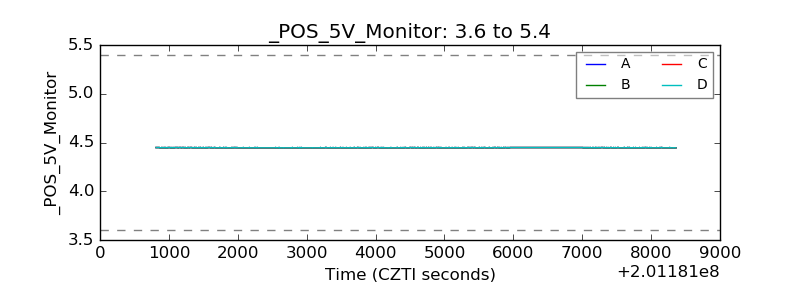 |
| _ROLL_ROT | 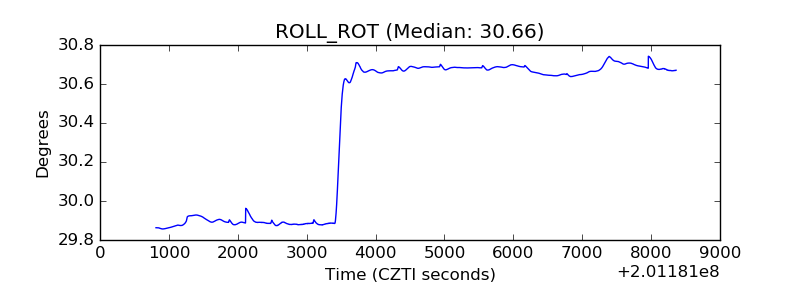 |
| _Roll_DEC | 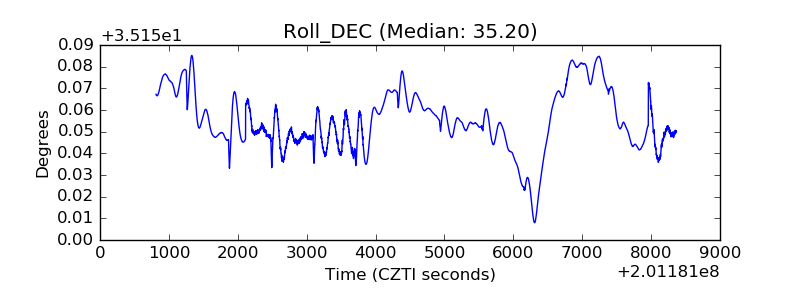 |
| _Roll_RA | 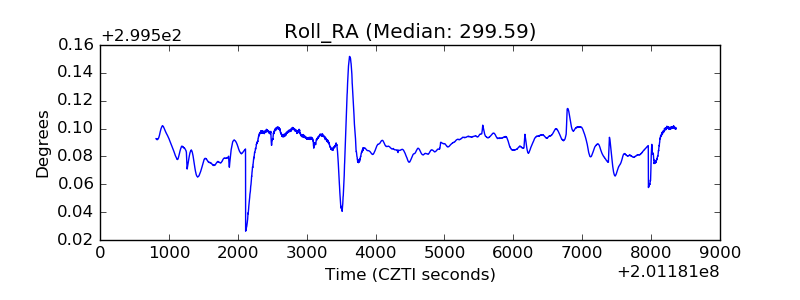 |
| Veto Counter | 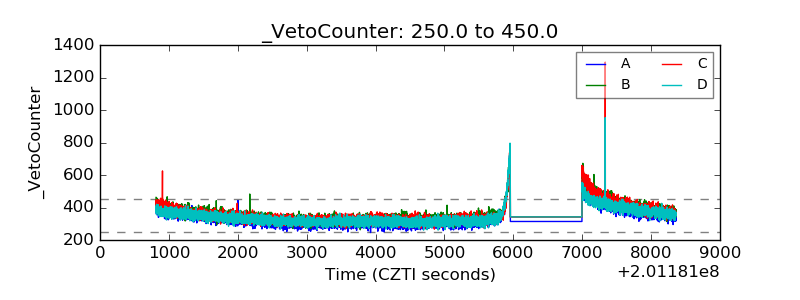 |