| Param | Original file | Final file |
|---|---|---|
| Filename | modeM0/AS1G05_167T01_9000000456_03442cztM0_level2.evt | modeM0/AS1G05_167T01_9000000456_03442cztM0_level2_quad_clean.evt |
| Size (bytes) | 490,167,360 | 63,777,600 |
| Size | 467.5 MB | 60.8 MB |
| Events in quadrant A | 3,202,317 | 382,131 |
| Events in quadrant B | 3,459,594 | 376,782 |
| Events in quadrant C | 4,693,512 | 360,633 |
| Events in quadrant D | 3,054,276 | 364,226 |
| Mode M9 | |||
|---|---|---|---|
| Quadrant | BADHDUFLAG | Total packets | Discarded packets |
| A | 0 | 12 | 0 |
| B | 0 | 12 | 0 |
| C | 0 | 12 | 0 |
| D | 0 | 12 | 0 |
| Mode SS | |||
|---|---|---|---|
| Quadrant | BADHDUFLAG | Total packets | Discarded packets |
| A | 0 | 130 | 0 |
| B | 0 | 130 | 0 |
| C | 0 | 130 | 0 |
| D | 0 | 130 | 0 |
| Mode M0 | |||
|---|---|---|---|
| Quadrant | BADHDUFLAG | Total packets | Discarded packets |
| A | 0 | 13775 | 3 |
| B | 0 | 14599 | 2 |
| C | 0 | 18202 | 2 |
| D | 0 | 13536 | 2 |
| Quadrant | Total seconds | Saturated seconds | Saturation percentage |
|---|---|---|---|
| A | 6407 | 77 | 1.201811% |
| B | 6407 | 78 | 1.217418% |
| C | 6407 | 511 | 7.975652% |
| D | 6408 | 76 | 1.186017% |
Noise dominated data is calculated using 1-second bins in cleaned event files. If a bin has >2000 counts, and if more than 50% of those come from <1% of pixels, then it is considered to be noise-dominated and hence unusable.
| Quadrant | # 1 sec bins | Bins with >0 counts | Bins with >2000 counts | High rate bins dominated by noise | Noise dominated (total time) | Noise dominated (detector-on time) | Marked lightcurve |
|---|---|---|---|---|---|---|---|
| A | 7552 | 6407 | 7 | 7 | 0.09% | 0.11% | 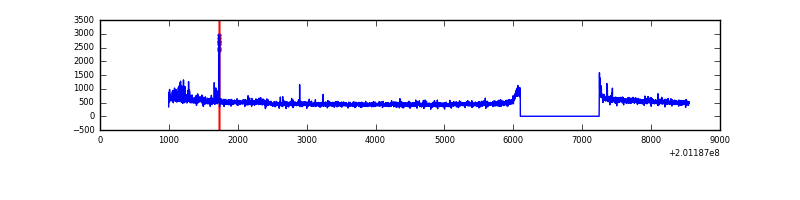 |
| B | 7552 | 6408 | 1 | 1 | 0.01% | 0.02% | 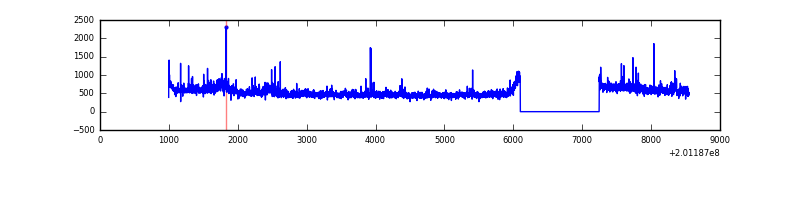 |
| C | 7552 | 6408 | 344 | 344 | 4.56% | 5.37% | 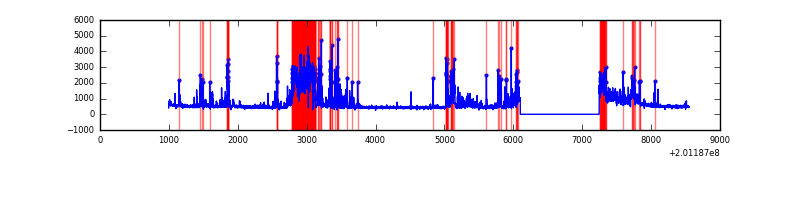 |
| D | 7553 | 6408 | 16 | 16 | 0.21% | 0.25% | 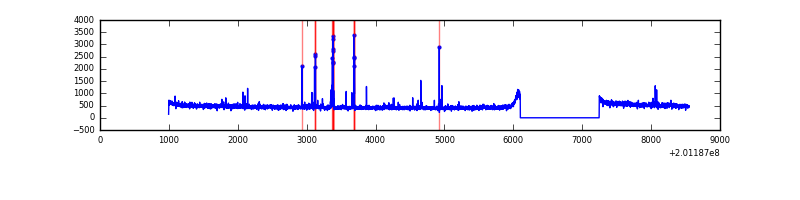 |
Top three noisy pixels from each quadrant. If the there are fewer than three noisy pixels in the level2.evt file, extra rows are filled as -1
| Pixel properties | Quadrant properties | ||||||
|---|---|---|---|---|---|---|---|
| Quadrant | DetID | PixID | Counts | Sigma | Mean | Median | Sigma |
| A | 14 | 249 | 78405 | 474.87 | 793 | 778 | 163.5 |
| A | 0 | 149 | 37614 | 225.34 | 793 | 778 | 163.5 |
| A | 3 | 1 | 19410 | 113.98 | 793 | 778 | 163.5 |
| B | 15 | 204 | 279499 | 1797.5 | 800 | 784 | 155.1 |
| B | 0 | 228 | 17147 | 105.53 | 800 | 784 | 155.1 |
| B | 4 | 200 | 16152 | 99.11 | 800 | 784 | 155.1 |
| C | 1 | 192 | 1117791 | 6506.4 | 749 | 757 | 171.7 |
| C | 7 | 220 | 629695 | 3663.38 | 749 | 757 | 171.7 |
| C | 15 | 208 | 10966 | 59.46 | 749 | 757 | 171.7 |
| D | 13 | 223 | 81556 | 433.22 | 768 | 746 | 186.5 |
| D | 5 | 233 | 27015 | 140.83 | 768 | 746 | 186.5 |
| D | 2 | 37 | 15706 | 80.2 | 768 | 746 | 186.5 |
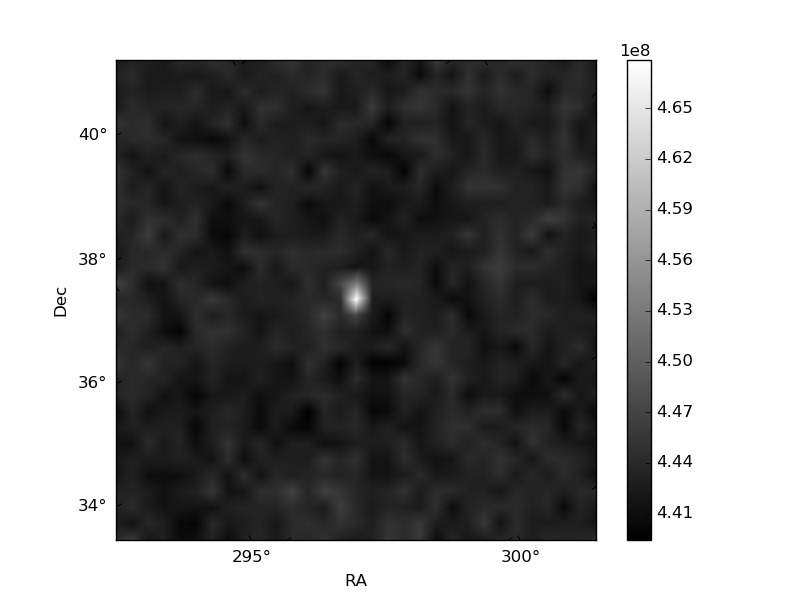
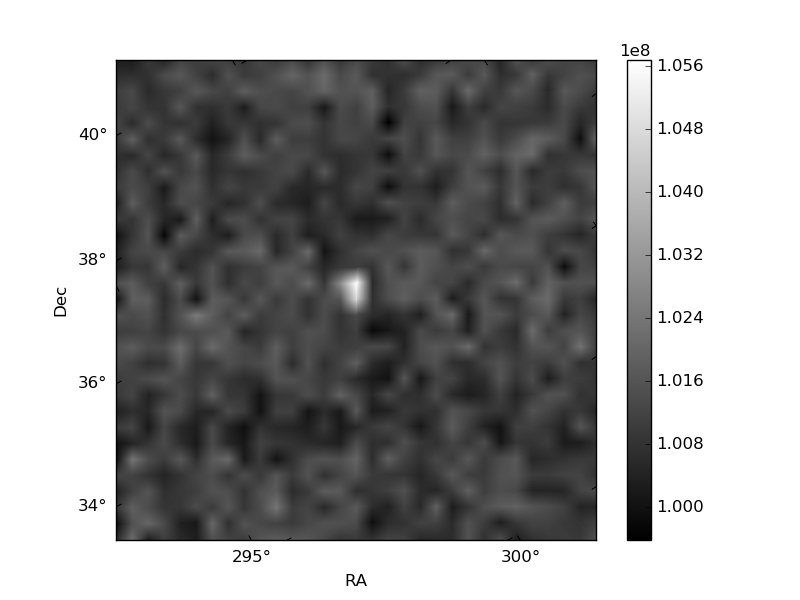
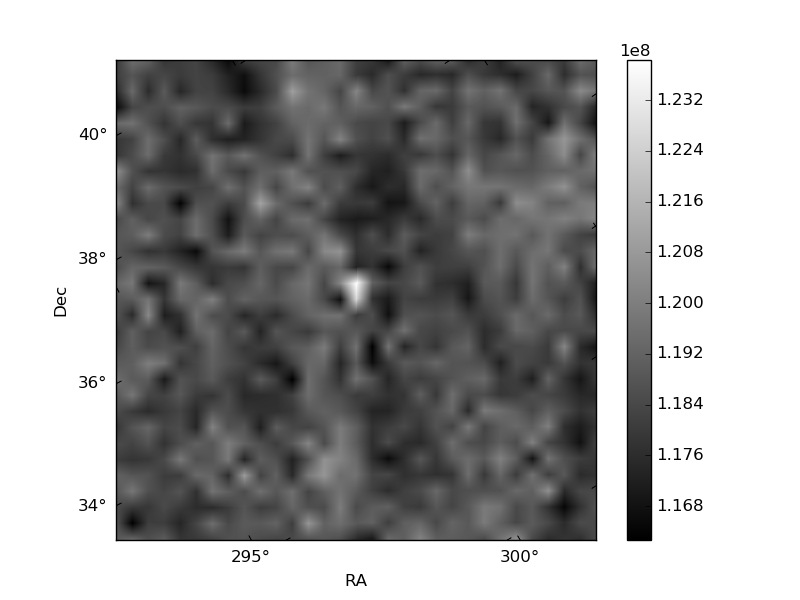
Histogram calculated using DETX and DETY for each event in the final _common_clean file
| Quadrant A | 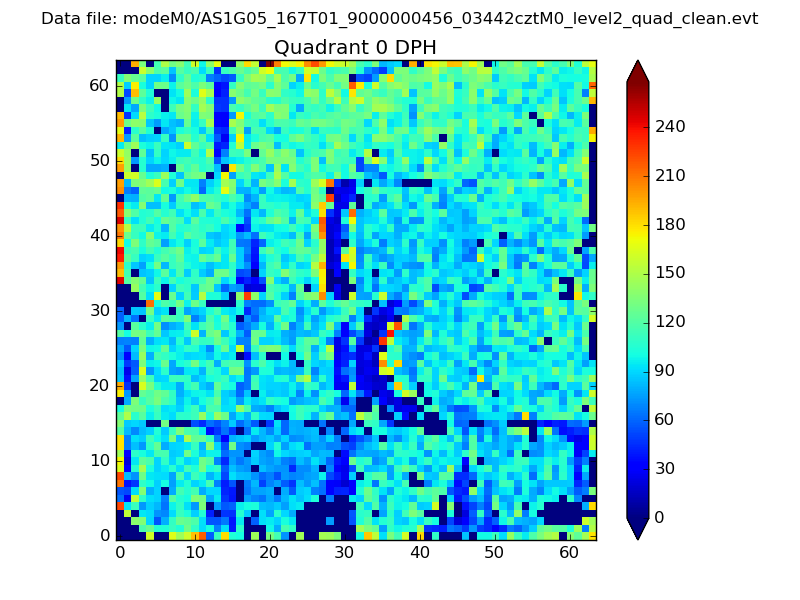 |
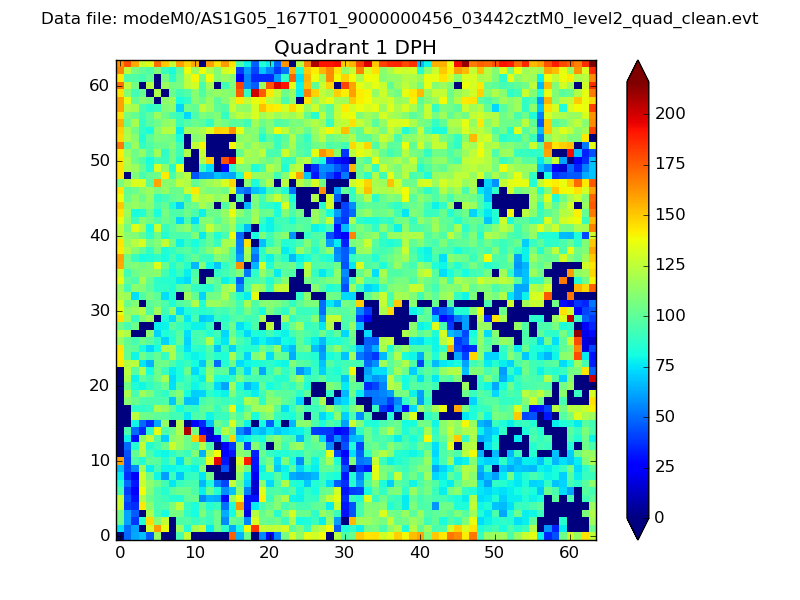 |
Quadrant B |
|---|---|---|---|
| Quadrant D | 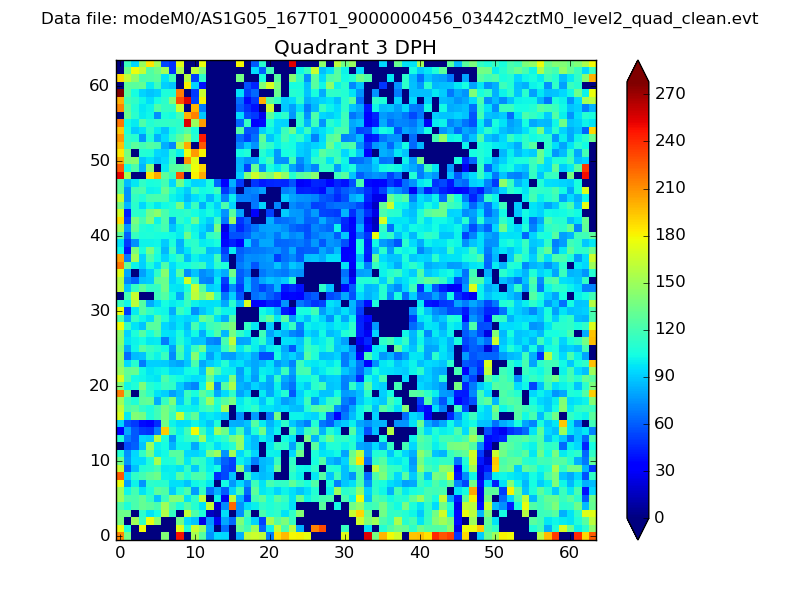 |
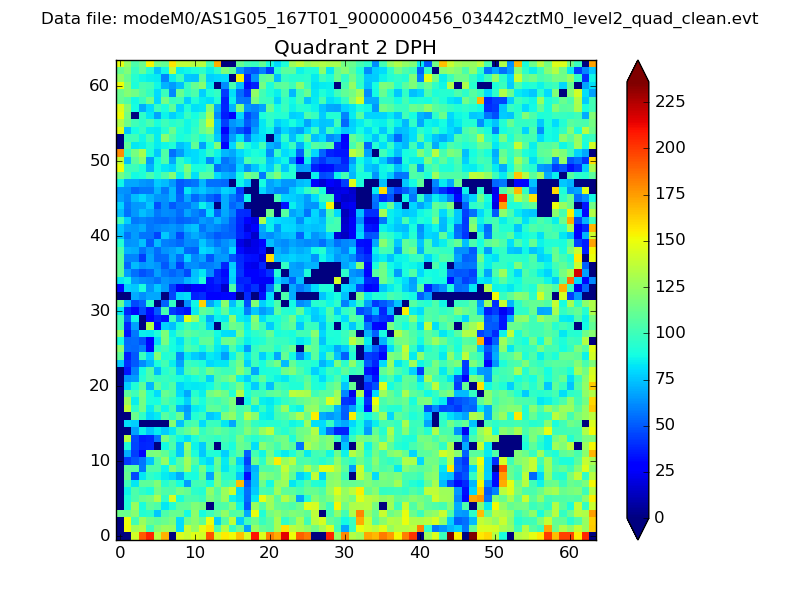 |
Quadrant C |
| Plot type | Count rate plots | Images |
|---|---|---|
| Comparison with Poisson distribution Blue bars denote a histogram of data divided into 1 sec bins. Red curve is a Poisson curve with rate = median count rate of data. |
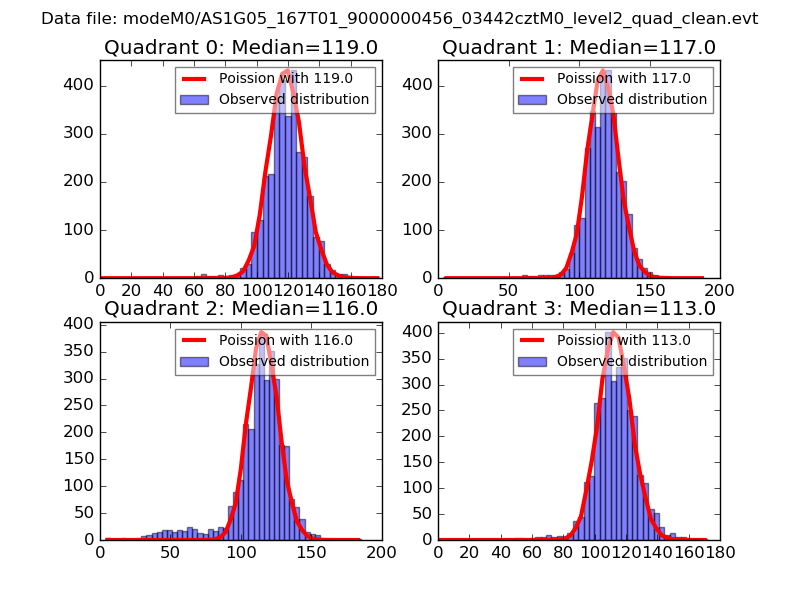 |
 |
| Quadrant-wise count rates Data is divided into 100 sec bins |
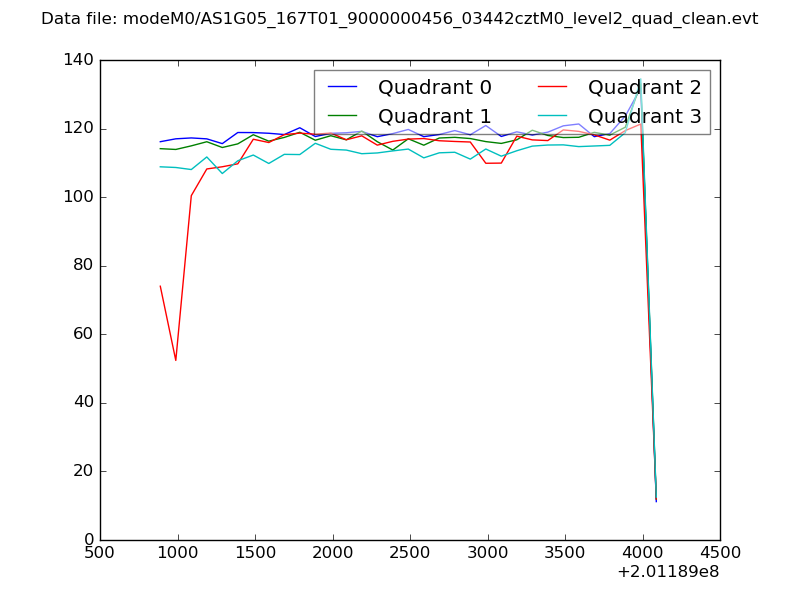 |
|
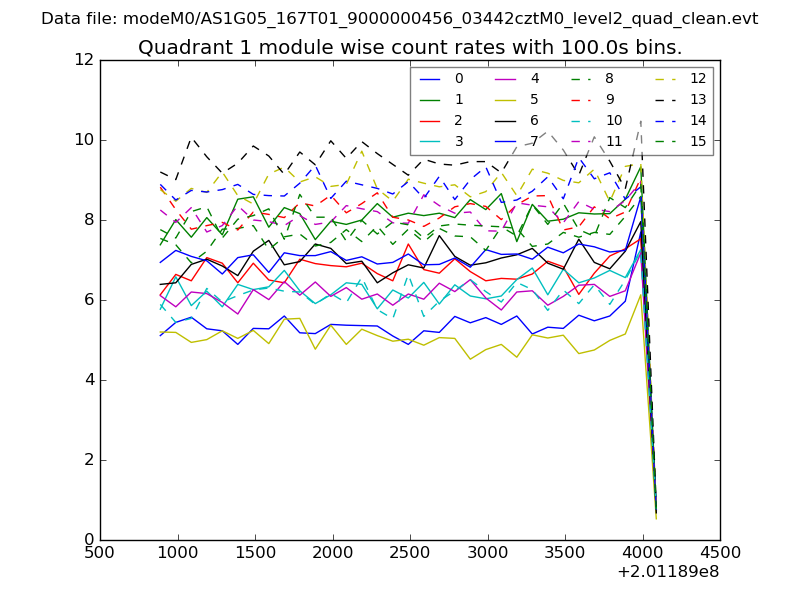
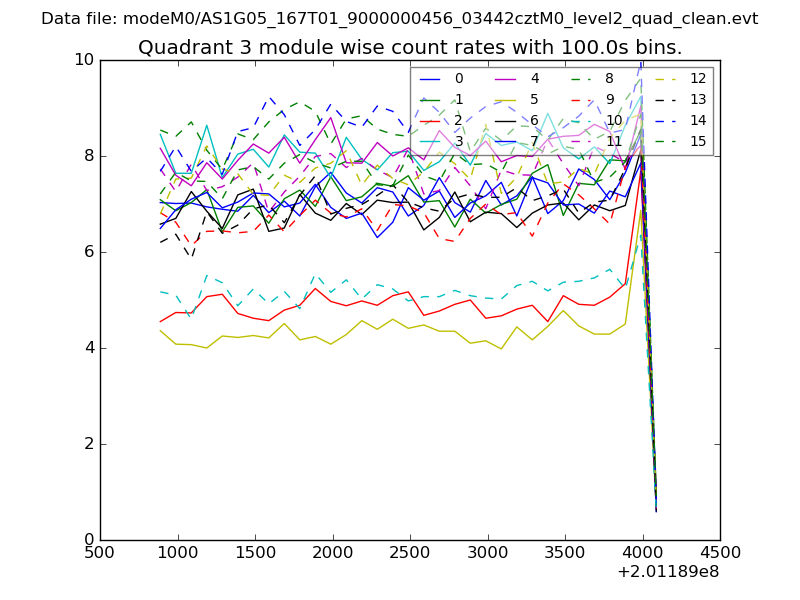
| Module-wise count rates for Quadrant A Data is divided into 100 sec bins |
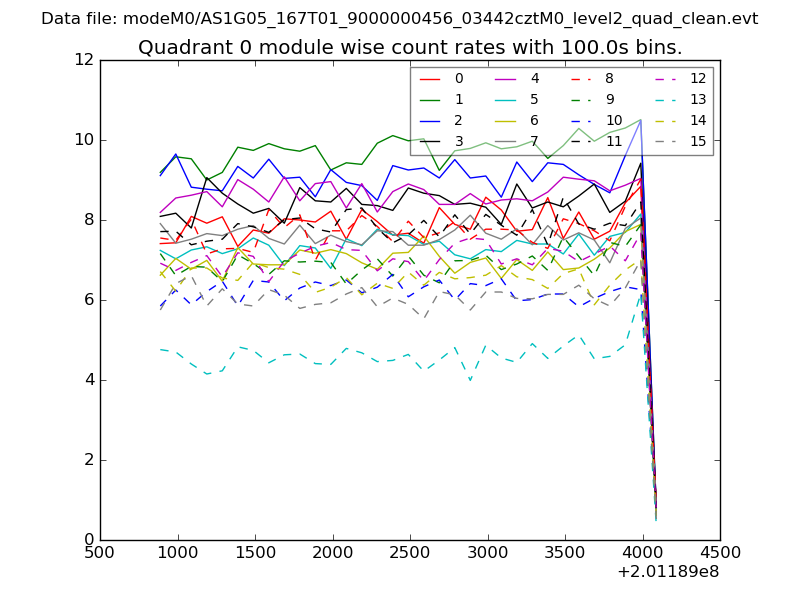 |
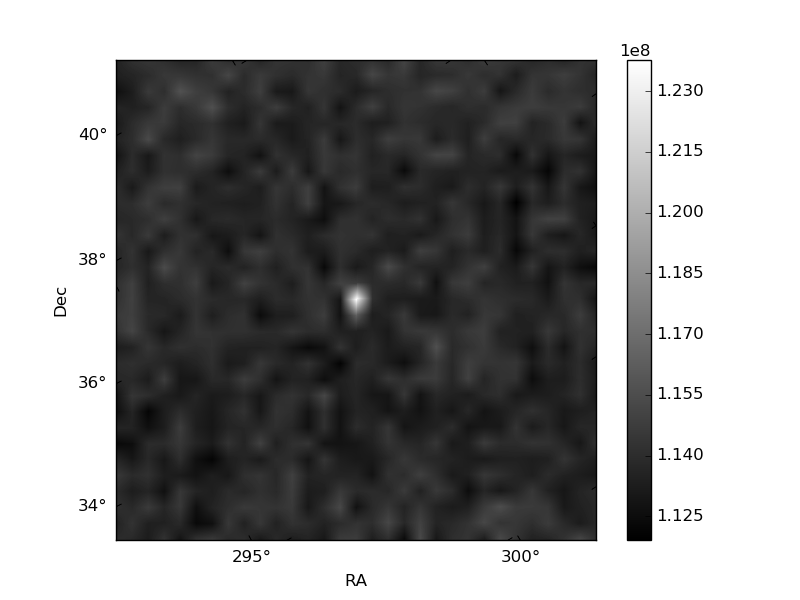 |
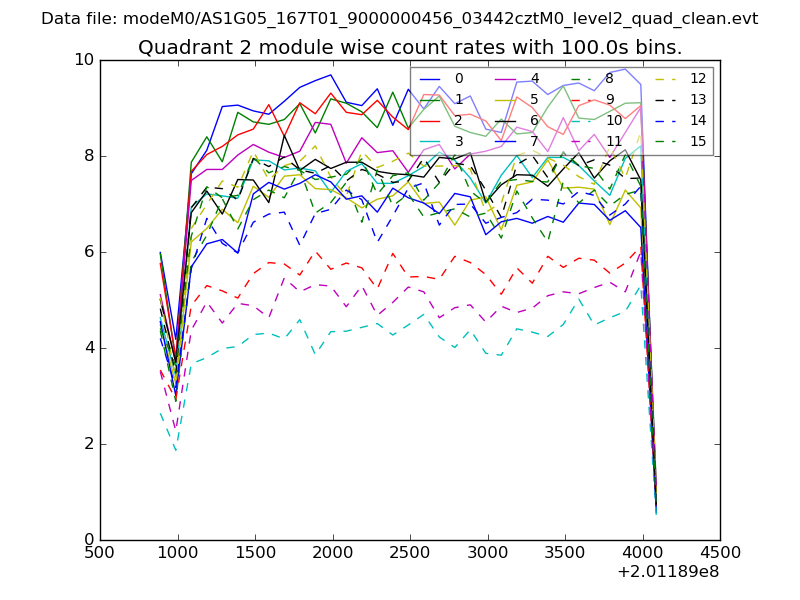
| Module-wise count rates for Quadrant B Data is divided into 100 sec bins |
 |
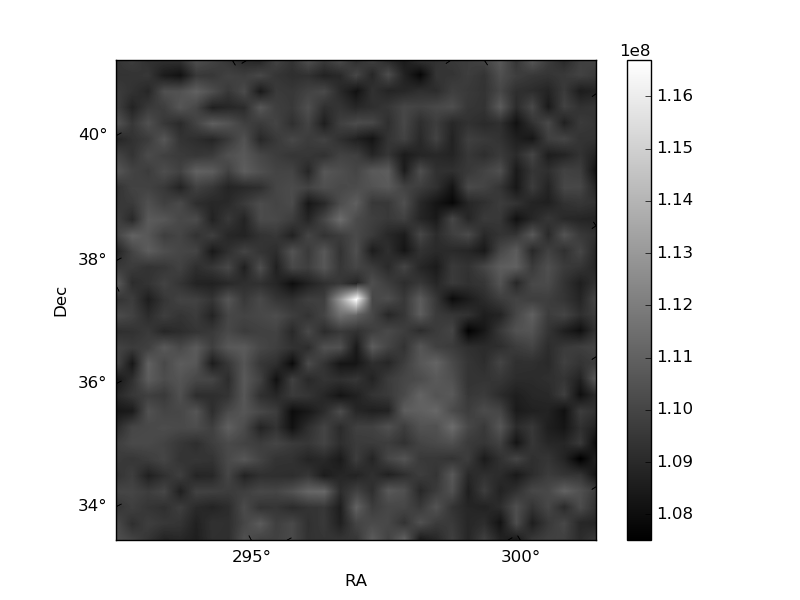 |
| Module-wise count rates for Quadrant C Data is divided into 100 sec bins |
 |
 |
| Module-wise count rates for Quadrant D Data is divided into 100 sec bins |
 |
 |
| Parameter | Plot |
|---|---|
| CZT HV Monitor | 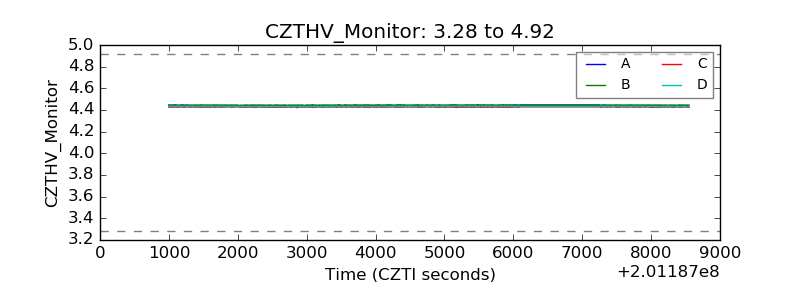 |
| D_VDD | 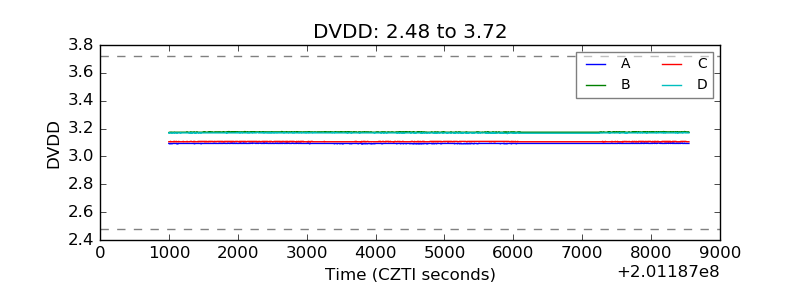 |
| Temperature 1 | 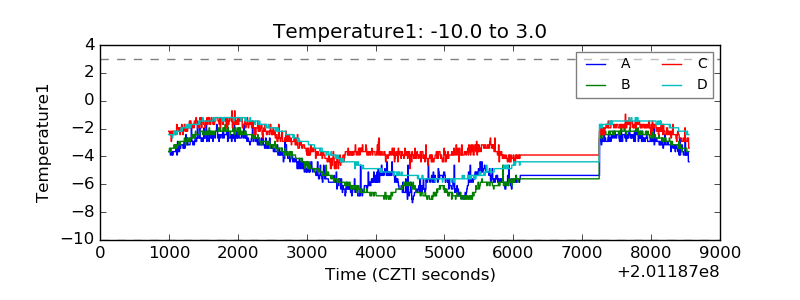 |
| Veto HV Monitor |  |
| Veto LLD | 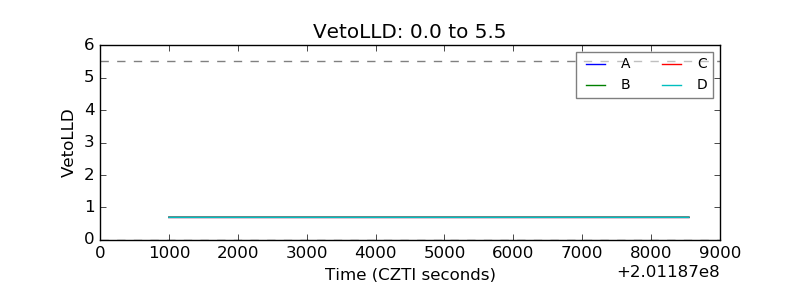 |
| Alpha Counter | 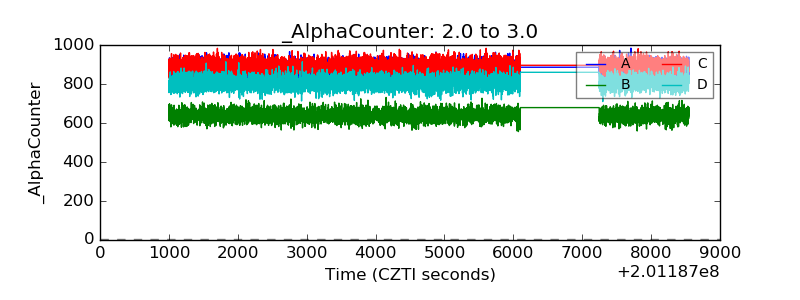 |
| _CPM_Rate | 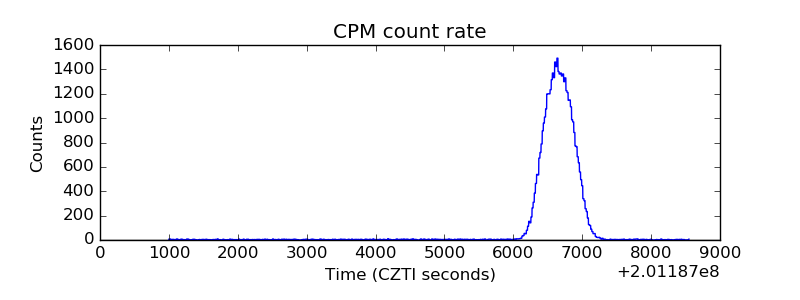 |
| CZT Counter | 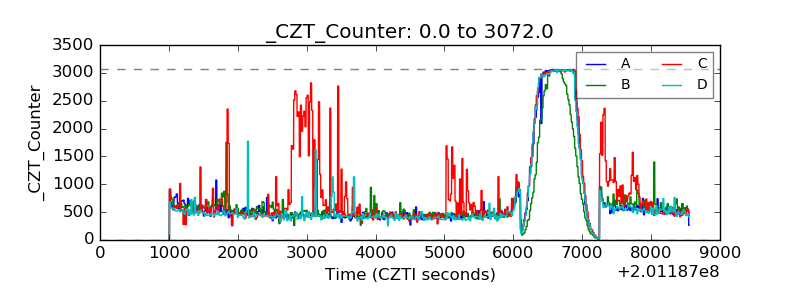 |
| +2.5 Volts monitor |  |
| +5 Volts monitor |  |
| _ROLL_ROT | 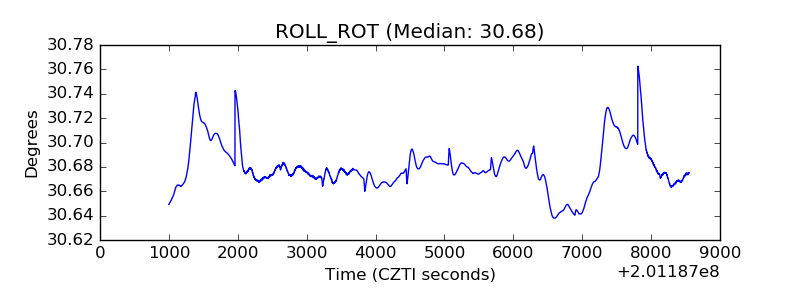 |
| _Roll_DEC |  |
| _Roll_RA | 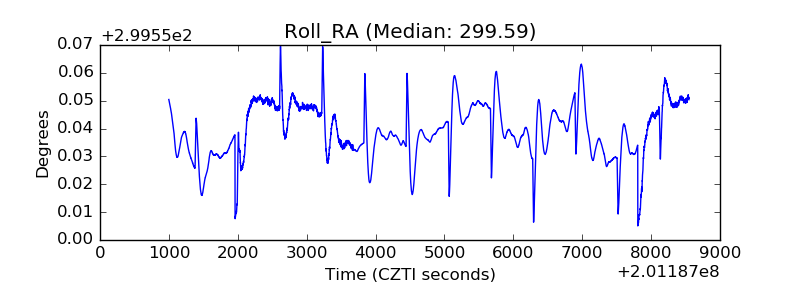 |
| Veto Counter | 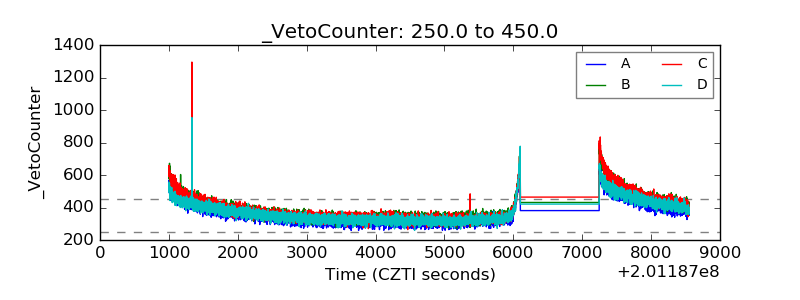 |