| Param | Original file | Final file |
|---|---|---|
| Filename | modeM0/AS1G05_167T01_9000000456_03444cztM0_level2.evt | modeM0/AS1G05_167T01_9000000456_03444cztM0_level2_quad_clean.evt |
| Size (bytes) | 465,151,680 | 85,720,320 |
| Size | 443.6 MB | 81.7 MB |
| Events in quadrant A | 3,096,339 | 548,529 |
| Events in quadrant B | 3,596,020 | 551,522 |
| Events in quadrant C | 3,929,763 | 538,378 |
| Events in quadrant D | 3,047,080 | 527,507 |
| Mode M9 | |||
|---|---|---|---|
| Quadrant | BADHDUFLAG | Total packets | Discarded packets |
| A | 0 | 13 | 0 |
| B | 0 | 13 | 0 |
| C | 0 | 13 | 0 |
| D | 0 | 13 | 0 |
| Mode SS | |||
|---|---|---|---|
| Quadrant | BADHDUFLAG | Total packets | Discarded packets |
| A | 0 | 124 | 0 |
| B | 0 | 124 | 0 |
| C | 0 | 124 | 0 |
| D | 0 | 124 | 0 |
| Mode M0 | |||
|---|---|---|---|
| Quadrant | BADHDUFLAG | Total packets | Discarded packets |
| A | 0 | 13078 | 2 |
| B | 0 | 14784 | 1 |
| C | 0 | 15617 | 1 |
| D | 0 | 13152 | 1 |
| Quadrant | Total seconds | Saturated seconds | Saturation percentage |
|---|---|---|---|
| A | 6161 | 60 | 0.973868% |
| B | 6161 | 63 | 1.022561% |
| C | 6161 | 210 | 3.408538% |
| D | 6161 | 59 | 0.957637% |
Noise dominated data is calculated using 1-second bins in cleaned event files. If a bin has >2000 counts, and if more than 50% of those come from <1% of pixels, then it is considered to be noise-dominated and hence unusable.
| Quadrant | # 1 sec bins | Bins with >0 counts | Bins with >2000 counts | High rate bins dominated by noise | Noise dominated (total time) | Noise dominated (detector-on time) | Marked lightcurve |
|---|---|---|---|---|---|---|---|
| A | 7486 | 6162 | 0 | 0 | 0.00% | 0.00% | 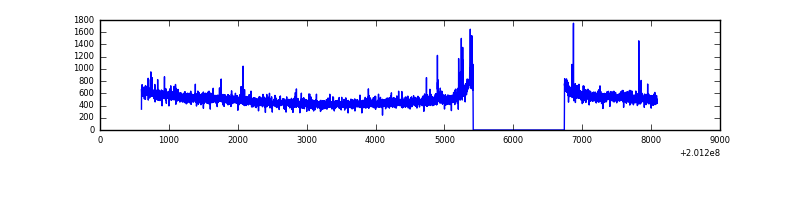 |
| B | 7486 | 6162 | 7 | 7 | 0.09% | 0.11% | 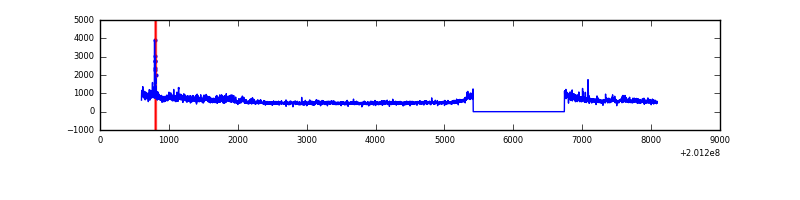 |
| C | 7486 | 6162 | 133 | 133 | 1.78% | 2.16% | 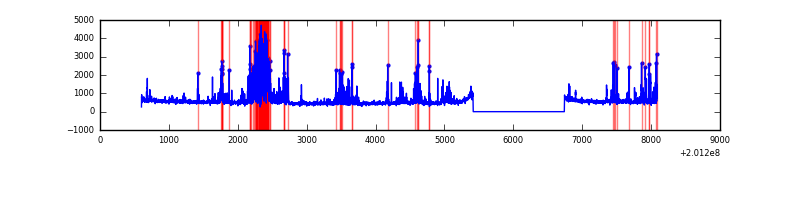 |
| D | 7486 | 6162 | 13 | 13 | 0.17% | 0.21% | 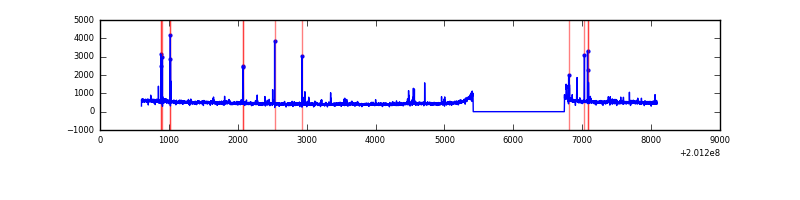 |
Top three noisy pixels from each quadrant. If the there are fewer than three noisy pixels in the level2.evt file, extra rows are filled as -1
| Pixel properties | Quadrant properties | ||||||
|---|---|---|---|---|---|---|---|
| Quadrant | DetID | PixID | Counts | Sigma | Mean | Median | Sigma |
| A | 0 | 50 | 32146 | 196.28 | 787 | 774 | 159.8 |
| A | 8 | 15 | 14270 | 84.44 | 787 | 774 | 159.8 |
| A | 3 | 1 | 14211 | 84.07 | 787 | 774 | 159.8 |
| B | 15 | 204 | 399676 | 2625.85 | 801 | 787 | 151.9 |
| B | 15 | 85 | 37423 | 241.17 | 801 | 787 | 151.9 |
| B | 14 | 167 | 26502 | 169.28 | 801 | 787 | 151.9 |
| C | 7 | 220 | 865496 | 4843.0 | 772 | 780 | 178.5 |
| C | 9 | 144 | 19965 | 107.45 | 772 | 780 | 178.5 |
| C | 14 | 48 | 8227 | 41.71 | 772 | 780 | 178.5 |
| D | 13 | 223 | 54766 | 289.91 | 770 | 751 | 186.3 |
| D | 10 | 172 | 20312 | 104.99 | 770 | 751 | 186.3 |
| D | 1 | 31 | 19765 | 102.05 | 770 | 751 | 186.3 |
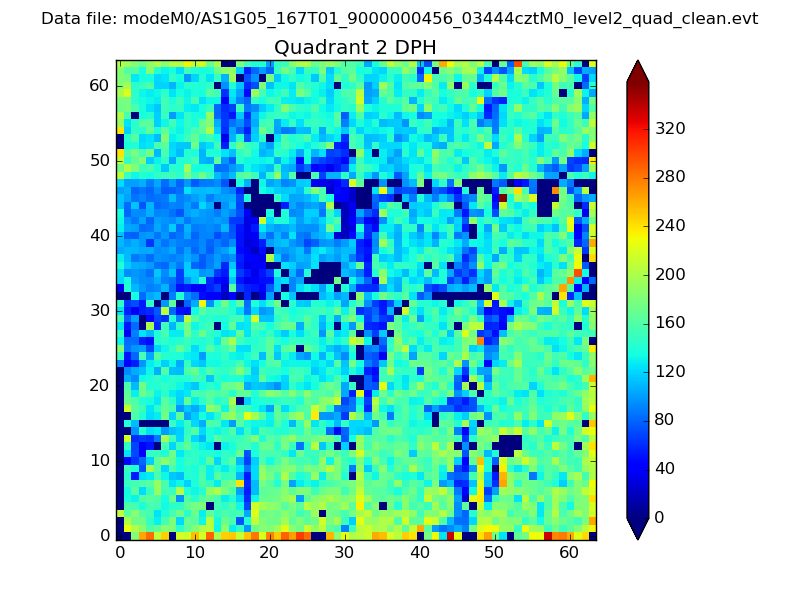
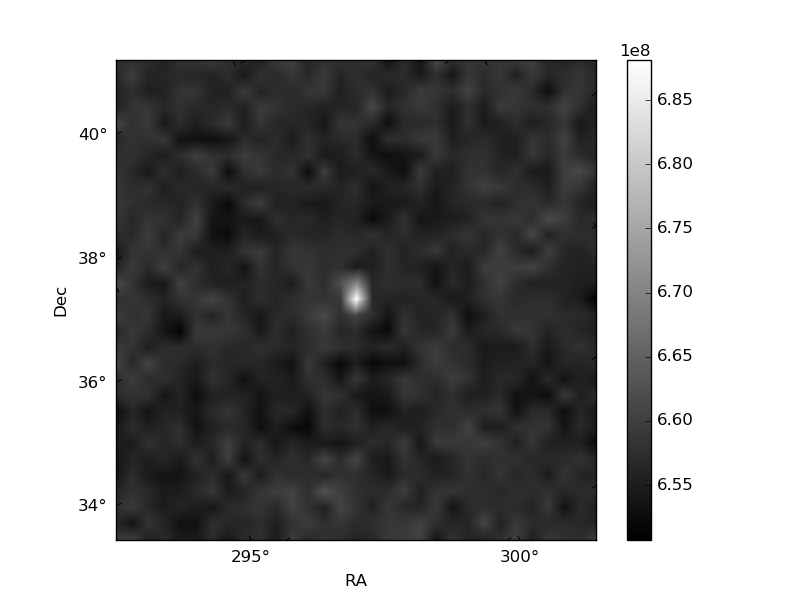
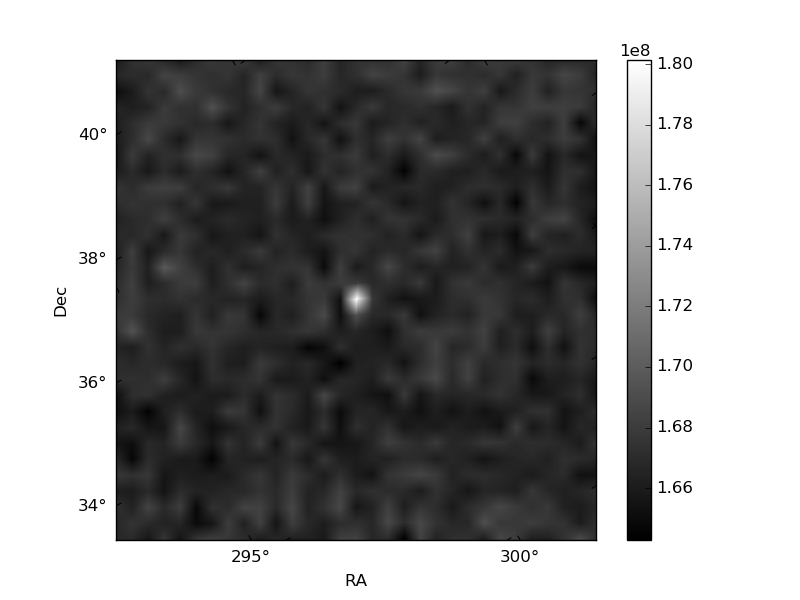
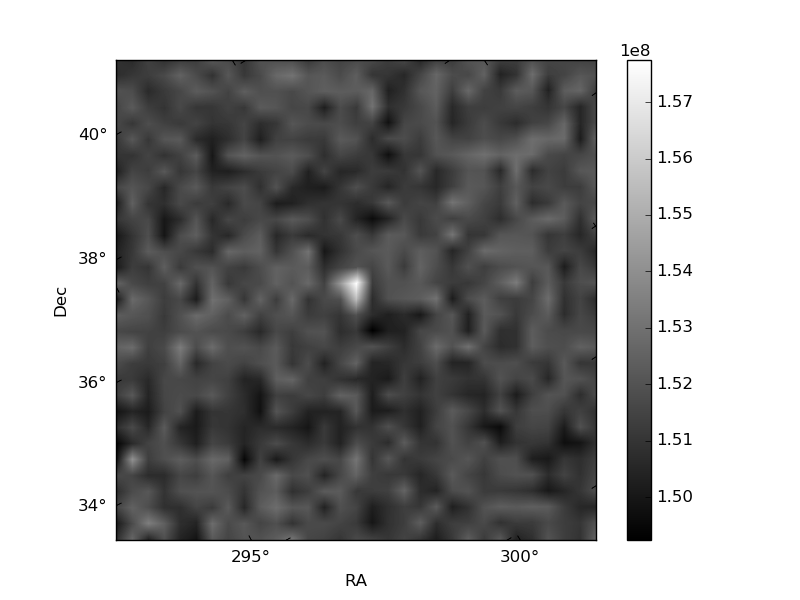
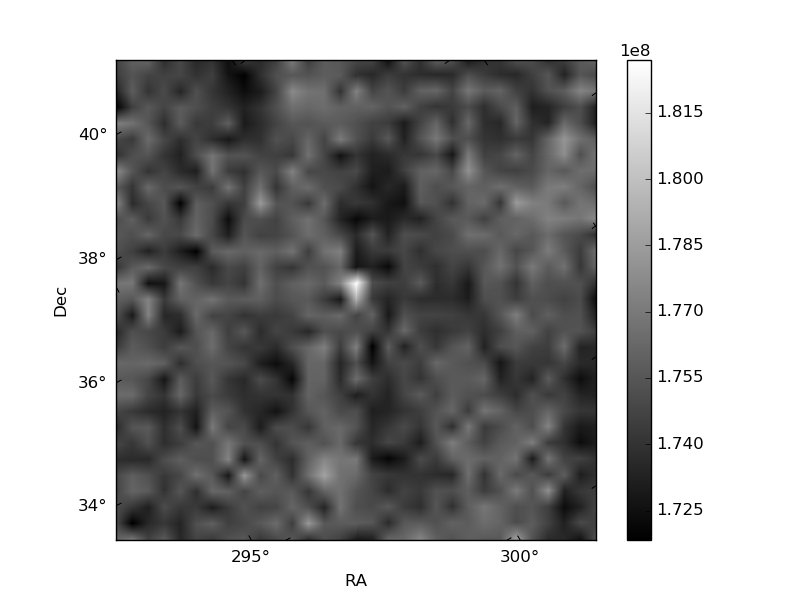
Histogram calculated using DETX and DETY for each event in the final _common_clean file
| Quadrant A | 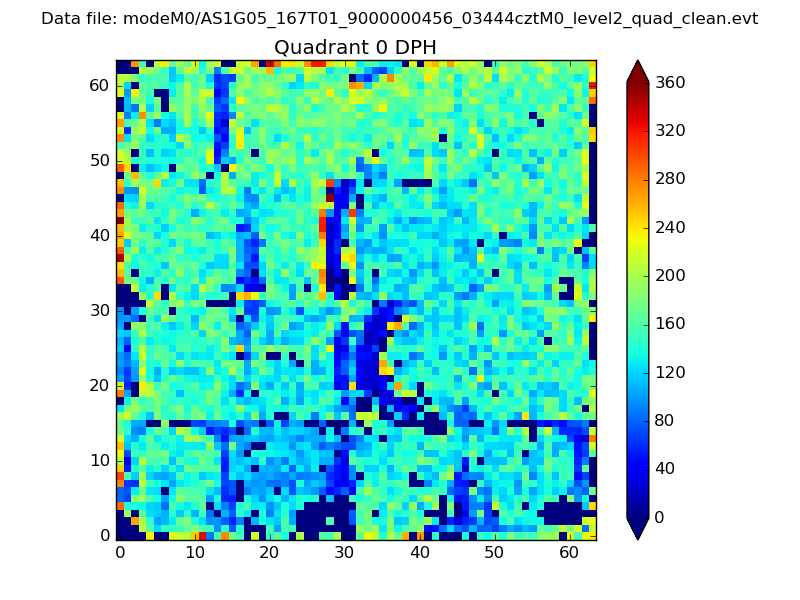 |
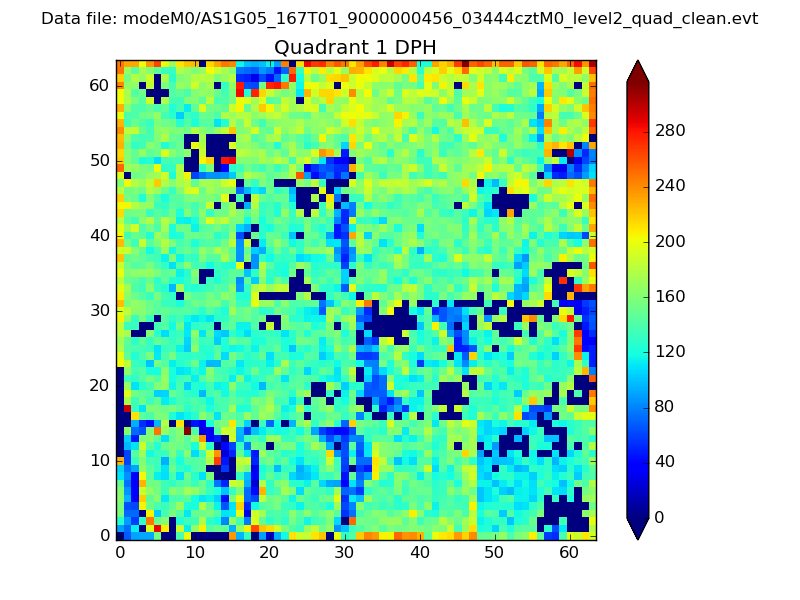 |
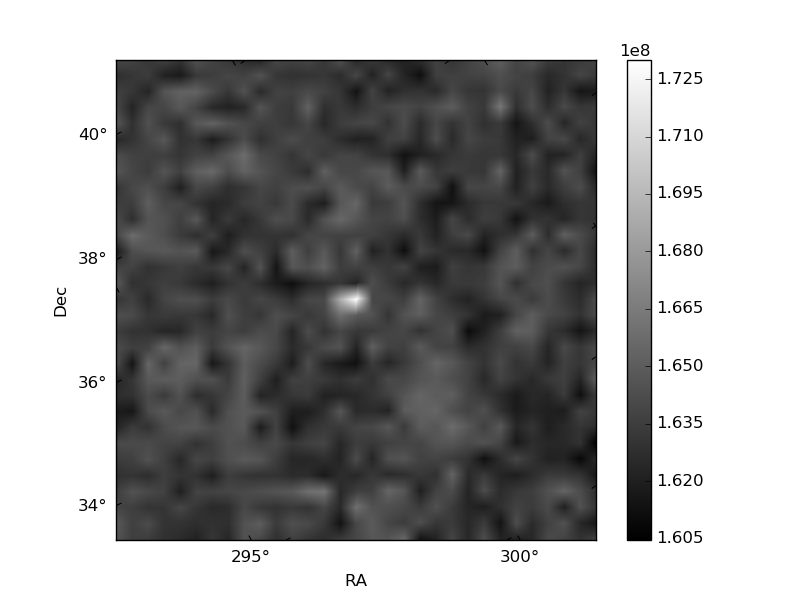
Quadrant B |
|---|---|---|---|
| Quadrant D | 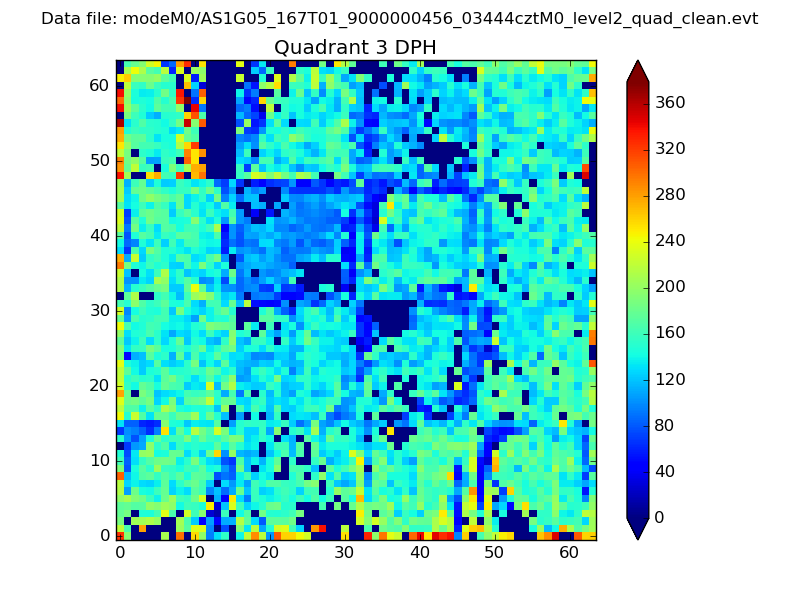 |
 |
Quadrant C |
| Plot type | Count rate plots | Images |
|---|---|---|
| Comparison with Poisson distribution Blue bars denote a histogram of data divided into 1 sec bins. Red curve is a Poisson curve with rate = median count rate of data. |
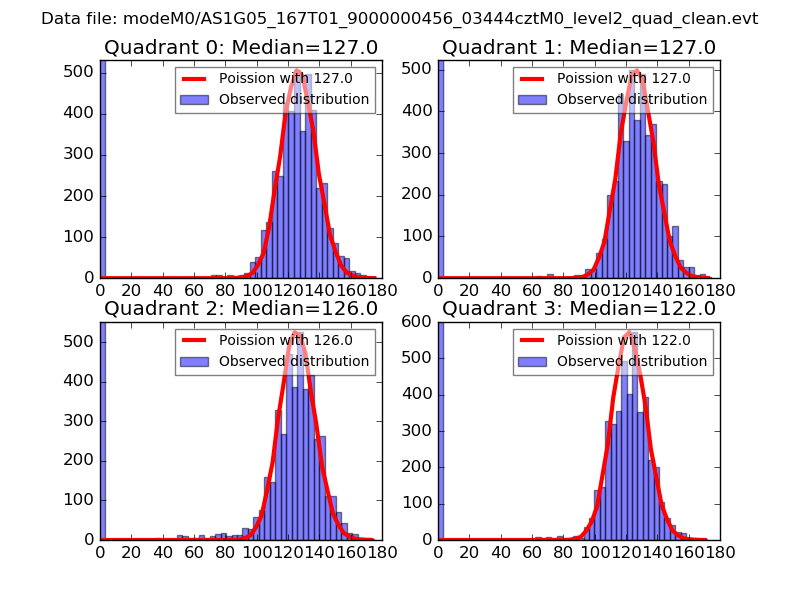 |
 |
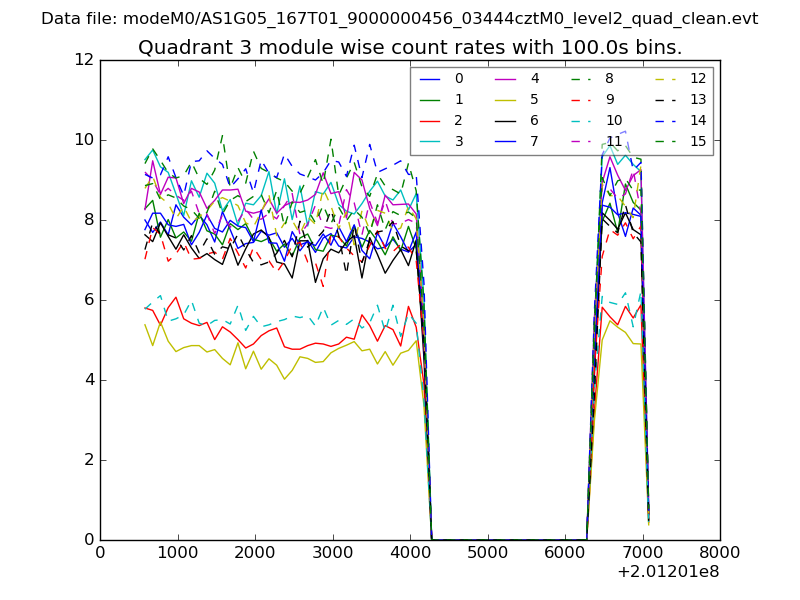
| Quadrant-wise count rates Data is divided into 100 sec bins |
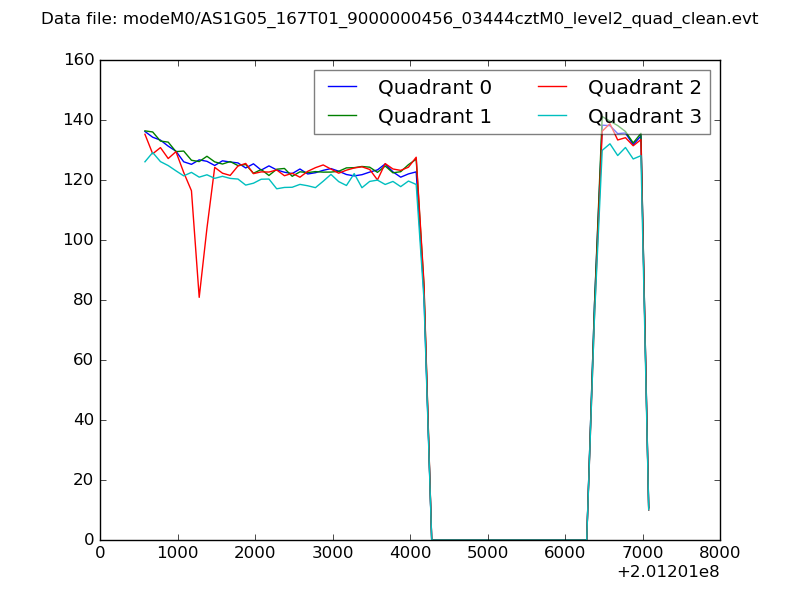 |
|
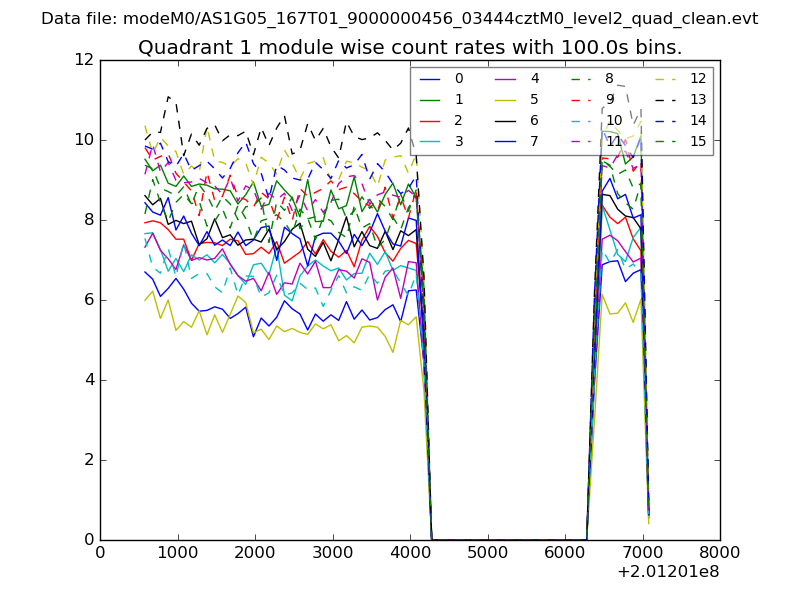
| Module-wise count rates for Quadrant A Data is divided into 100 sec bins |
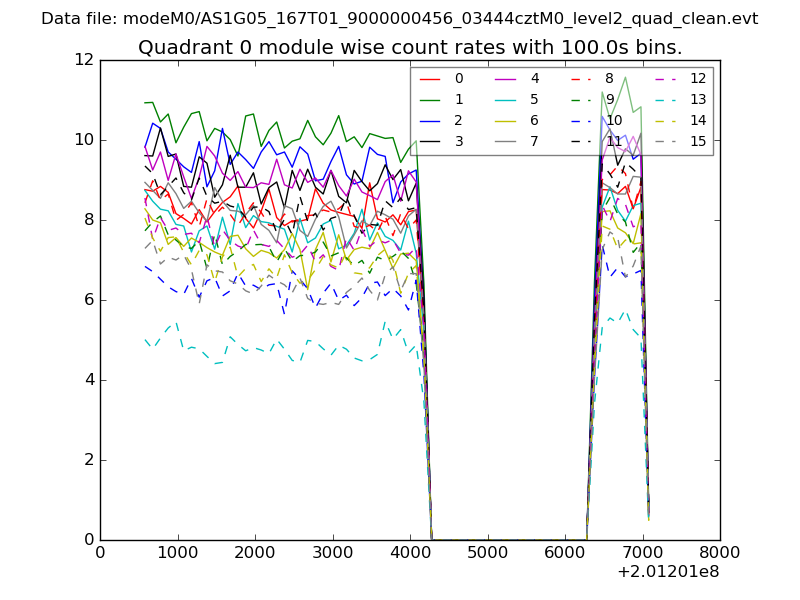 |
 |
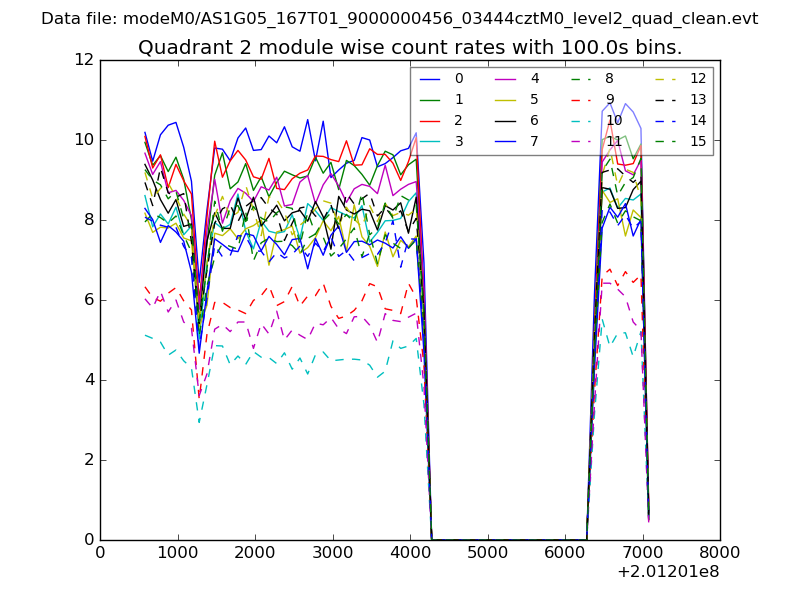
| Module-wise count rates for Quadrant B Data is divided into 100 sec bins |
 |
 |
| Module-wise count rates for Quadrant C Data is divided into 100 sec bins |
 |
 |
| Module-wise count rates for Quadrant D Data is divided into 100 sec bins |
 |
 |
| Parameter | Plot |
|---|---|
| CZT HV Monitor | 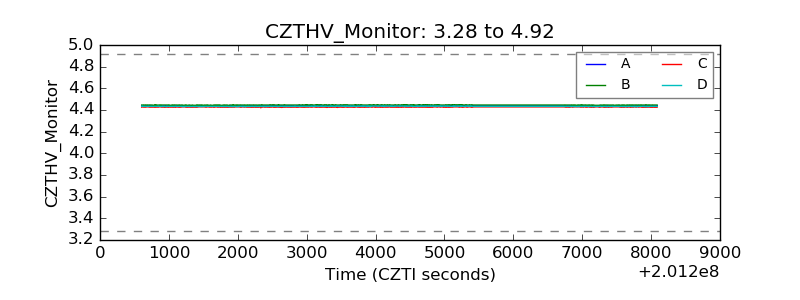 |
| D_VDD | 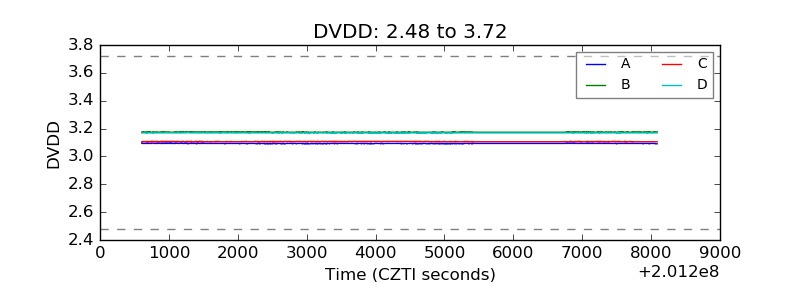 |
| Temperature 1 | 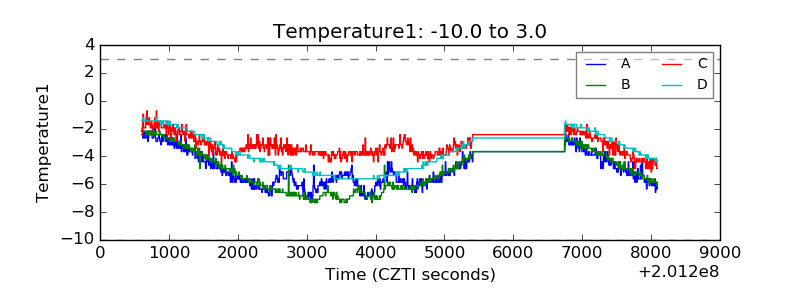 |
| Veto HV Monitor | 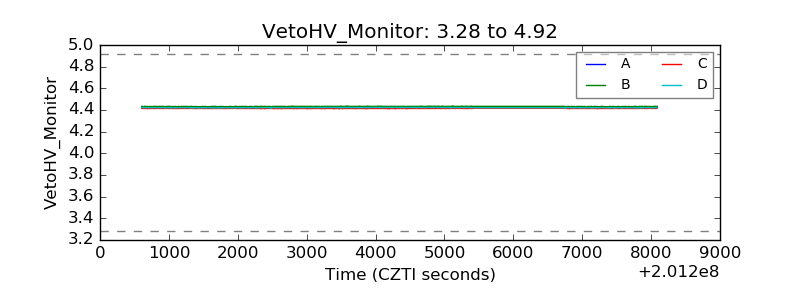 |
| Veto LLD | 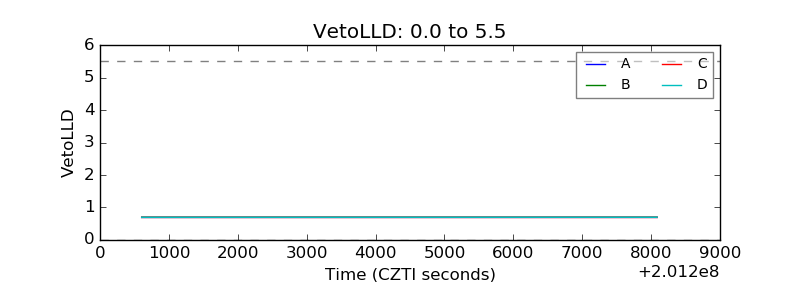 |
| Alpha Counter | 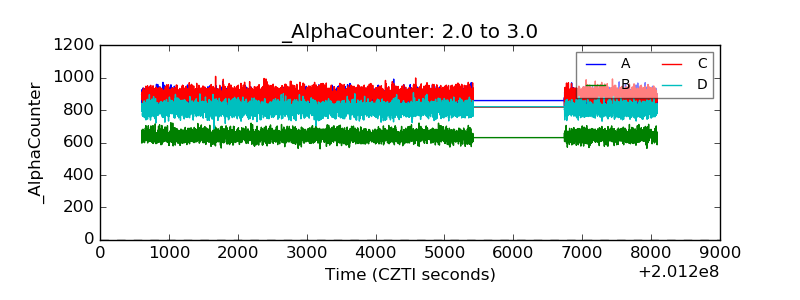 |
| _CPM_Rate | 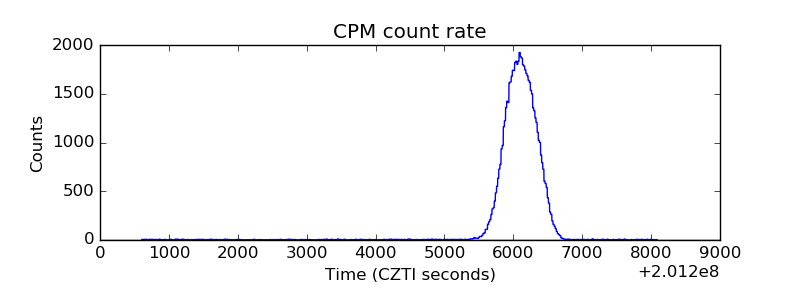 |
| CZT Counter | 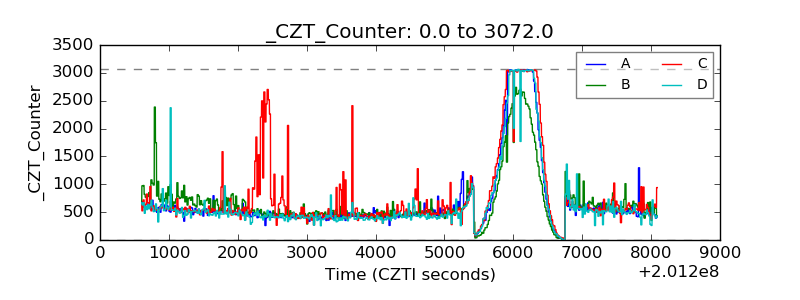 |
| +2.5 Volts monitor |  |
| +5 Volts monitor |  |
| _ROLL_ROT | 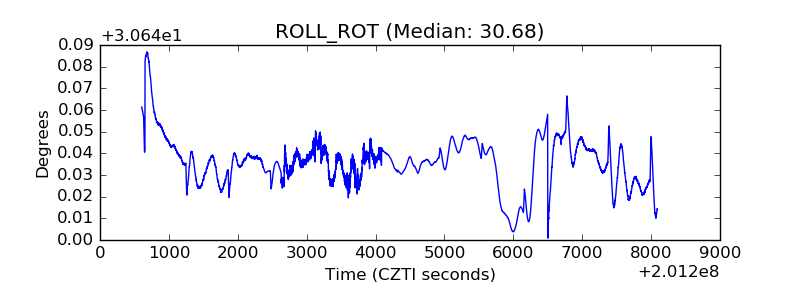 |
| _Roll_DEC | 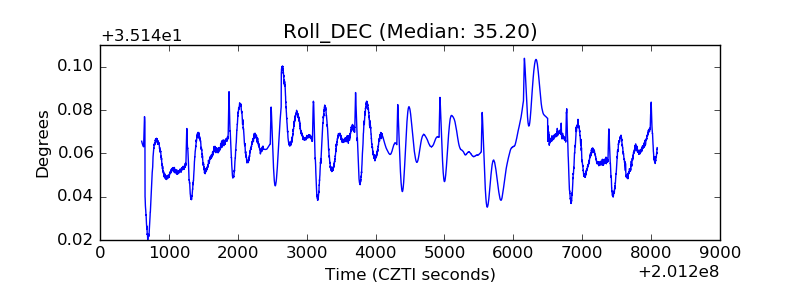 |
| _Roll_RA | 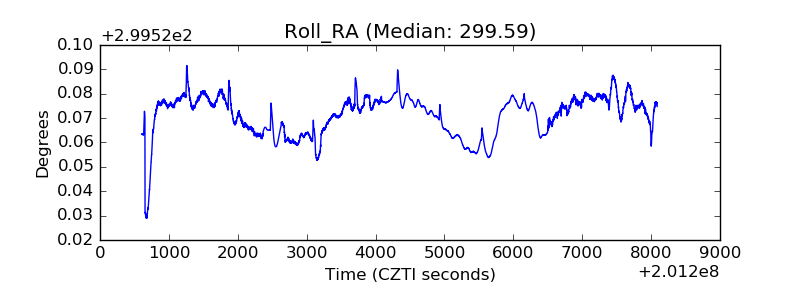 |
| Veto Counter | 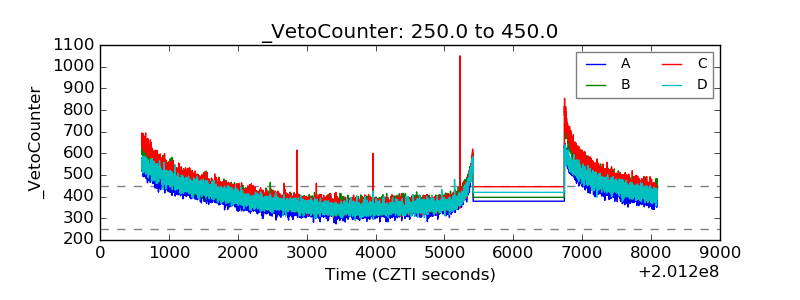 |