| Param | Original file | Final file |
|---|---|---|
| Filename | modeM0/AS1G05_167T01_9000000456_03445cztM0_level2.evt | modeM0/AS1G05_167T01_9000000456_03445cztM0_level2_quad_clean.evt |
| Size (bytes) | 442,627,200 | 90,060,480 |
| Size | 422.1 MB | 85.9 MB |
| Events in quadrant A | 2,845,332 | 588,303 |
| Events in quadrant B | 3,247,408 | 591,777 |
| Events in quadrant C | 3,972,441 | 571,078 |
| Events in quadrant D | 2,940,120 | 565,148 |
| Mode M9 | |||
|---|---|---|---|
| Quadrant | BADHDUFLAG | Total packets | Discarded packets |
| A | 0 | 14 | 0 |
| B | 0 | 14 | 0 |
| C | 0 | 14 | 0 |
| D | 0 | 14 | 0 |
| Mode SS | |||
|---|---|---|---|
| Quadrant | BADHDUFLAG | Total packets | Discarded packets |
| A | 0 | 120 | 0 |
| B | 0 | 120 | 0 |
| C | 0 | 120 | 0 |
| D | 0 | 120 | 0 |
| Mode M0 | |||
|---|---|---|---|
| Quadrant | BADHDUFLAG | Total packets | Discarded packets |
| A | 0 | 12225 | 2 |
| B | 0 | 13435 | 1 |
| C | 0 | 15495 | 1 |
| D | 0 | 12731 | 1 |
| Quadrant | Total seconds | Saturated seconds | Saturation percentage |
|---|---|---|---|
| A | 5888 | 33 | 0.560462% |
| B | 5888 | 62 | 1.052989% |
| C | 5888 | 329 | 5.587636% |
| D | 5888 | 72 | 1.222826% |
Noise dominated data is calculated using 1-second bins in cleaned event files. If a bin has >2000 counts, and if more than 50% of those come from <1% of pixels, then it is considered to be noise-dominated and hence unusable.
| Quadrant | # 1 sec bins | Bins with >0 counts | Bins with >2000 counts | High rate bins dominated by noise | Noise dominated (total time) | Noise dominated (detector-on time) | Marked lightcurve |
|---|---|---|---|---|---|---|---|
| A | 7233 | 5890 | 0 | 0 | 0.00% | 0.00% | 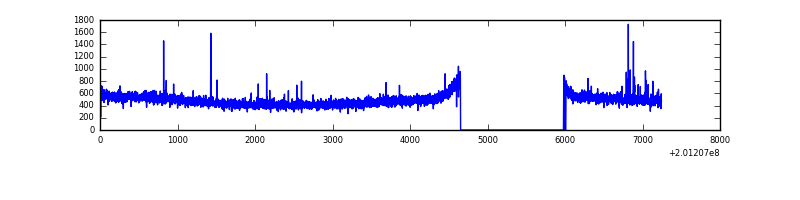 |
| B | 7233 | 5890 | 2 | 2 | 0.03% | 0.03% | 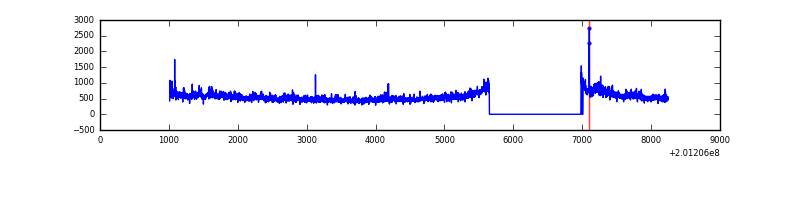 |
| C | 7233 | 5890 | 232 | 232 | 3.21% | 3.94% | 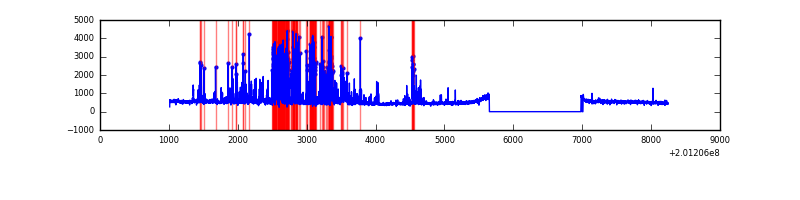 |
| D | 7233 | 5890 | 38 | 38 | 0.53% | 0.65% | 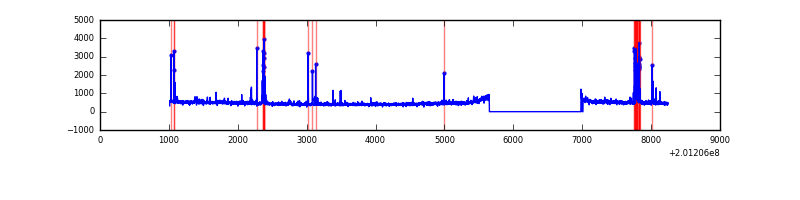 |
Top three noisy pixels from each quadrant. If the there are fewer than three noisy pixels in the level2.evt file, extra rows are filled as -1
| Pixel properties | Quadrant properties | ||||||
|---|---|---|---|---|---|---|---|
| Quadrant | DetID | PixID | Counts | Sigma | Mean | Median | Sigma |
| A | 0 | 31 | 21492 | 138.68 | 731 | 718 | 149.8 |
| A | 12 | 194 | 7609 | 46.0 | 731 | 718 | 149.8 |
| A | 0 | 226 | 7324 | 44.1 | 731 | 718 | 149.8 |
| B | 15 | 204 | 322651 | 2267.59 | 746 | 733 | 142.0 |
| B | 0 | 229 | 14755 | 98.77 | 746 | 733 | 142.0 |
| B | 15 | 255 | 13838 | 92.31 | 746 | 733 | 142.0 |
| C | 7 | 220 | 1166155 | 7079.08 | 713 | 721 | 164.6 |
| C | 13 | 61 | 6098 | 32.66 | 713 | 721 | 164.6 |
| C | 1 | 192 | 5756 | 30.58 | 713 | 721 | 164.6 |
| D | 13 | 223 | 171420 | 993.22 | 714 | 696 | 171.9 |
| D | 5 | 233 | 16780 | 93.57 | 714 | 696 | 171.9 |
| D | 9 | 85 | 12366 | 67.89 | 714 | 696 | 171.9 |
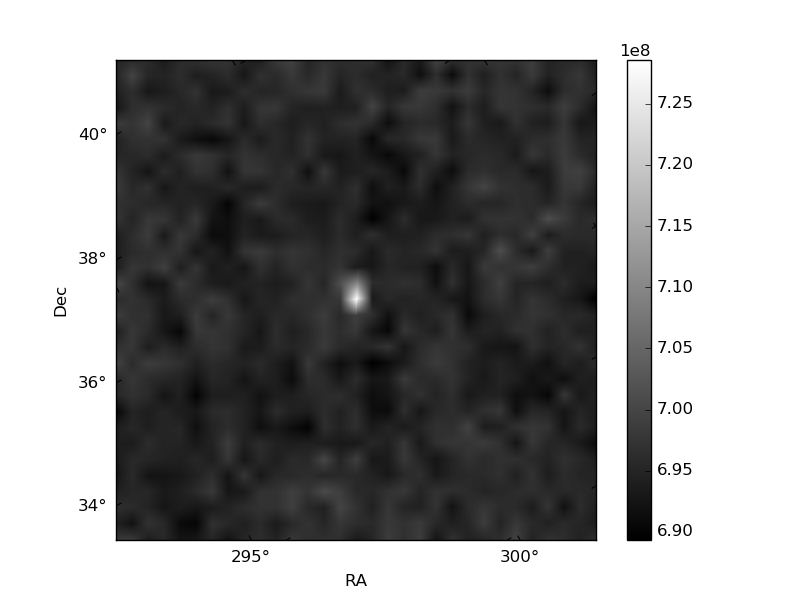
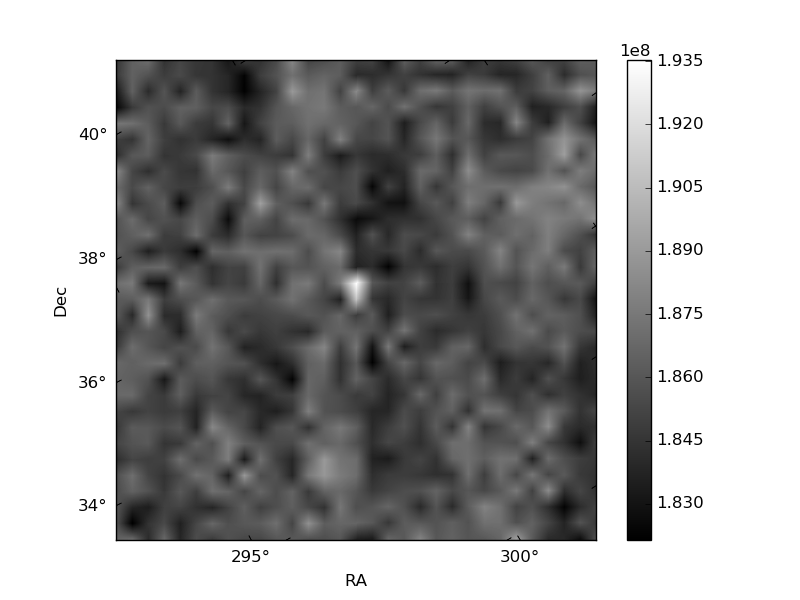
Histogram calculated using DETX and DETY for each event in the final _common_clean file
| Quadrant A | 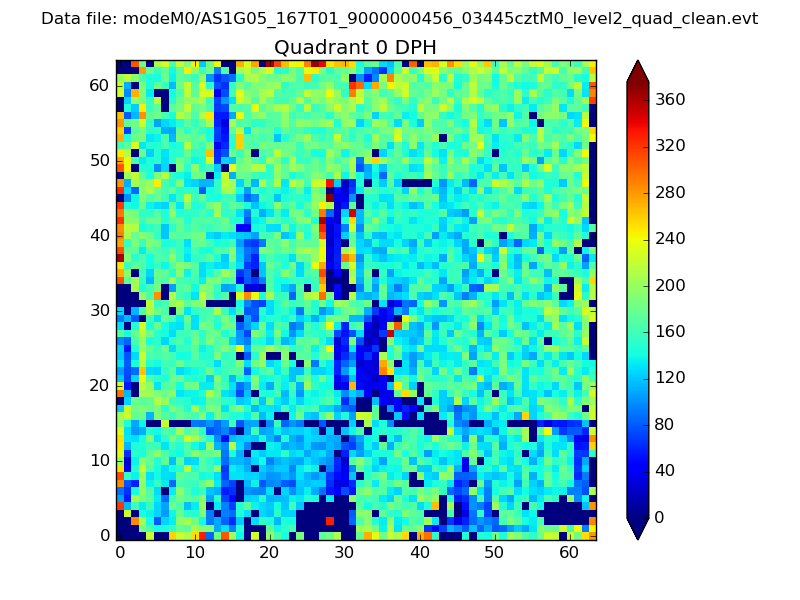 |
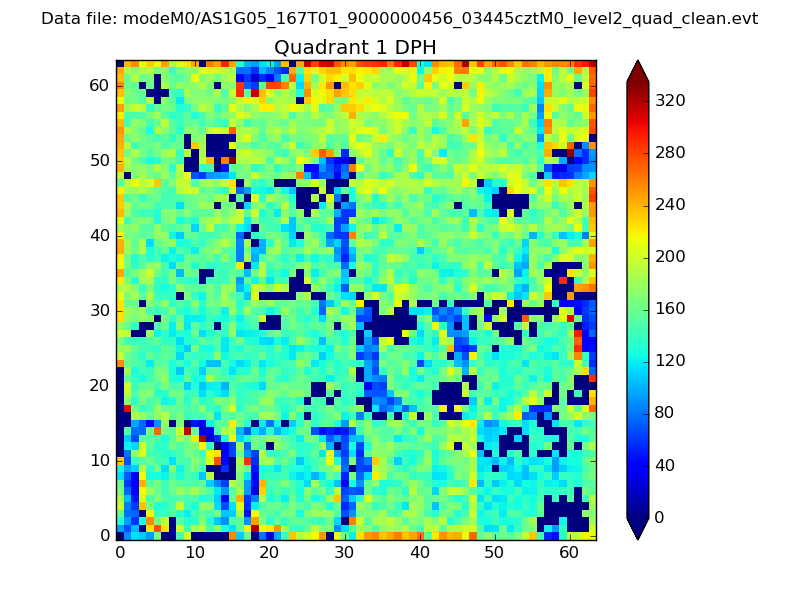 |
Quadrant B |
|---|---|---|---|
| Quadrant D | 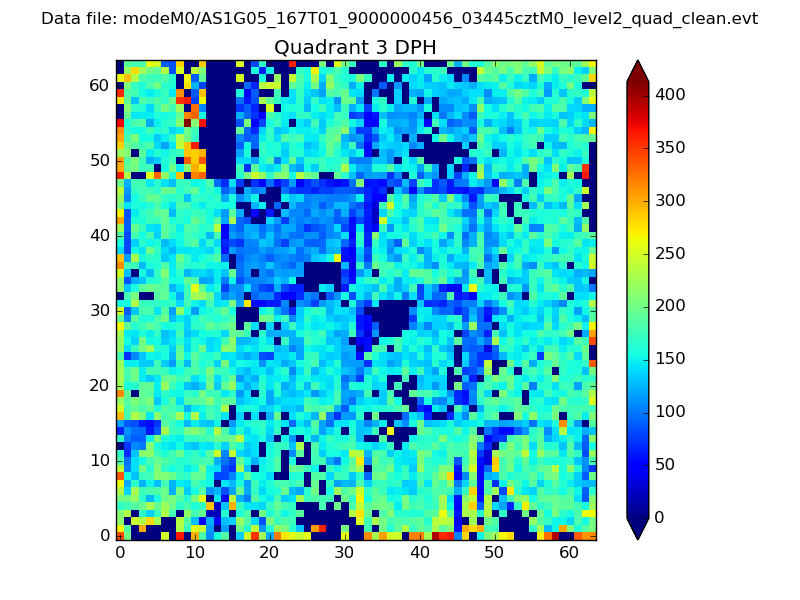 |
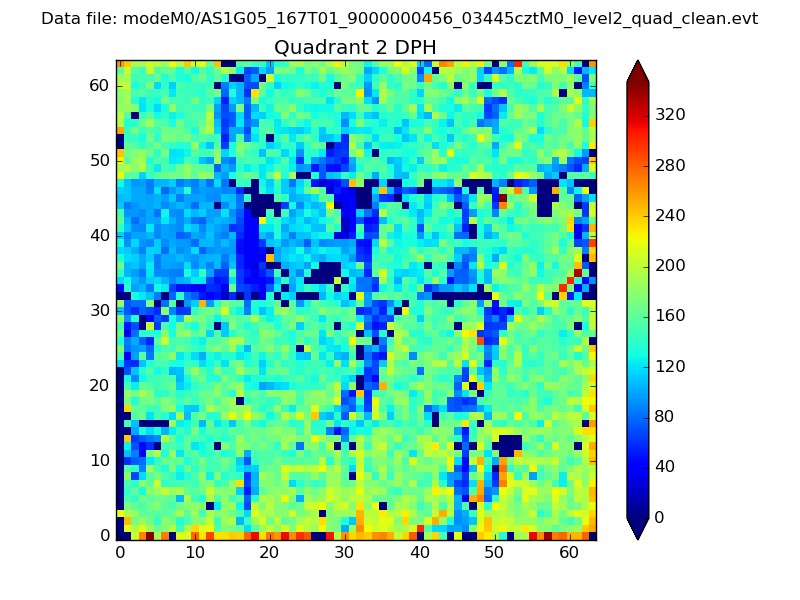 |
Quadrant C |
| Plot type | Count rate plots | Images |
|---|---|---|
| Comparison with Poisson distribution Blue bars denote a histogram of data divided into 1 sec bins. Red curve is a Poisson curve with rate = median count rate of data. |
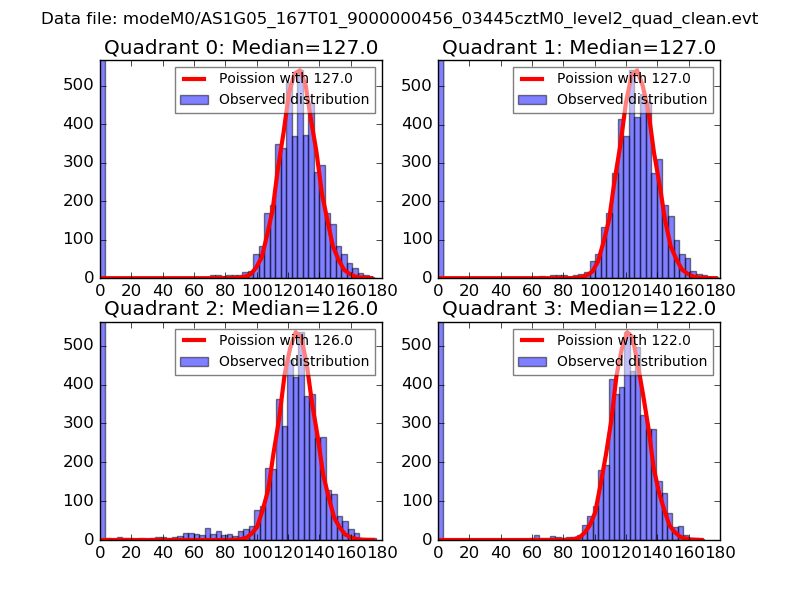 |
 |
| Quadrant-wise count rates Data is divided into 100 sec bins |
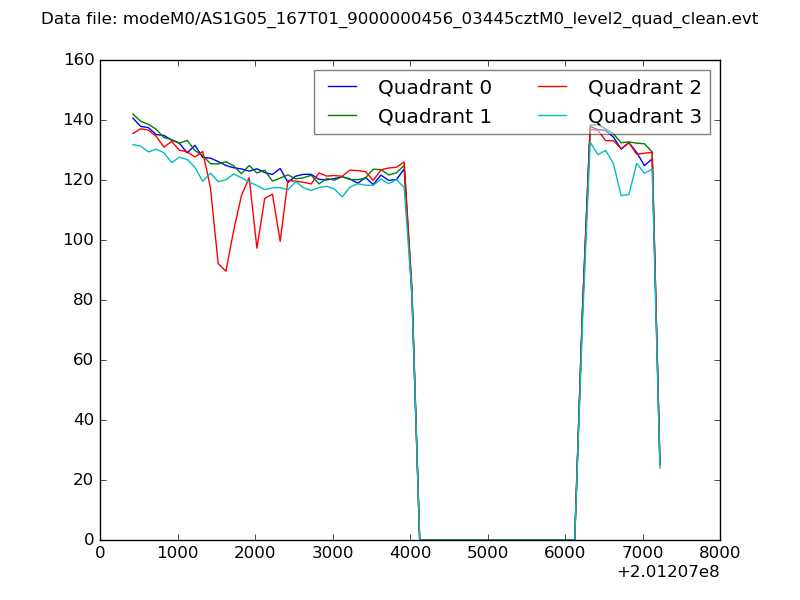 |
|
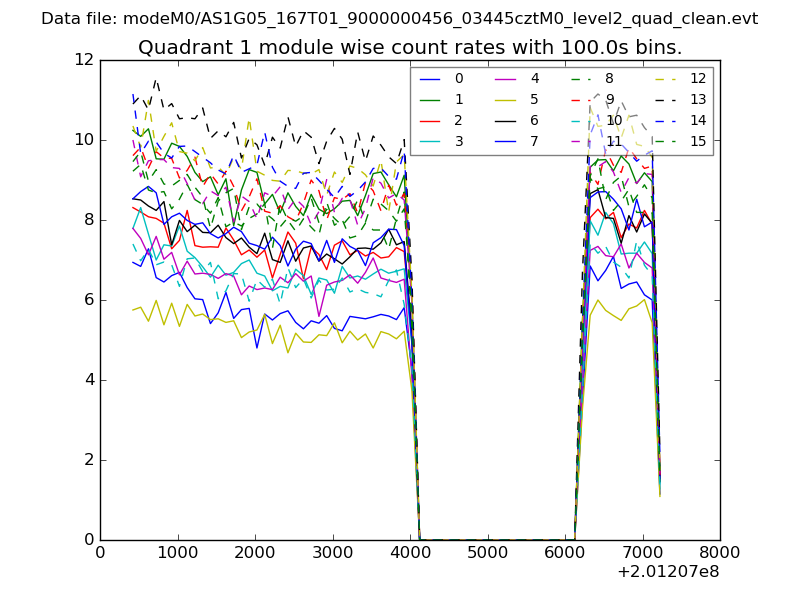
| Module-wise count rates for Quadrant A Data is divided into 100 sec bins |
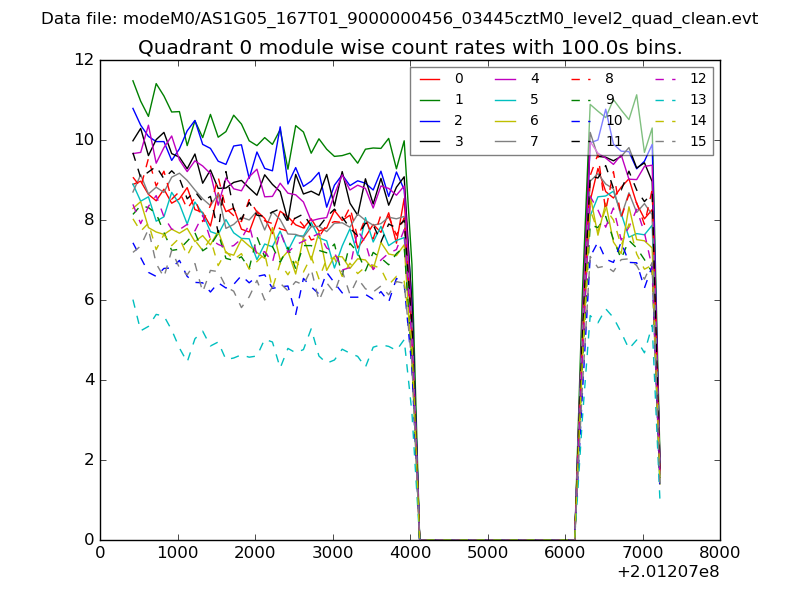 |
 |
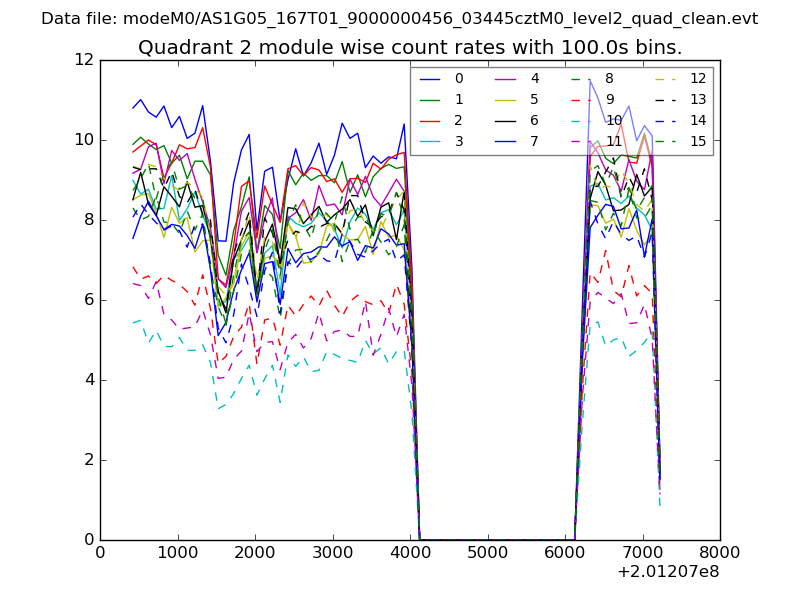
| Module-wise count rates for Quadrant B Data is divided into 100 sec bins |
 |
 |
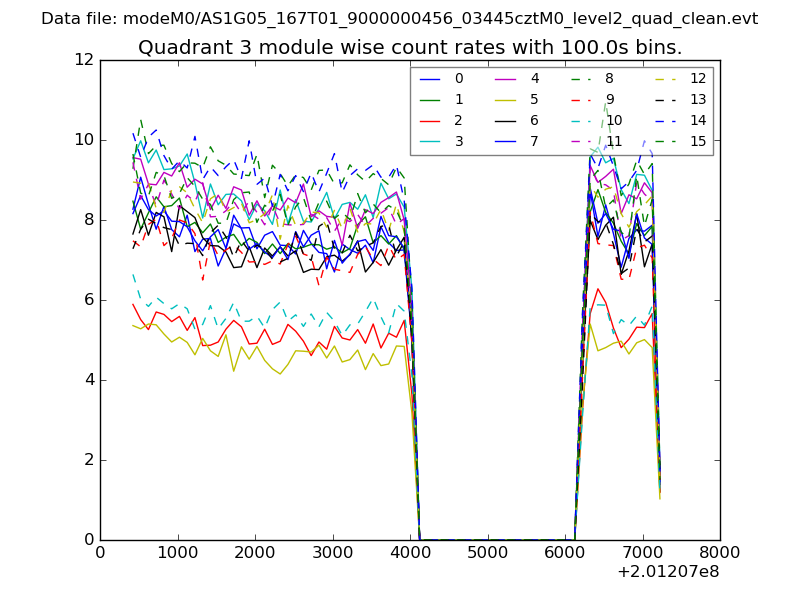
| Module-wise count rates for Quadrant C Data is divided into 100 sec bins |
 |
 |
| Module-wise count rates for Quadrant D Data is divided into 100 sec bins |
 |
 |
| Parameter | Plot |
|---|---|
| CZT HV Monitor |  |
| D_VDD |  |
| Temperature 1 | 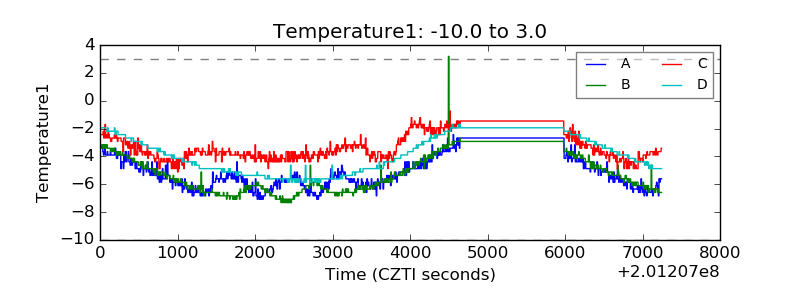 |
| Veto HV Monitor | 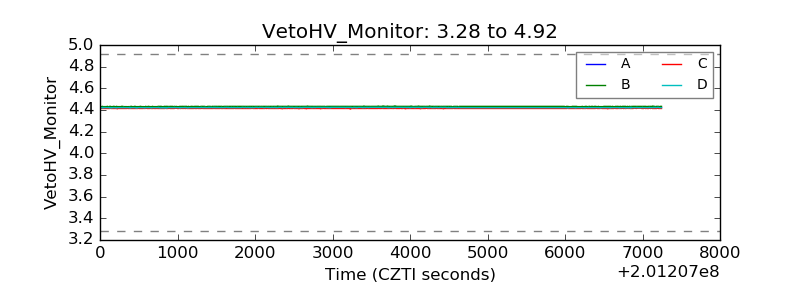 |
| Veto LLD | 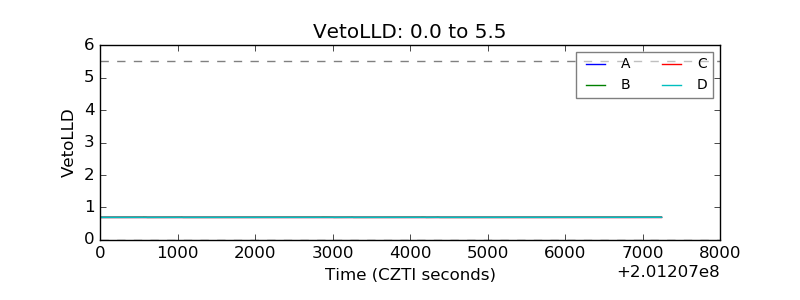 |
| Alpha Counter | 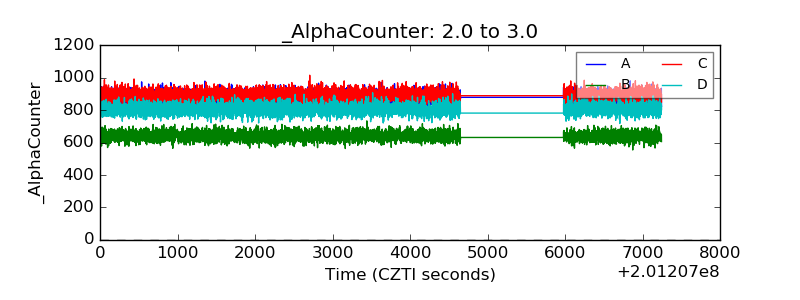 |
| _CPM_Rate | 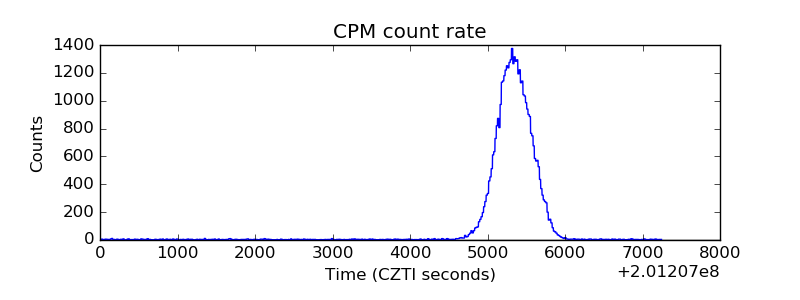 |
| CZT Counter | 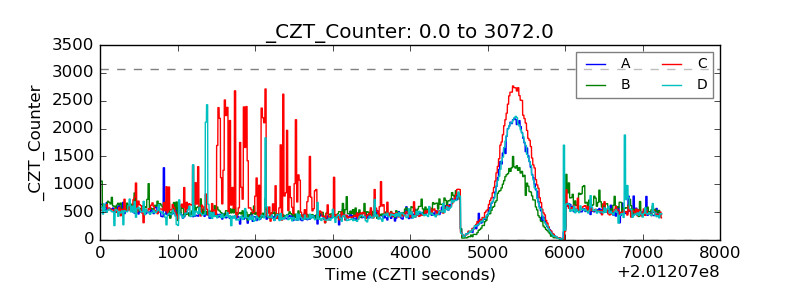 |
| +2.5 Volts monitor |  |
| +5 Volts monitor |  |
| _ROLL_ROT | 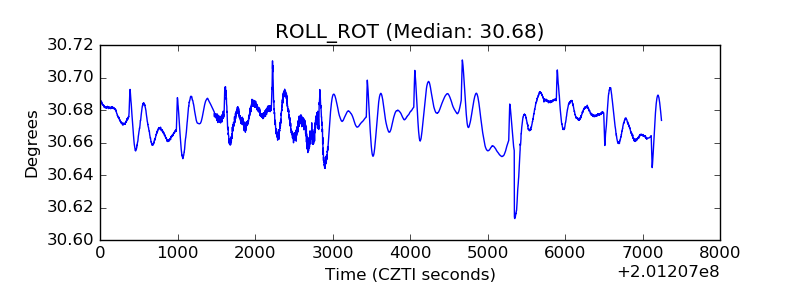 |
| _Roll_DEC | 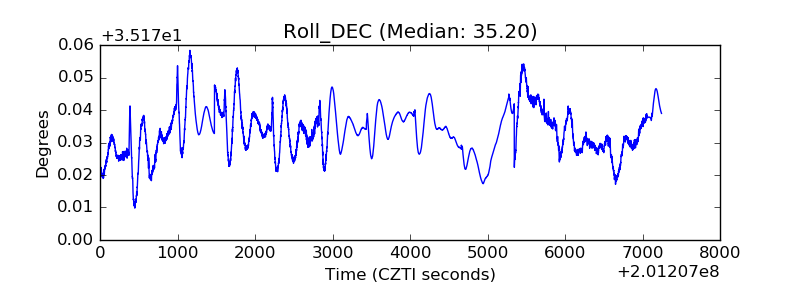 |
| _Roll_RA | 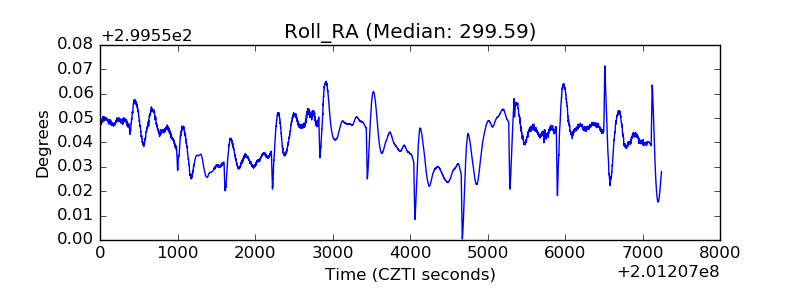 |
| Veto Counter | 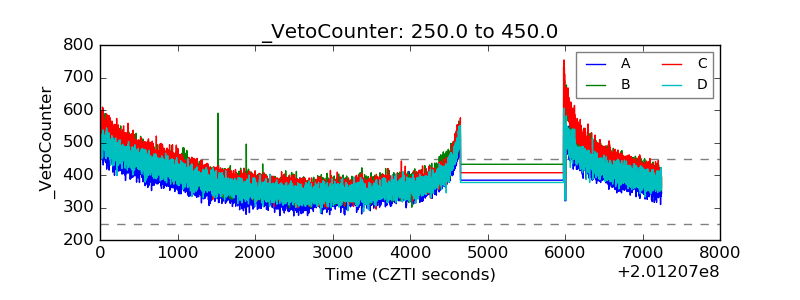 |