| Param | Original file | Final file |
|---|---|---|
| Filename | modeM0/AS1G05_167T01_9000000456_03447cztM0_level2.evt | modeM0/AS1G05_167T01_9000000456_03447cztM0_level2_quad_clean.evt |
| Size (bytes) | 452,764,800 | 94,475,520 |
| Size | 431.8 MB | 90.1 MB |
| Events in quadrant A | 3,209,135 | 600,900 |
| Events in quadrant B | 3,809,151 | 605,085 |
| Events in quadrant C | 3,201,589 | 604,937 |
| Events in quadrant D | 3,033,301 | 579,614 |
| Mode M9 | |||
|---|---|---|---|
| Quadrant | BADHDUFLAG | Total packets | Discarded packets |
| A | 0 | 13 | 0 |
| B | 0 | 13 | 0 |
| C | 0 | 13 | 0 |
| D | 0 | 14 | 0 |
| Mode SS | |||
|---|---|---|---|
| Quadrant | BADHDUFLAG | Total packets | Discarded packets |
| A | 0 | 138 | 0 |
| B | 0 | 138 | 0 |
| C | 0 | 138 | 0 |
| D | 0 | 138 | 0 |
| Mode M0 | |||
|---|---|---|---|
| Quadrant | BADHDUFLAG | Total packets | Discarded packets |
| A | 0 | 14219 | 3 |
| B | 0 | 15781 | 2 |
| C | 0 | 14154 | 2 |
| D | 0 | 14055 | 2 |
| Quadrant | Total seconds | Saturated seconds | Saturation percentage |
|---|---|---|---|
| A | 6748 | 55 | 0.815056% |
| B | 6748 | 94 | 1.393005% |
| C | 6748 | 40 | 0.592768% |
| D | 6748 | 28 | 0.414938% |
Noise dominated data is calculated using 1-second bins in cleaned event files. If a bin has >2000 counts, and if more than 50% of those come from <1% of pixels, then it is considered to be noise-dominated and hence unusable.
| Quadrant | # 1 sec bins | Bins with >0 counts | Bins with >2000 counts | High rate bins dominated by noise | Noise dominated (total time) | Noise dominated (detector-on time) | Marked lightcurve |
|---|---|---|---|---|---|---|---|
| A | 7608 | 6749 | 15 | 15 | 0.20% | 0.22% | 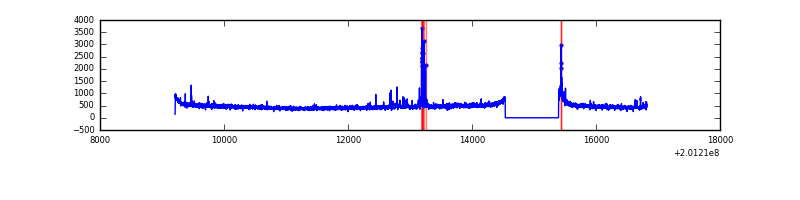 |
| B | 7608 | 6749 | 1 | 1 | 0.01% | 0.01% | 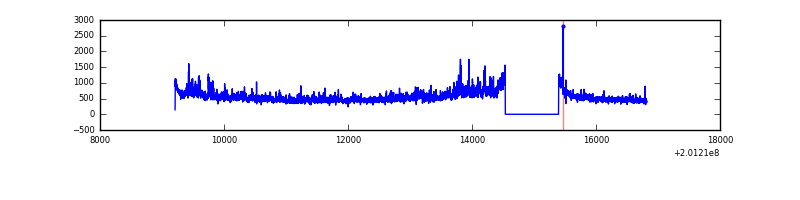 |
| C | 7608 | 6749 | 7 | 7 | 0.09% | 0.10% | 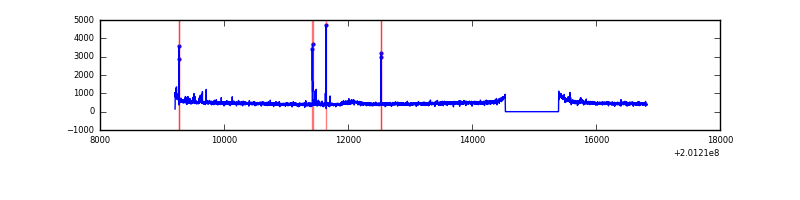 |
| D | 7608 | 6749 | 11 | 11 | 0.14% | 0.16% | 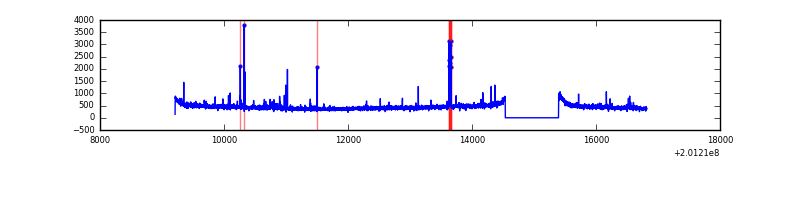 |
Top three noisy pixels from each quadrant. If the there are fewer than three noisy pixels in the level2.evt file, extra rows are filled as -1
| Pixel properties | Quadrant properties | ||||||
|---|---|---|---|---|---|---|---|
| Quadrant | DetID | PixID | Counts | Sigma | Mean | Median | Sigma |
| A | 0 | 50 | 120830 | 728.28 | 800 | 785 | 164.8 |
| A | 0 | 226 | 8322 | 45.72 | 800 | 785 | 164.8 |
| A | 12 | 194 | 8305 | 45.62 | 800 | 785 | 164.8 |
| B | 15 | 204 | 559071 | 3535.68 | 816 | 799 | 157.9 |
| B | 14 | 167 | 38265 | 237.28 | 816 | 799 | 157.9 |
| B | 0 | 229 | 23738 | 145.28 | 816 | 799 | 157.9 |
| C | 1 | 192 | 106601 | 571.58 | 789 | 797 | 185.1 |
| C | 13 | 61 | 6649 | 31.61 | 789 | 797 | 185.1 |
| C | 12 | 4 | 6578 | 31.23 | 789 | 797 | 185.1 |
| D | 13 | 223 | 36034 | 185.98 | 778 | 758 | 189.7 |
| D | 5 | 233 | 20350 | 103.29 | 778 | 758 | 189.7 |
| D | 7 | 223 | 12791 | 63.44 | 778 | 758 | 189.7 |
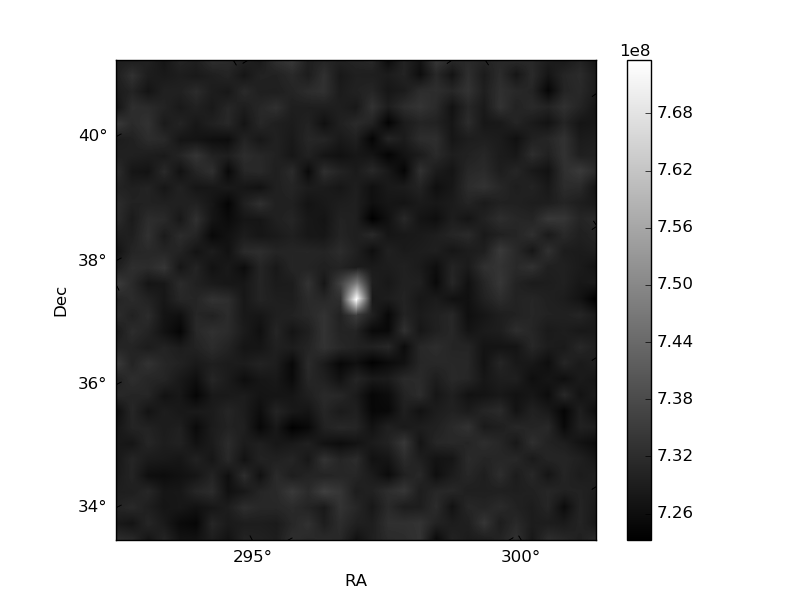
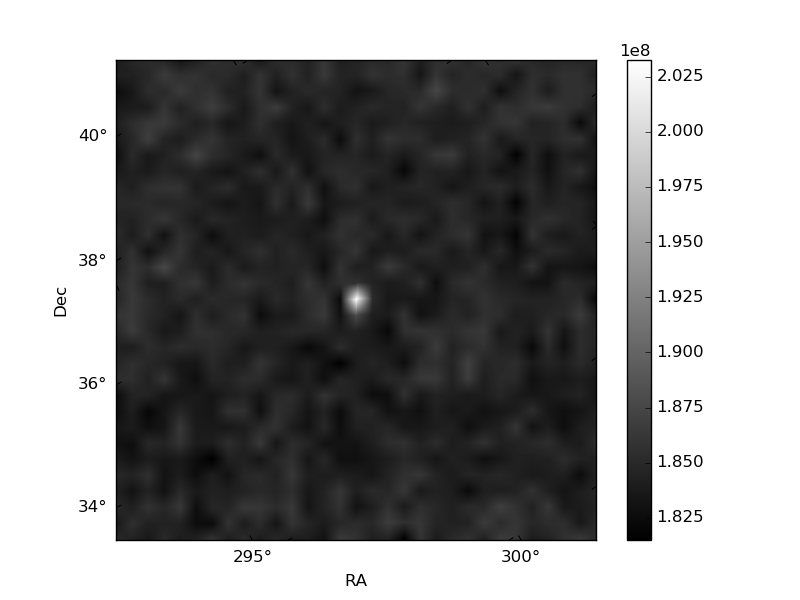
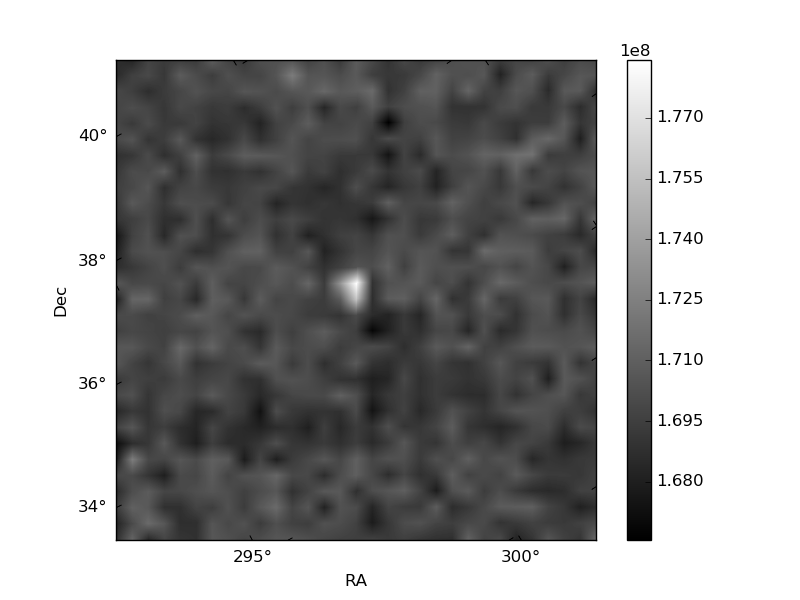
Histogram calculated using DETX and DETY for each event in the final _common_clean file
| Quadrant A | 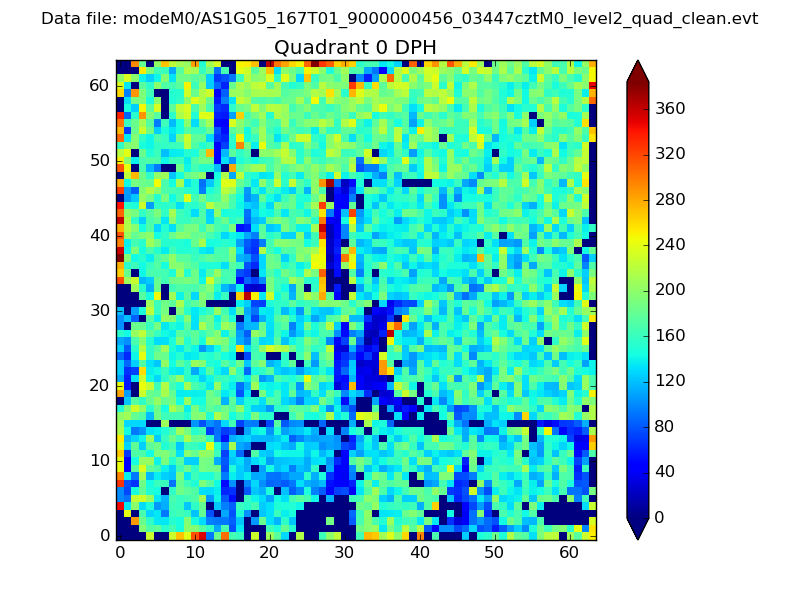 |
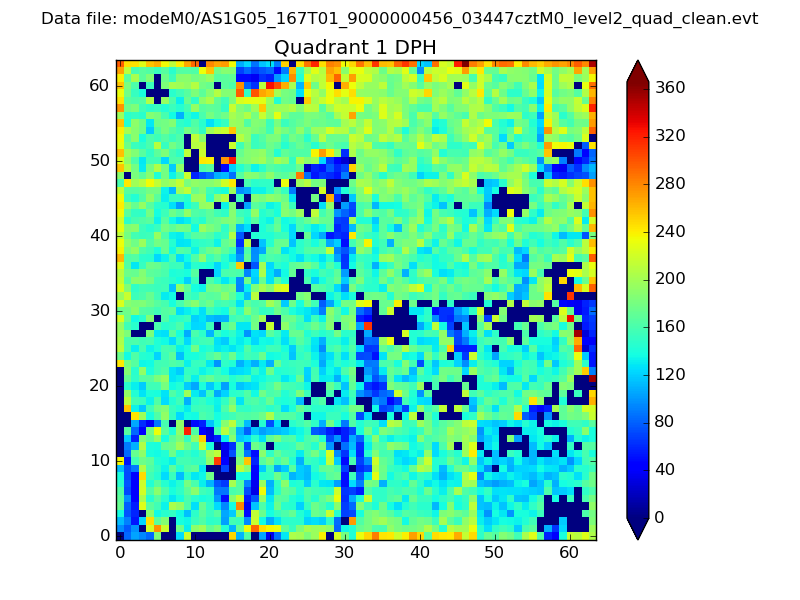 |
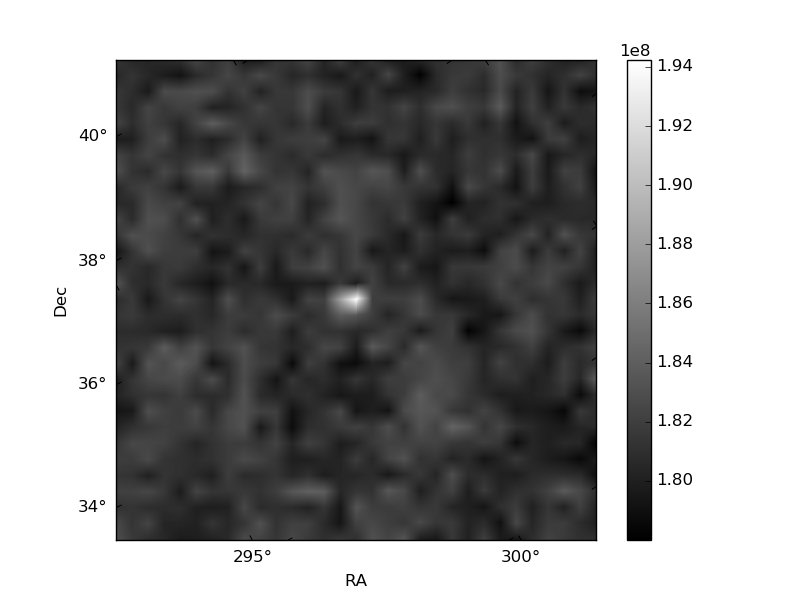
Quadrant B |
|---|---|---|---|
| Quadrant D | 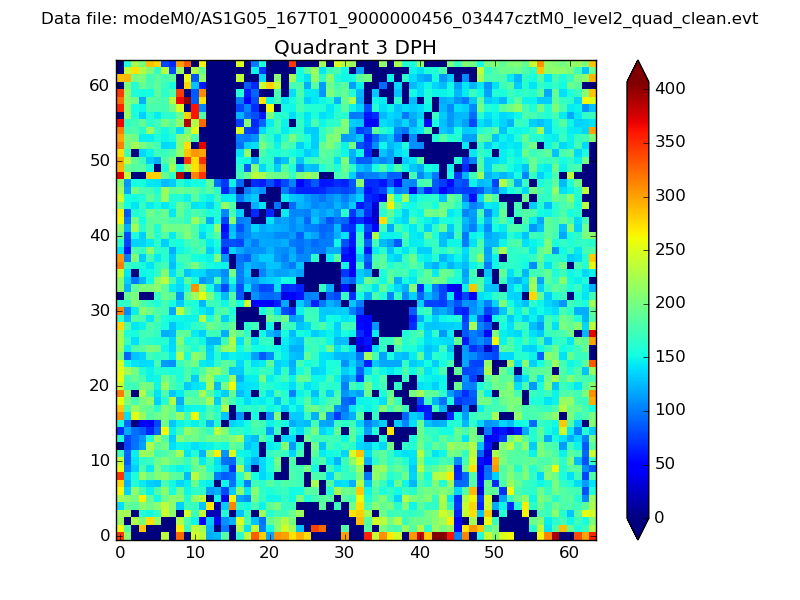 |
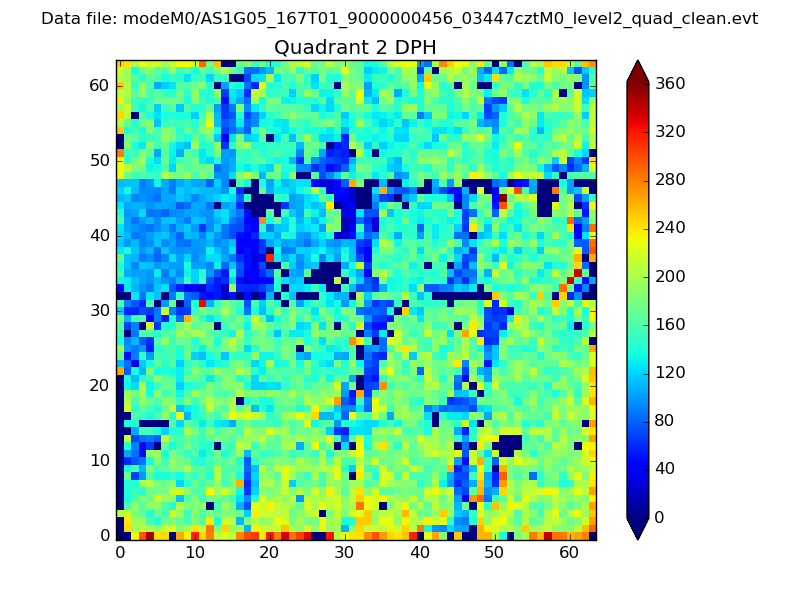 |
Quadrant C |
| Plot type | Count rate plots | Images |
|---|---|---|
| Comparison with Poisson distribution Blue bars denote a histogram of data divided into 1 sec bins. Red curve is a Poisson curve with rate = median count rate of data. |
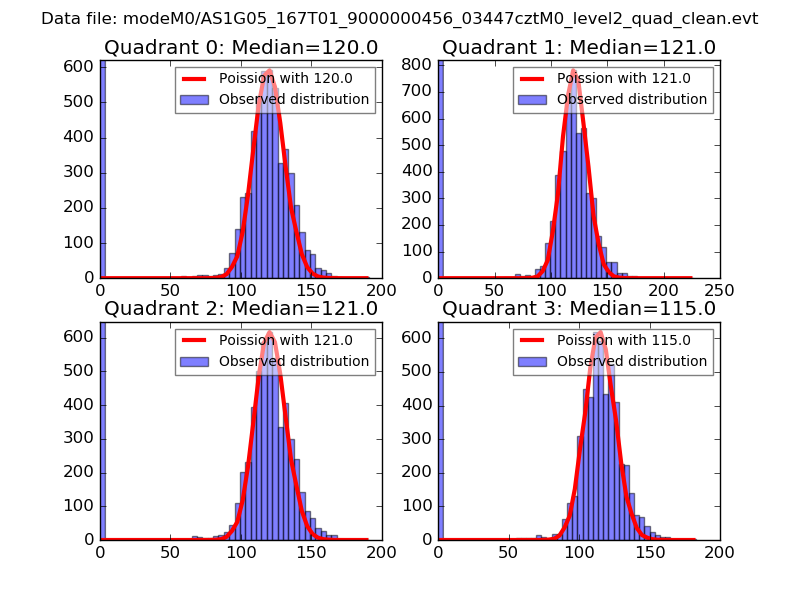 |
 |
| Quadrant-wise count rates Data is divided into 100 sec bins |
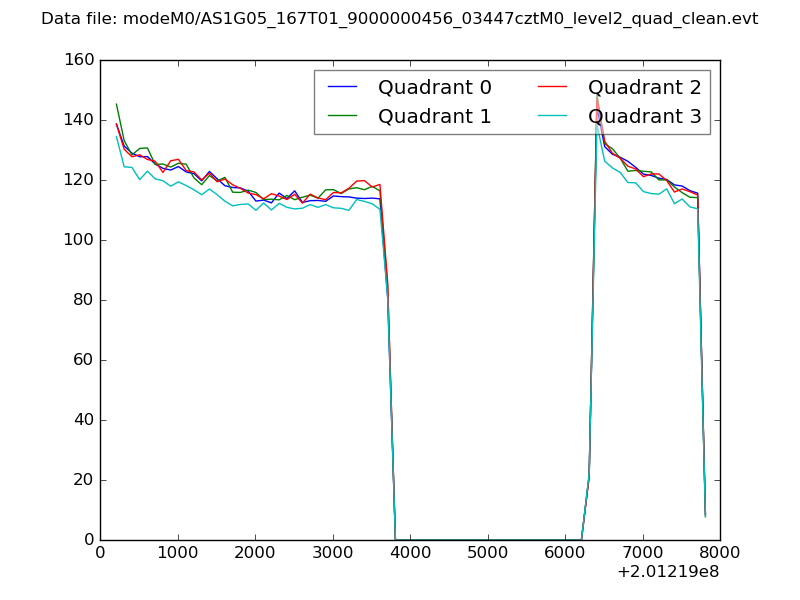 |
|
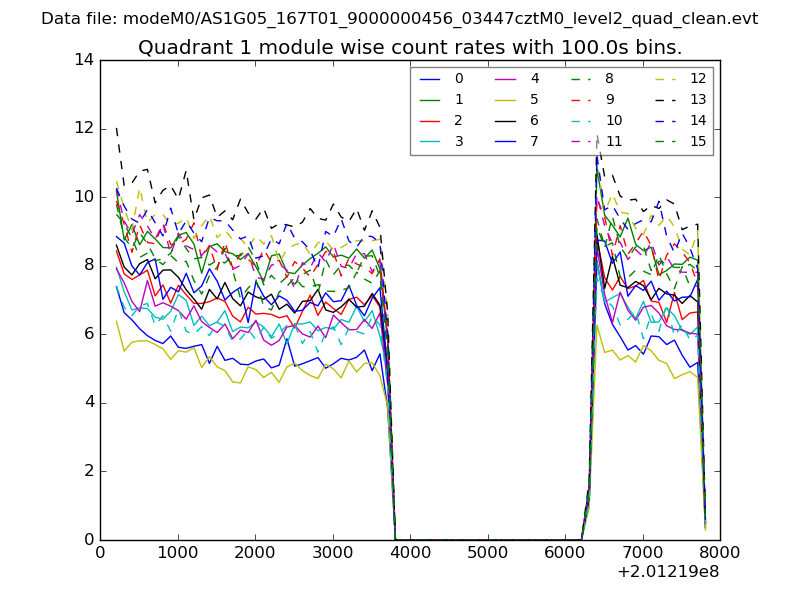
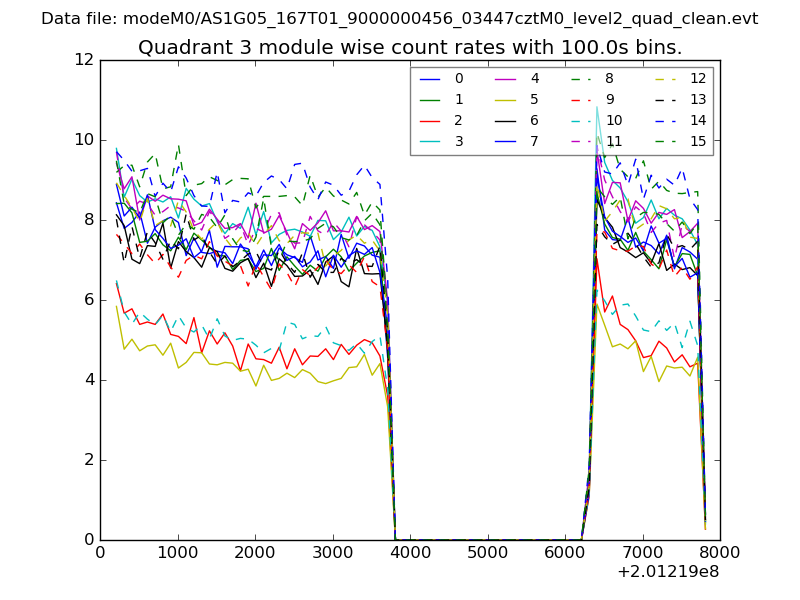
| Module-wise count rates for Quadrant A Data is divided into 100 sec bins |
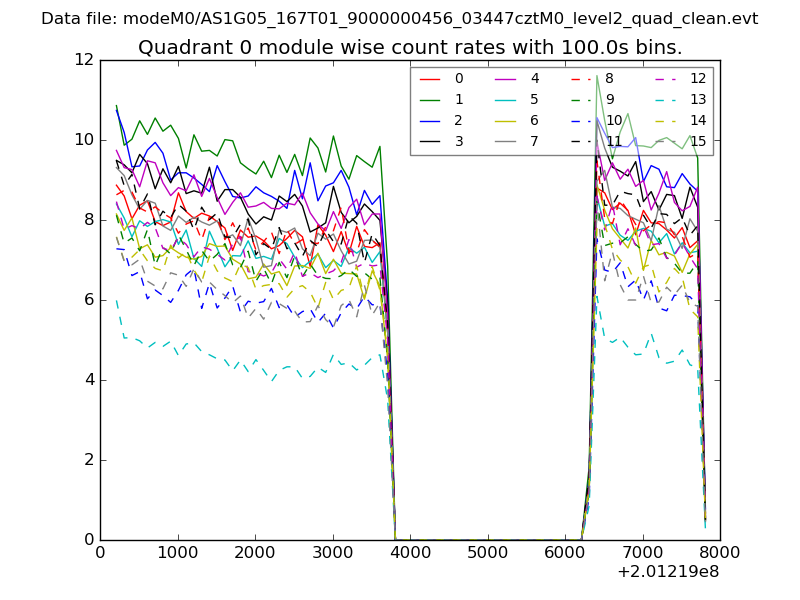 |
 |
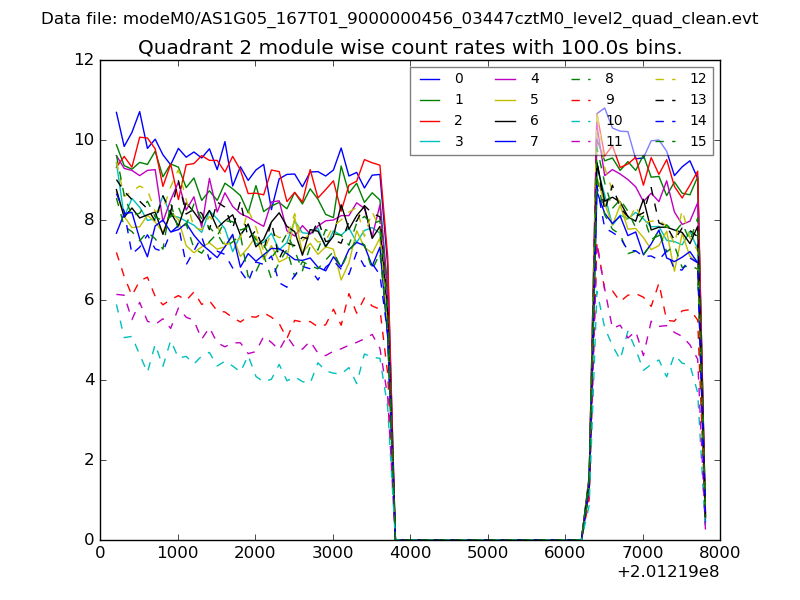
| Module-wise count rates for Quadrant B Data is divided into 100 sec bins |
 |
 |
| Module-wise count rates for Quadrant C Data is divided into 100 sec bins |
 |
 |
| Module-wise count rates for Quadrant D Data is divided into 100 sec bins |
 |
 |
| Parameter | Plot |
|---|---|
| CZT HV Monitor | 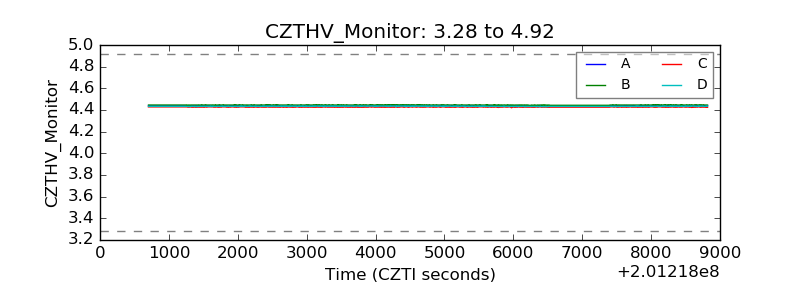 |
| D_VDD | 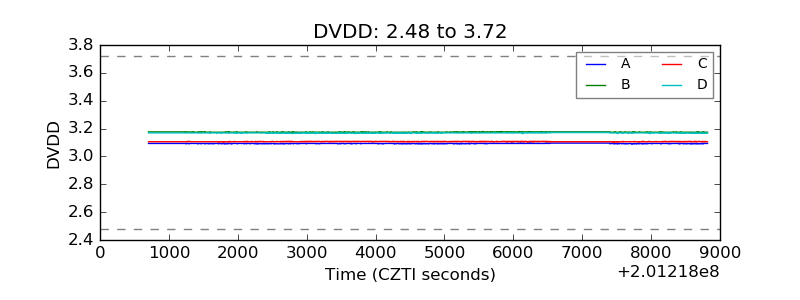 |
| Temperature 1 | 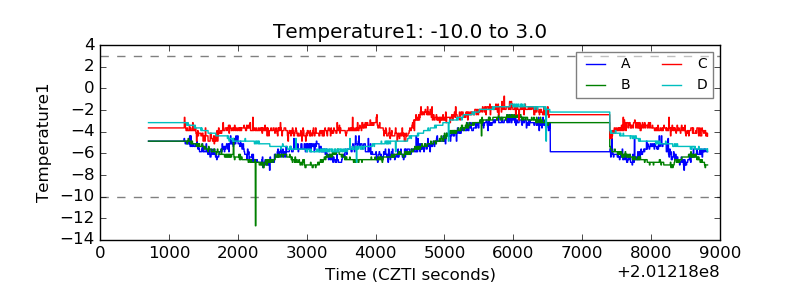 |
| Veto HV Monitor |  |
| Veto LLD | 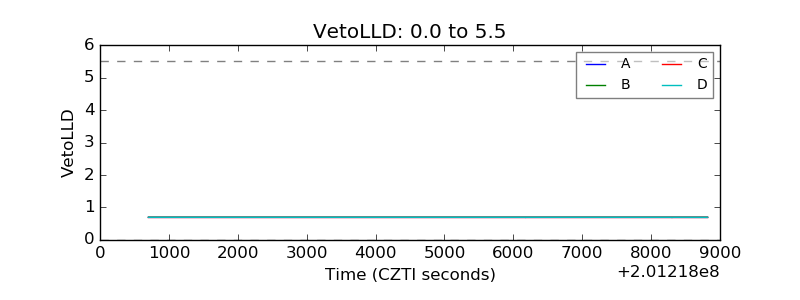 |
| Alpha Counter | 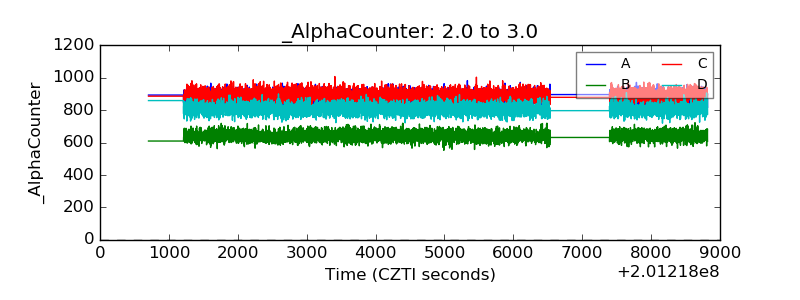 |
| _CPM_Rate | 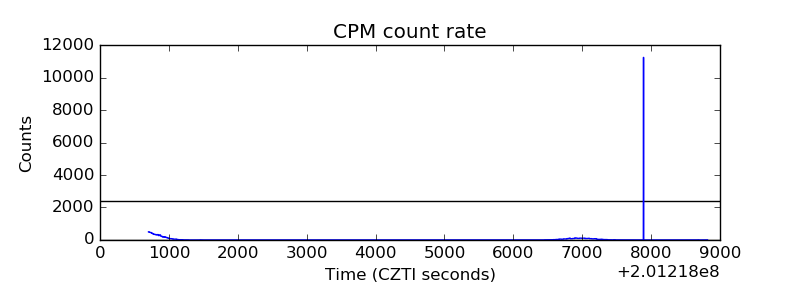 |
| CZT Counter | 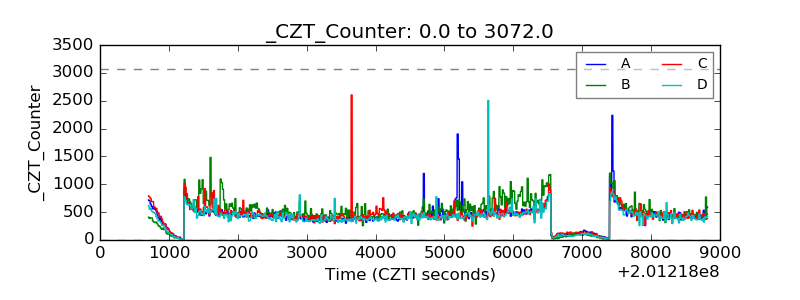 |
| +2.5 Volts monitor |  |
| +5 Volts monitor |  |
| _ROLL_ROT | 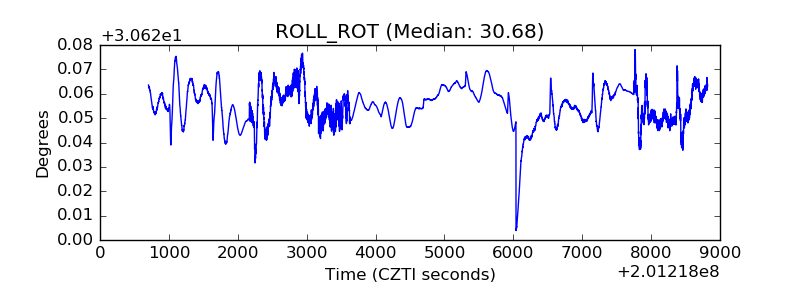 |
| _Roll_DEC | 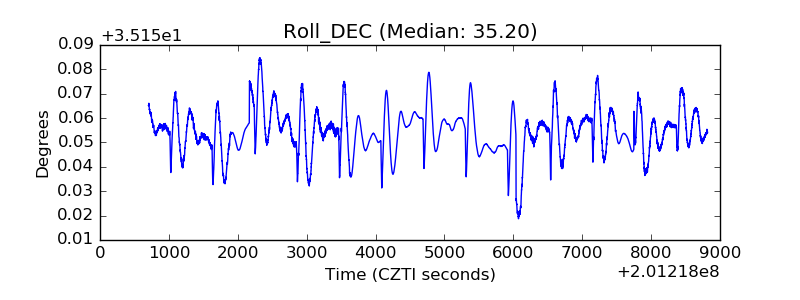 |
| _Roll_RA | 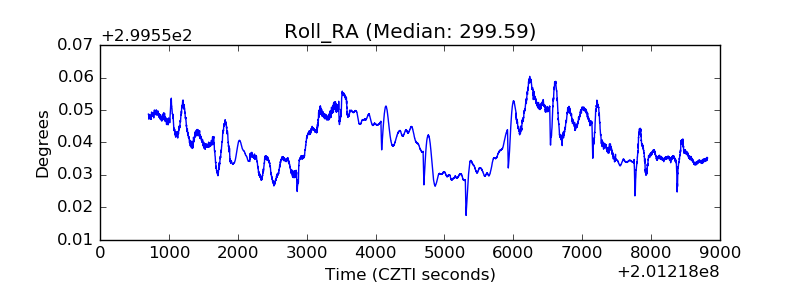 |
| Veto Counter | 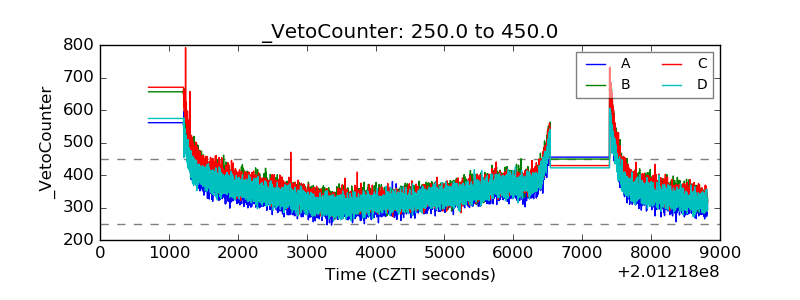 |