| Param | Original file | Final file |
|---|---|---|
| Filename | modeM0/AS1G05_167T01_9000000456_03448cztM0_level2.evt | modeM0/AS1G05_167T01_9000000456_03448cztM0_level2_quad_clean.evt |
| Size (bytes) | 497,208,960 | 101,044,800 |
| Size | 474.2 MB | 96.4 MB |
| Events in quadrant A | 3,543,646 | 639,985 |
| Events in quadrant B | 4,065,470 | 639,250 |
| Events in quadrant C | 3,561,765 | 641,325 |
| Events in quadrant D | 3,376,496 | 616,687 |
| Mode M9 | |||
|---|---|---|---|
| Quadrant | BADHDUFLAG | Total packets | Discarded packets |
| A | 0 | 7 | 0 |
| B | 0 | 7 | 0 |
| C | 0 | 7 | 0 |
| D | 0 | 8 | 0 |
| Mode SS | |||
|---|---|---|---|
| Quadrant | BADHDUFLAG | Total packets | Discarded packets |
| A | 0 | 154 | 0 |
| B | 0 | 154 | 0 |
| C | 0 | 154 | 0 |
| D | 0 | 154 | 0 |
| Mode M0 | |||
|---|---|---|---|
| Quadrant | BADHDUFLAG | Total packets | Discarded packets |
| A | 0 | 15863 | 3 |
| B | 0 | 17181 | 2 |
| C | 0 | 15938 | 2 |
| D | 0 | 15742 | 2 |
| Quadrant | Total seconds | Saturated seconds | Saturation percentage |
|---|---|---|---|
| A | 7507 | 120 | 1.598508% |
| B | 7507 | 191 | 2.544292% |
| C | 7507 | 106 | 1.412015% |
| D | 7507 | 50 | 0.666045% |
Noise dominated data is calculated using 1-second bins in cleaned event files. If a bin has >2000 counts, and if more than 50% of those come from <1% of pixels, then it is considered to be noise-dominated and hence unusable.
| Quadrant | # 1 sec bins | Bins with >0 counts | Bins with >2000 counts | High rate bins dominated by noise | Noise dominated (total time) | Noise dominated (detector-on time) | Marked lightcurve |
|---|---|---|---|---|---|---|---|
| A | 7812 | 7508 | 3 | 3 | 0.04% | 0.04% | 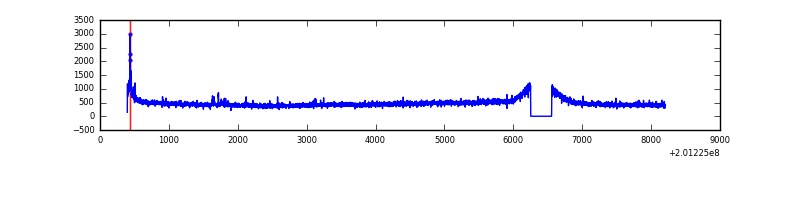 |
| B | 7812 | 7508 | 3 | 3 | 0.04% | 0.04% | 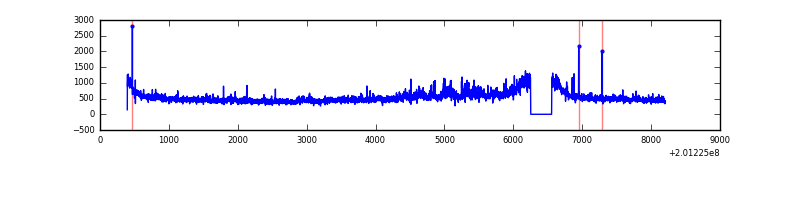 |
| C | 7812 | 7508 | 0 | 0 | 0.00% | 0.00% | 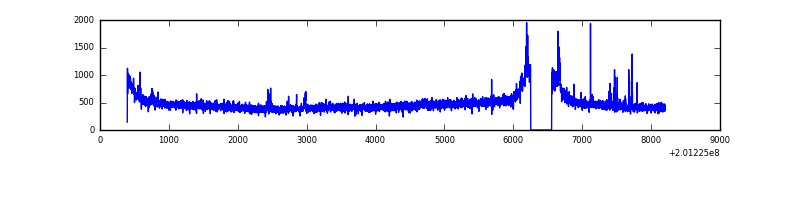 |
| D | 7812 | 7508 | 9 | 9 | 0.12% | 0.12% | 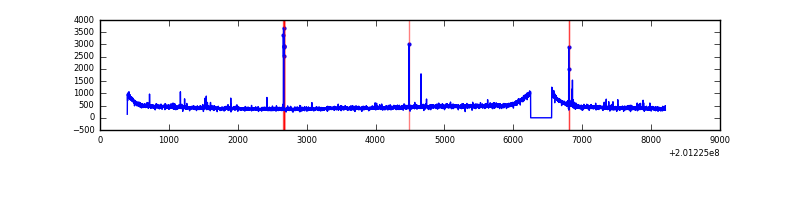 |
Top three noisy pixels from each quadrant. If the there are fewer than three noisy pixels in the level2.evt file, extra rows are filled as -1
| Pixel properties | Quadrant properties | ||||||
|---|---|---|---|---|---|---|---|
| Quadrant | DetID | PixID | Counts | Sigma | Mean | Median | Sigma |
| A | 0 | 50 | 40739 | 211.18 | 906 | 886 | 188.7 |
| A | 12 | 194 | 9411 | 45.17 | 906 | 886 | 188.7 |
| A | 0 | 226 | 9308 | 44.63 | 906 | 886 | 188.7 |
| B | 15 | 204 | 447371 | 2482.9 | 920 | 899 | 179.8 |
| B | 0 | 229 | 24142 | 129.26 | 920 | 899 | 179.8 |
| B | 12 | 111 | 13702 | 71.2 | 920 | 899 | 179.8 |
| C | 1 | 192 | 52570 | 246.79 | 888 | 898 | 209.4 |
| C | 7 | 220 | 14124 | 63.17 | 888 | 898 | 209.4 |
| C | 13 | 61 | 7387 | 30.99 | 888 | 898 | 209.4 |
| D | 9 | 85 | 22702 | 101.18 | 878 | 854 | 215.9 |
| D | 5 | 233 | 21751 | 96.78 | 878 | 854 | 215.9 |
| D | 7 | 223 | 12897 | 55.77 | 878 | 854 | 215.9 |
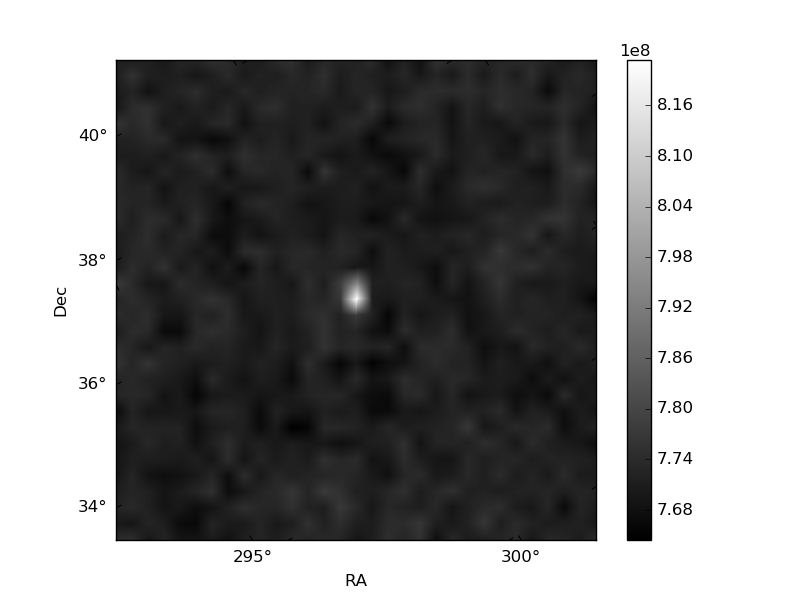
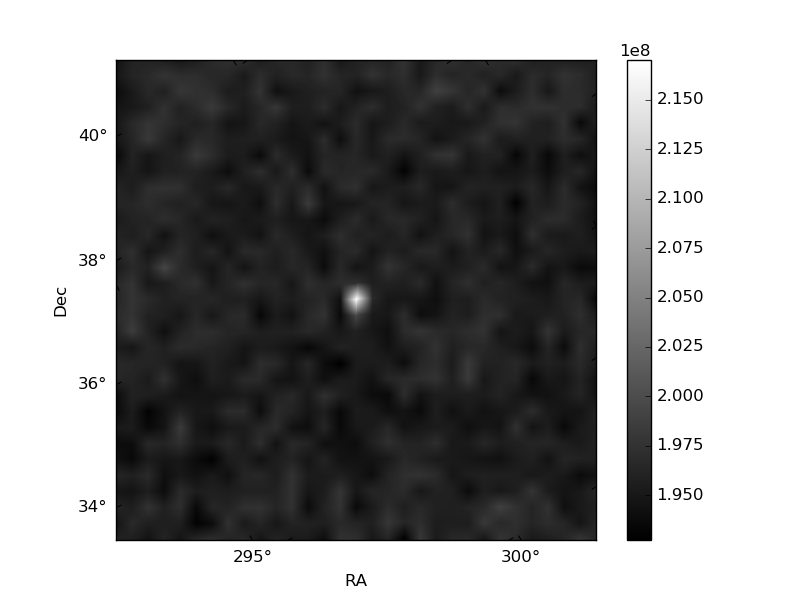
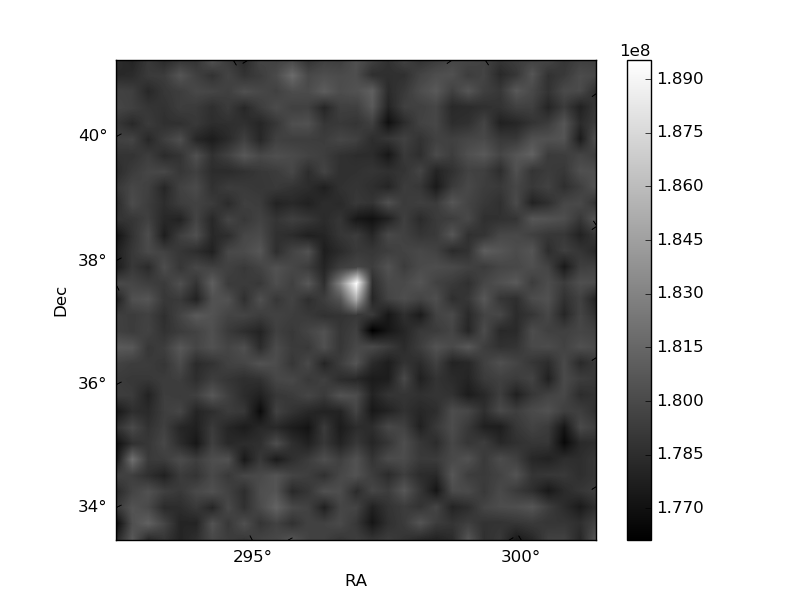
Histogram calculated using DETX and DETY for each event in the final _common_clean file
| Quadrant A | 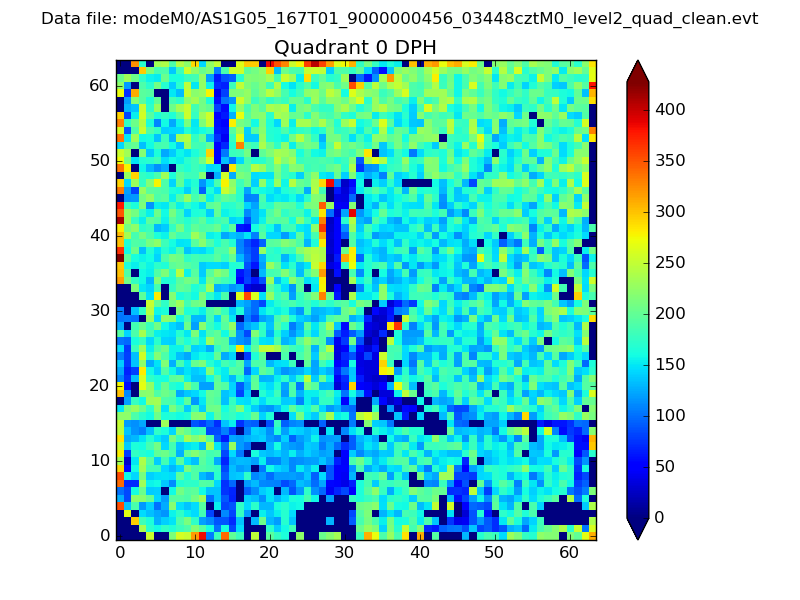 |
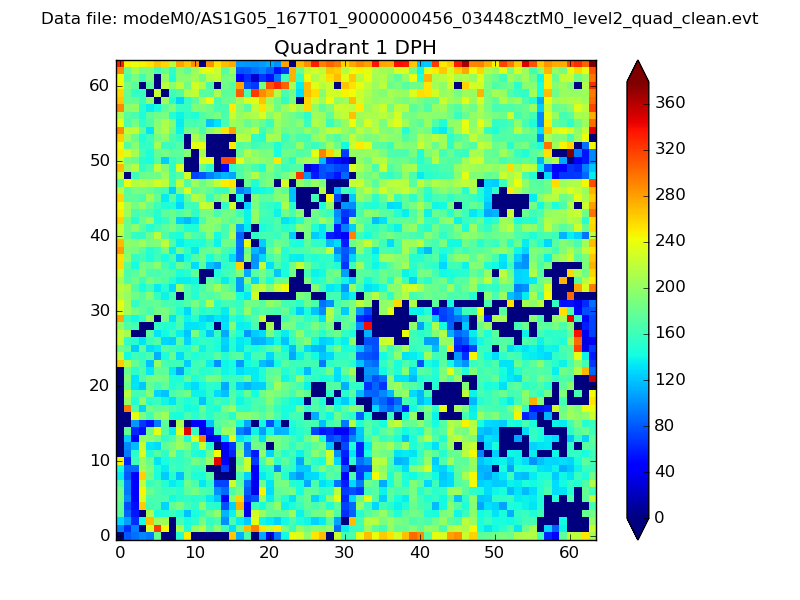 |
Quadrant B |
|---|---|---|---|
| Quadrant D | 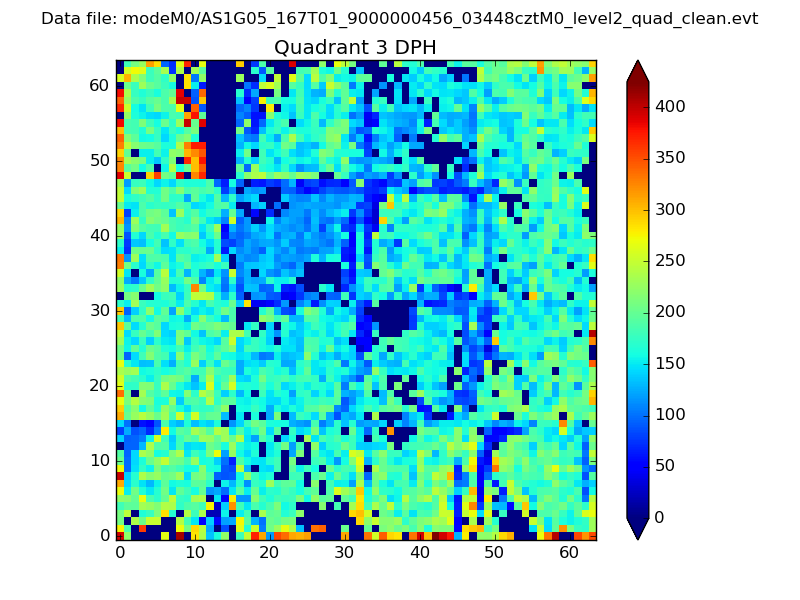 |
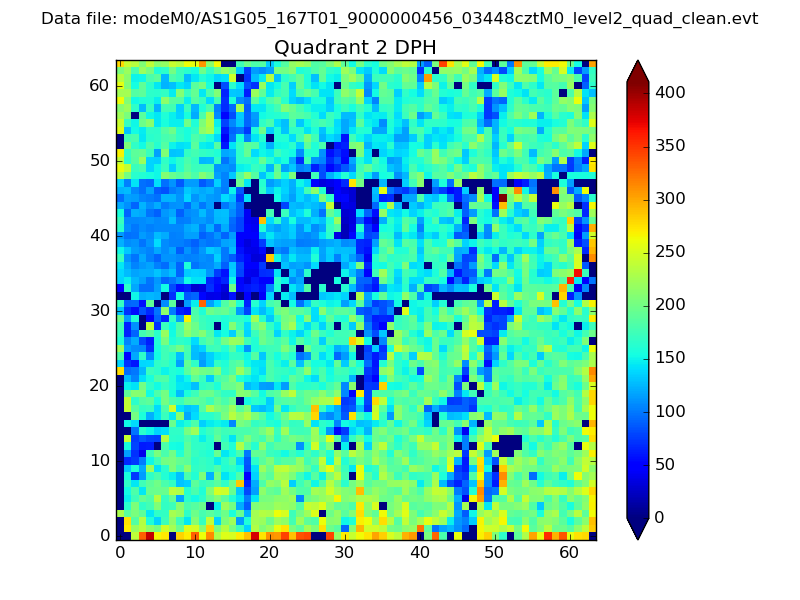 |
Quadrant C |
| Plot type | Count rate plots | Images |
|---|---|---|
| Comparison with Poisson distribution Blue bars denote a histogram of data divided into 1 sec bins. Red curve is a Poisson curve with rate = median count rate of data. |
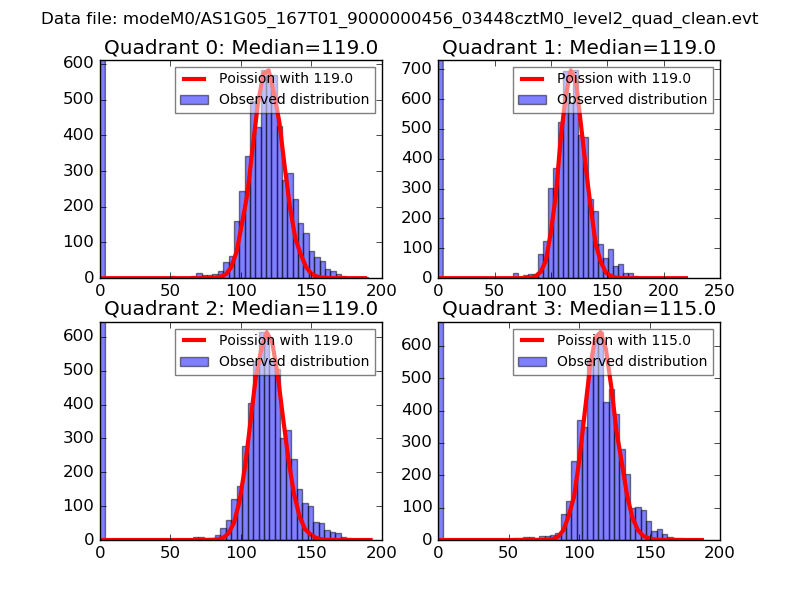 |
 |
| Quadrant-wise count rates Data is divided into 100 sec bins |
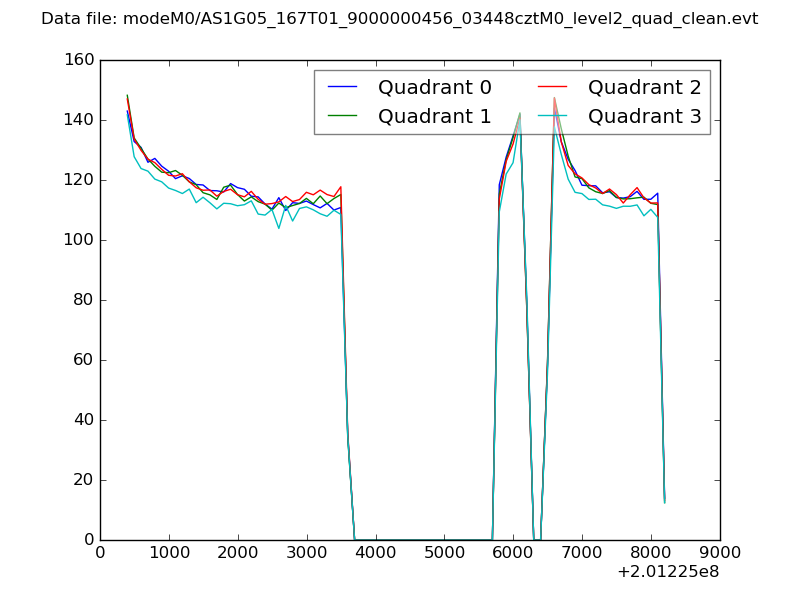 |
|
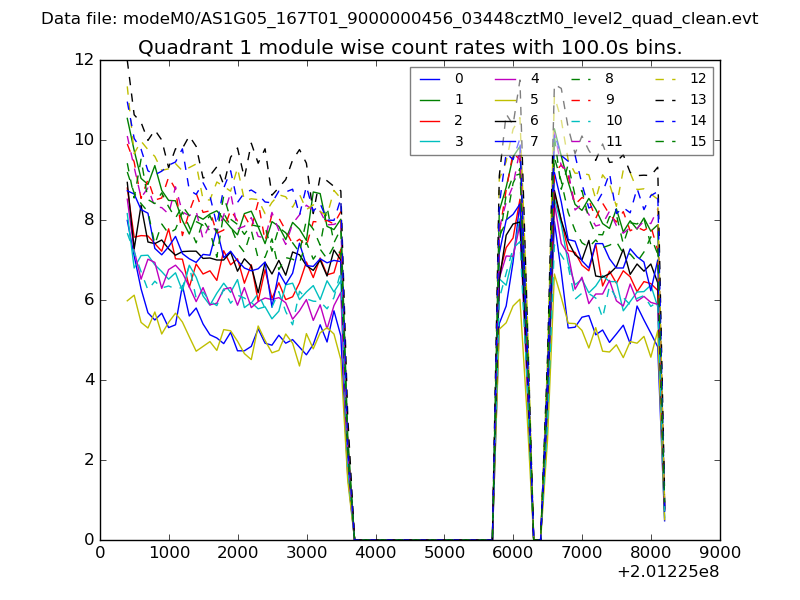
| Module-wise count rates for Quadrant A Data is divided into 100 sec bins |
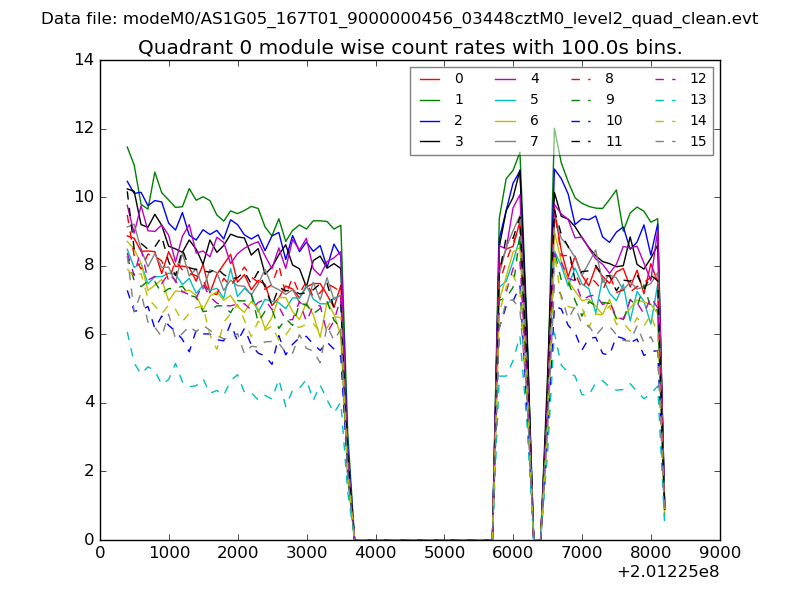 |
 |
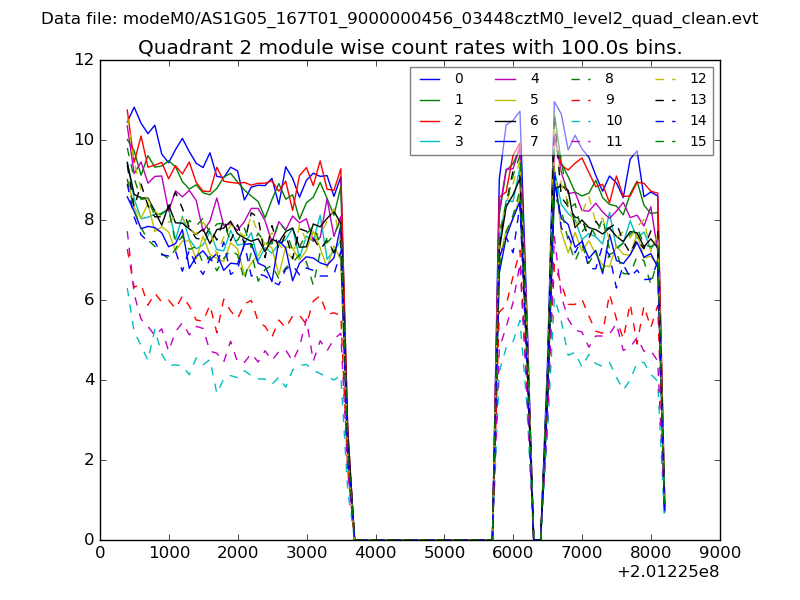
| Module-wise count rates for Quadrant B Data is divided into 100 sec bins |
 |
 |
| Module-wise count rates for Quadrant C Data is divided into 100 sec bins |
 |
 |
| Module-wise count rates for Quadrant D Data is divided into 100 sec bins |
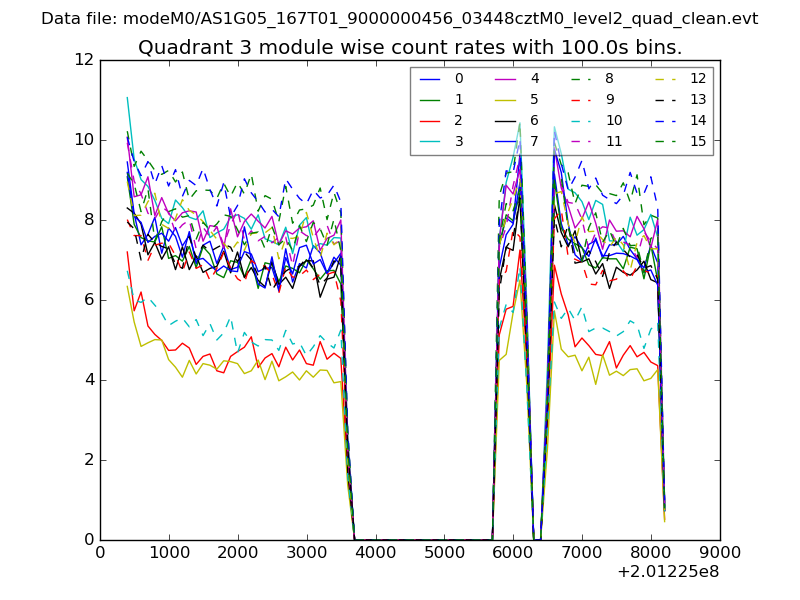 |
 |
| Parameter | Plot |
|---|---|
| CZT HV Monitor | 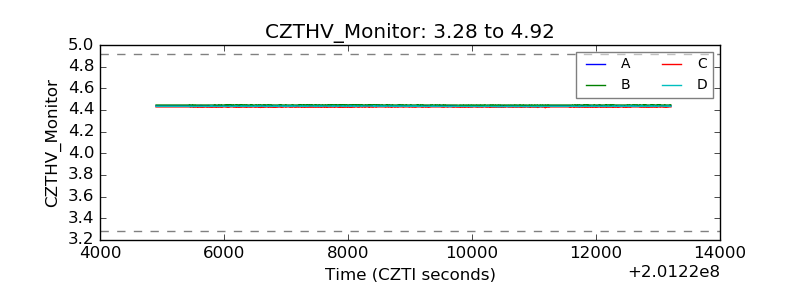 |
| D_VDD |  |
| Temperature 1 | 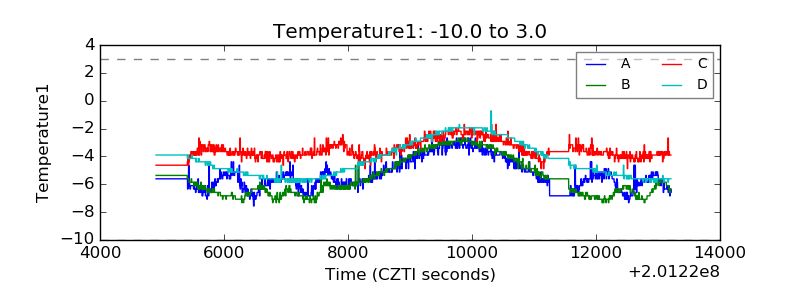 |
| Veto HV Monitor | 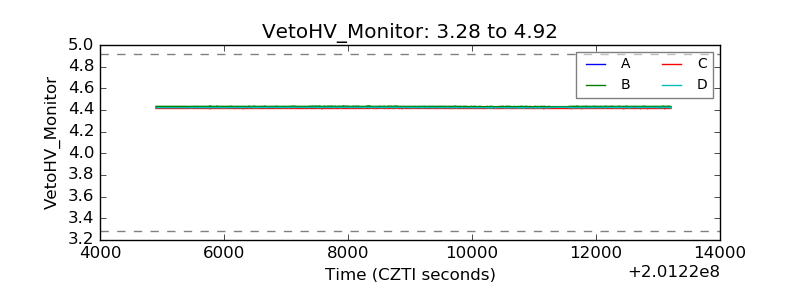 |
| Veto LLD | 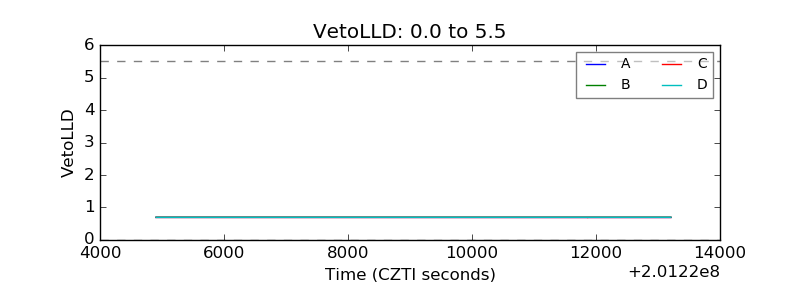 |
| Alpha Counter | 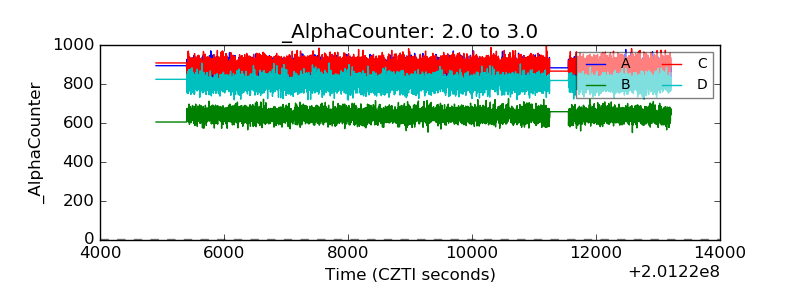 |
| _CPM_Rate | 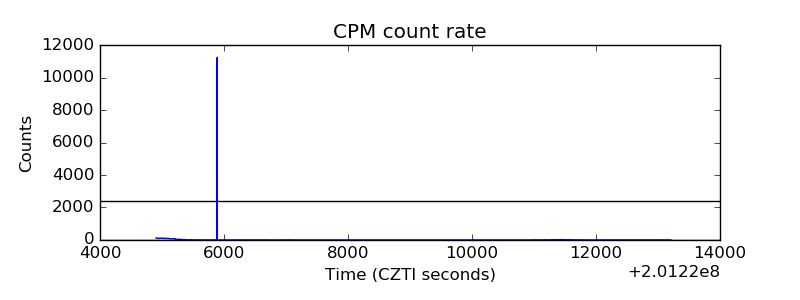 |
| CZT Counter | 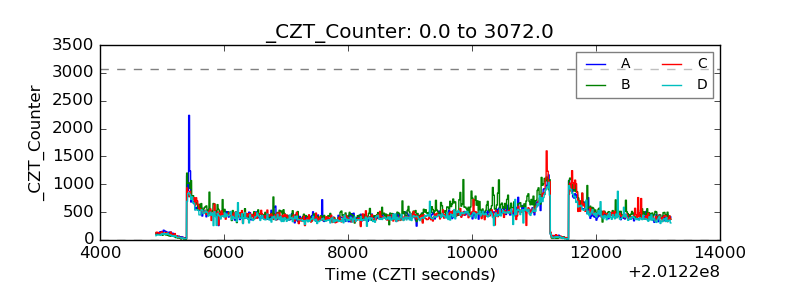 |
| +2.5 Volts monitor | 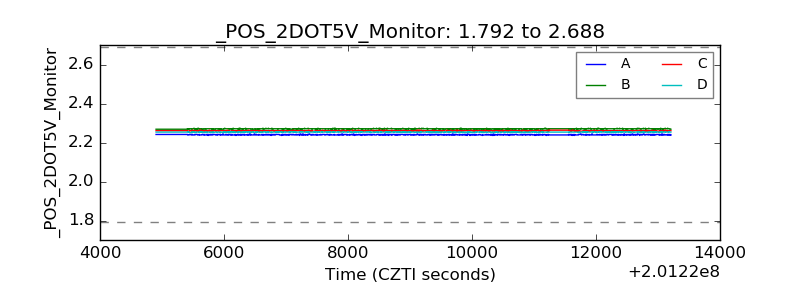 |
| +5 Volts monitor |  |
| _ROLL_ROT | 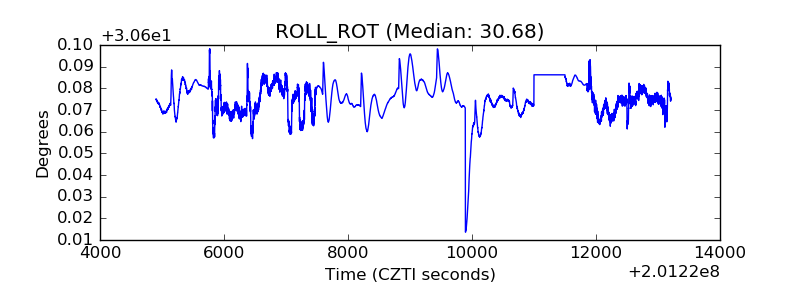 |
| _Roll_DEC | 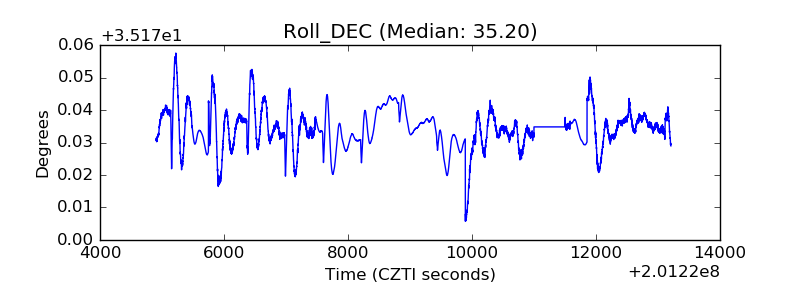 |
| _Roll_RA | 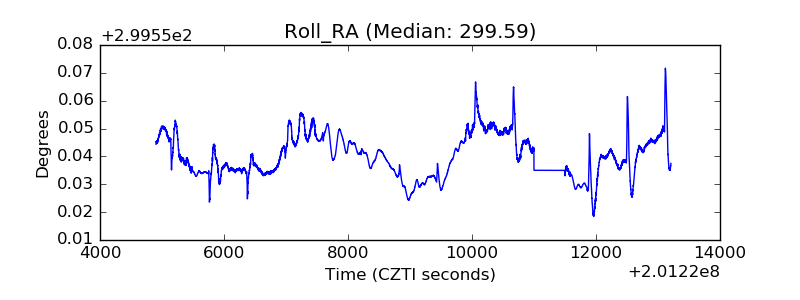 |
| Veto Counter | 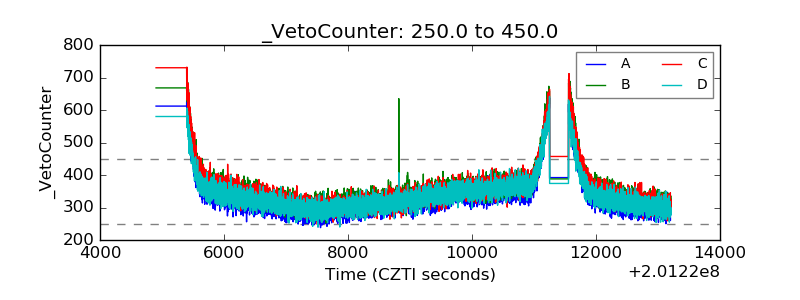 |