| Param | Original file | Final file |
|---|---|---|
| Filename | modeM0/AS1G05_167T01_9000000456_03449cztM0_level2.evt | modeM0/AS1G05_167T01_9000000456_03449cztM0_level2_quad_clean.evt |
| Size (bytes) | 529,902,720 | 108,020,160 |
| Size | 505.4 MB | 103.0 MB |
| Events in quadrant A | 3,685,168 | 684,494 |
| Events in quadrant B | 4,509,397 | 687,974 |
| Events in quadrant C | 3,737,399 | 686,288 |
| Events in quadrant D | 3,575,844 | 659,466 |
| Mode M9 | |||
|---|---|---|---|
| Quadrant | BADHDUFLAG | Total packets | Discarded packets |
| A | 1 | 251318637792 | 0 |
| B | 1 | -1 | -1 |
| C | 1 | -1 | -1 |
| D | 1 | -1 | -1 |
| Mode SS | |||
|---|---|---|---|
| Quadrant | BADHDUFLAG | Total packets | Discarded packets |
| A | 0 | 160 | 0 |
| B | 0 | 160 | 0 |
| C | 0 | 160 | 0 |
| D | 0 | 160 | 0 |
| Mode M0 | |||
|---|---|---|---|
| Quadrant | BADHDUFLAG | Total packets | Discarded packets |
| A | 0 | 16658 | 2 |
| B | 0 | 18802 | 1 |
| C | 0 | 16845 | 1 |
| D | 0 | 16717 | 1 |
| Quadrant | Total seconds | Saturated seconds | Saturation percentage |
|---|---|---|---|
| A | 7955 | 61 | 0.766813% |
| B | 7955 | 142 | 1.785041% |
| C | 7955 | 51 | 0.641106% |
| D | 7955 | 43 | 0.540541% |
Noise dominated data is calculated using 1-second bins in cleaned event files. If a bin has >2000 counts, and if more than 50% of those come from <1% of pixels, then it is considered to be noise-dominated and hence unusable.
| Quadrant | # 1 sec bins | Bins with >0 counts | Bins with >2000 counts | High rate bins dominated by noise | Noise dominated (total time) | Noise dominated (detector-on time) | Marked lightcurve |
|---|---|---|---|---|---|---|---|
| A | 7955 | 7955 | 1 | 1 | 0.01% | 0.01% | 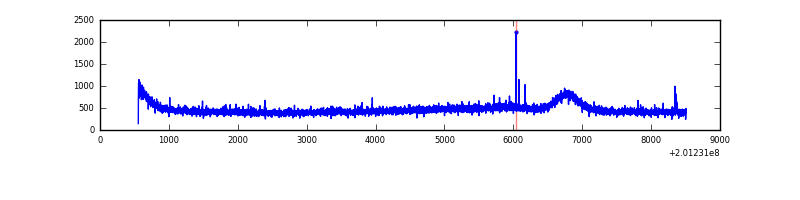 |
| B | 7955 | 7955 | 31 | 31 | 0.39% | 0.39% | 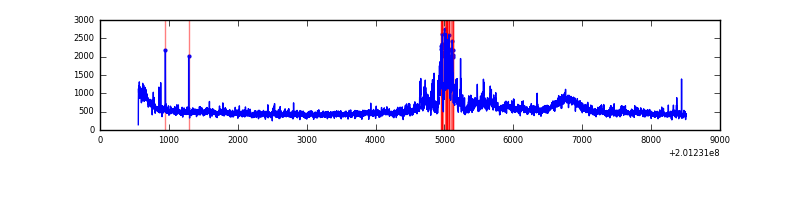 |
| C | 7955 | 7955 | 2 | 2 | 0.03% | 0.03% | 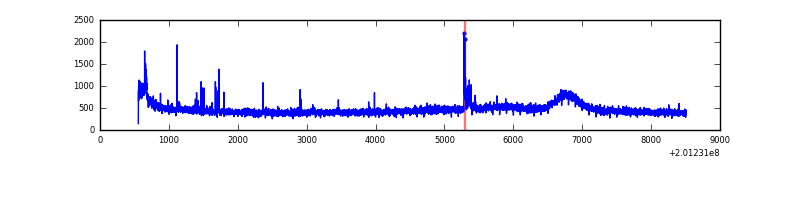 |
| D | 7955 | 7955 | 11 | 11 | 0.14% | 0.14% | 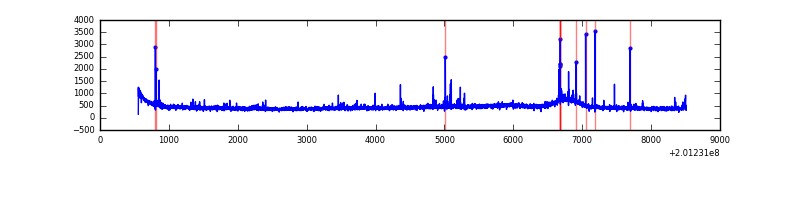 |
Top three noisy pixels from each quadrant. If the there are fewer than three noisy pixels in the level2.evt file, extra rows are filled as -1
| Pixel properties | Quadrant properties | ||||||
|---|---|---|---|---|---|---|---|
| Quadrant | DetID | PixID | Counts | Sigma | Mean | Median | Sigma |
| A | 8 | 15 | 13070 | 61.83 | 949 | 930 | 196.3 |
| A | 0 | 50 | 12118 | 56.99 | 949 | 930 | 196.3 |
| A | 12 | 194 | 10039 | 46.4 | 949 | 930 | 196.3 |
| B | 14 | 167 | 369796 | 1955.65 | 965 | 941 | 188.6 |
| B | 15 | 204 | 368673 | 1949.69 | 965 | 941 | 188.6 |
| B | 0 | 229 | 27121 | 138.8 | 965 | 941 | 188.6 |
| C | 1 | 192 | 77567 | 351.69 | 929 | 936 | 217.9 |
| C | 7 | 220 | 15570 | 67.16 | 929 | 936 | 217.9 |
| C | 13 | 61 | 7950 | 32.19 | 929 | 936 | 217.9 |
| D | 13 | 223 | 57772 | 250.98 | 917 | 890 | 226.6 |
| D | 2 | 37 | 22508 | 95.38 | 917 | 890 | 226.6 |
| D | 7 | 223 | 21911 | 92.75 | 917 | 890 | 226.6 |
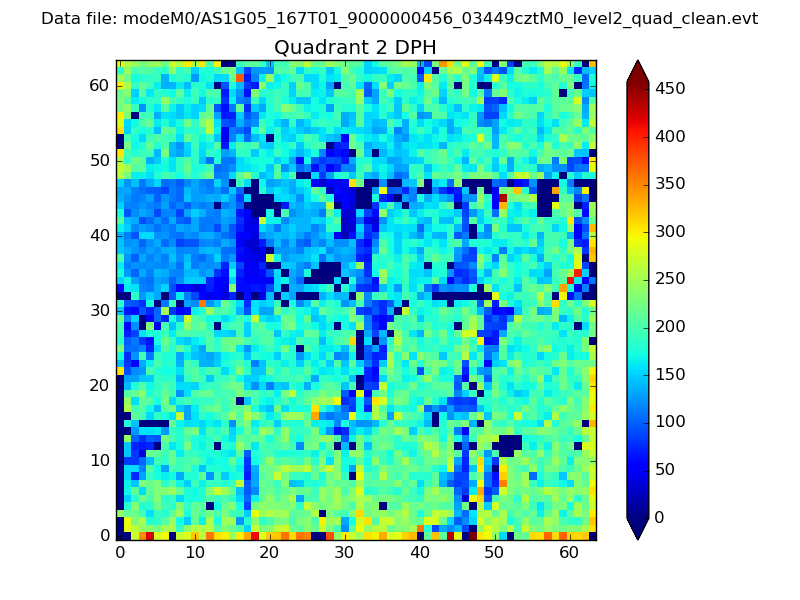
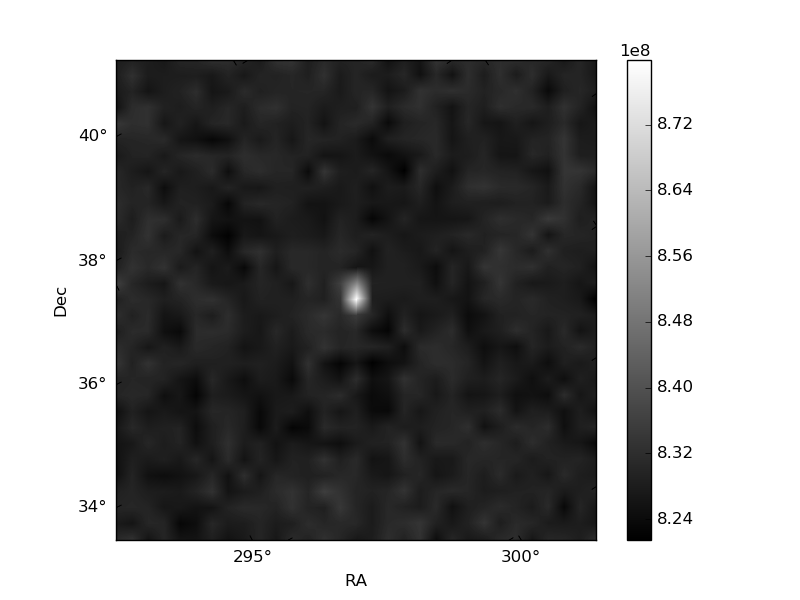
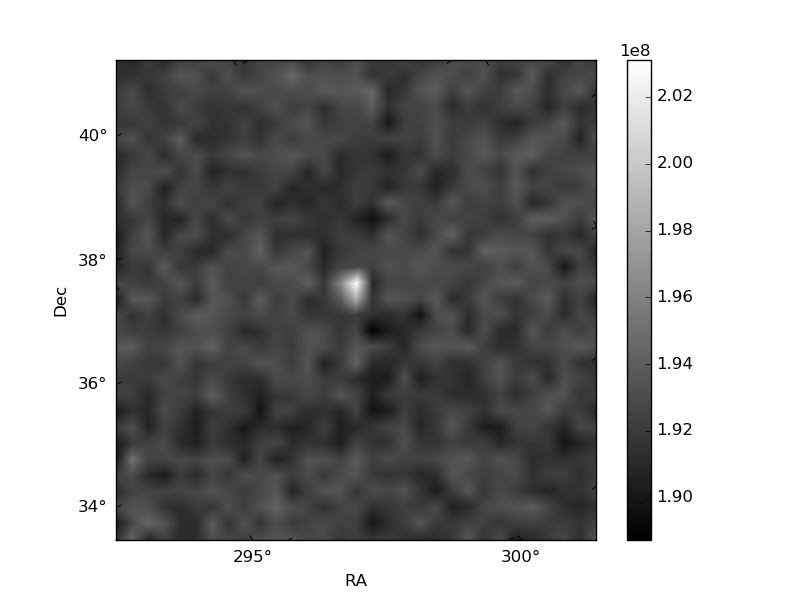
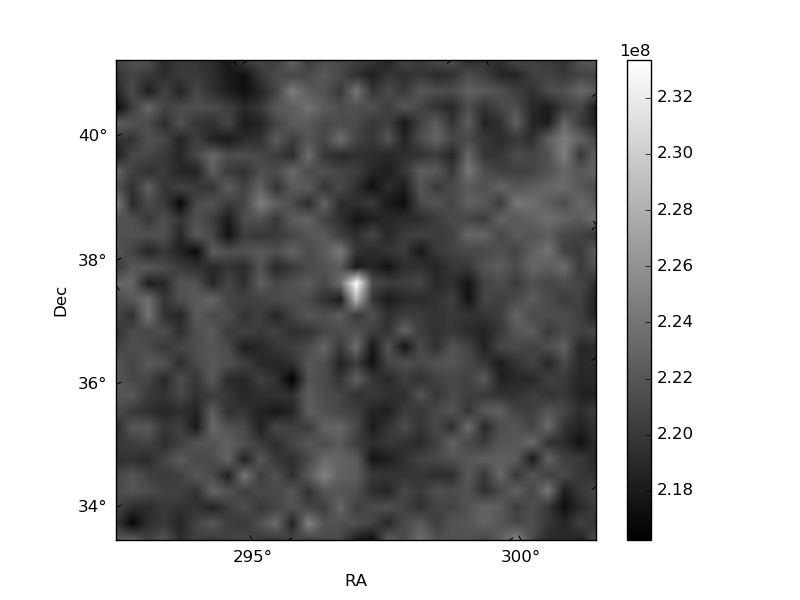
Histogram calculated using DETX and DETY for each event in the final _common_clean file
| Quadrant A | 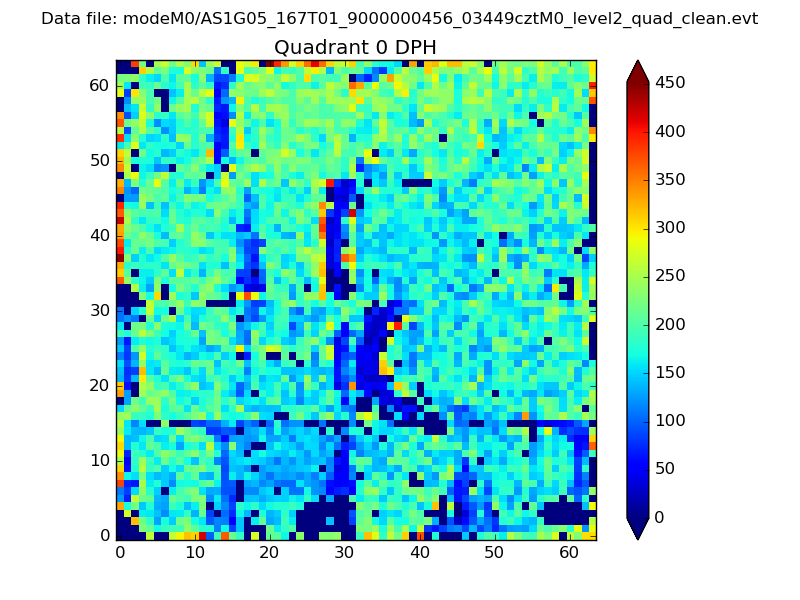 |
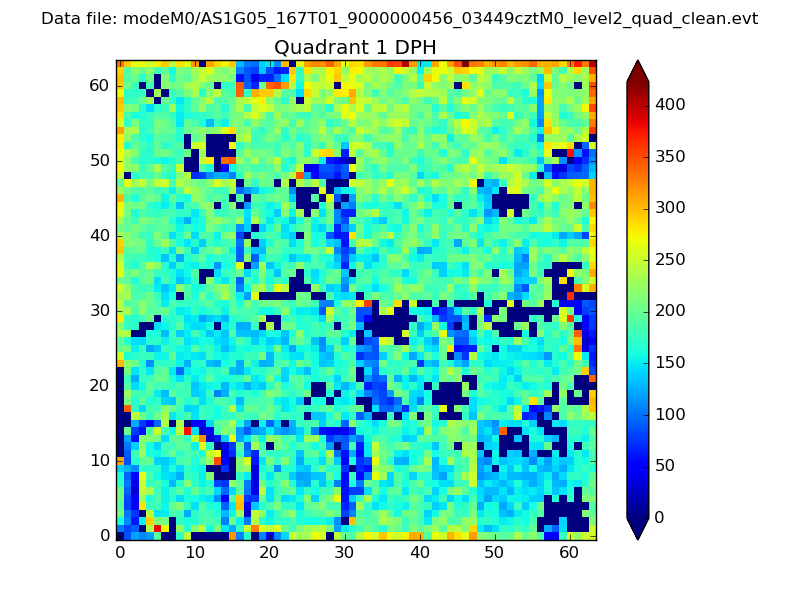 |
Quadrant B |
|---|---|---|---|
| Quadrant D | 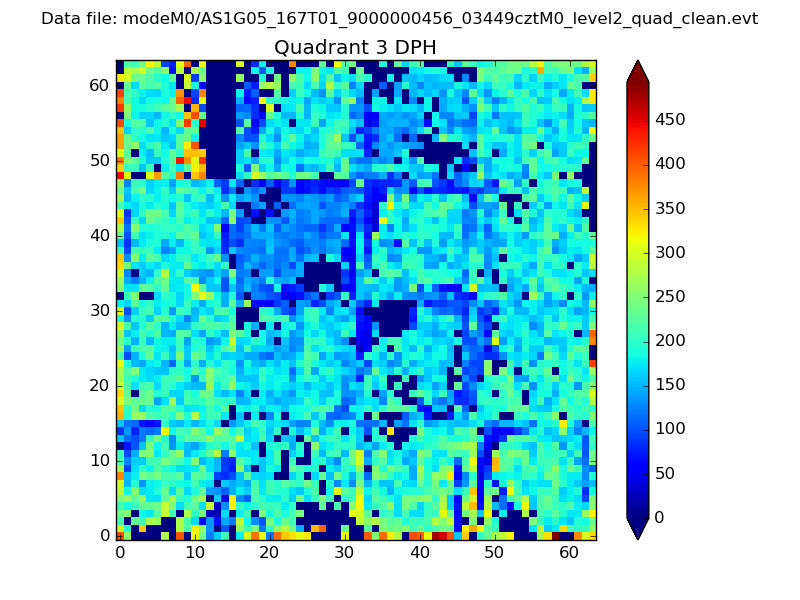 |
 |
Quadrant C |
| Plot type | Count rate plots | Images |
|---|---|---|
| Comparison with Poisson distribution Blue bars denote a histogram of data divided into 1 sec bins. Red curve is a Poisson curve with rate = median count rate of data. |
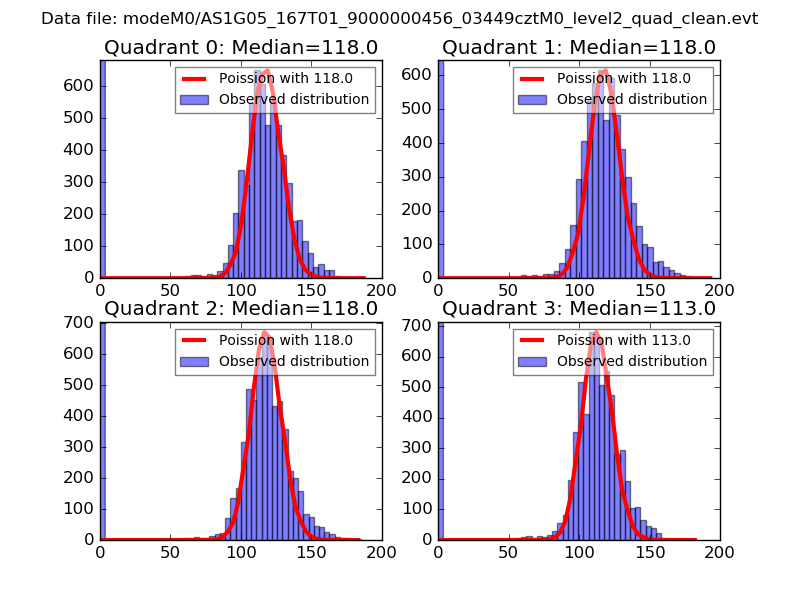 |
 |
| Quadrant-wise count rates Data is divided into 100 sec bins |
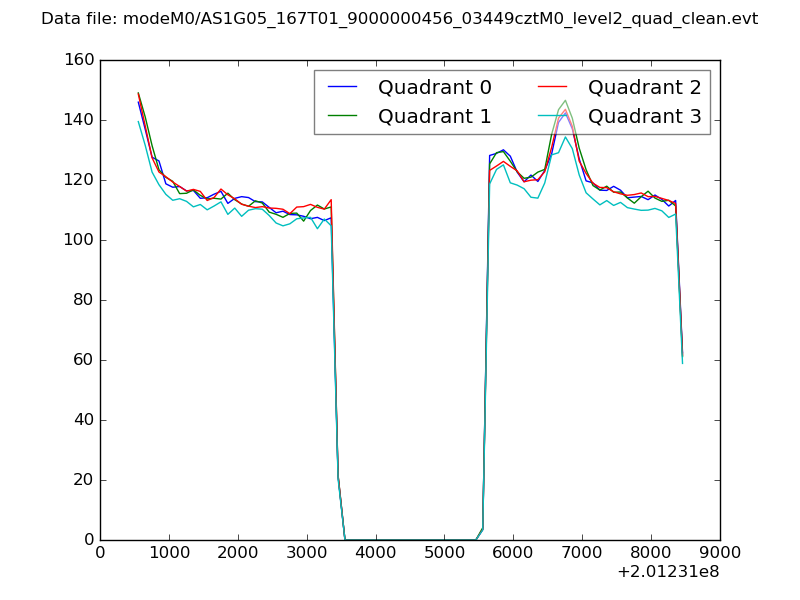 |
|
| Module-wise count rates for Quadrant A Data is divided into 100 sec bins |
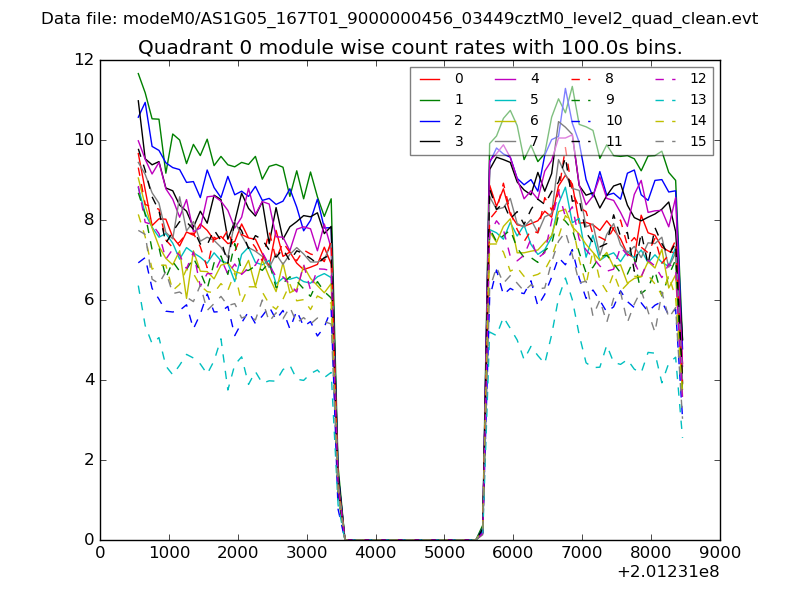 |
 |
| Module-wise count rates for Quadrant B Data is divided into 100 sec bins |
 |
 |
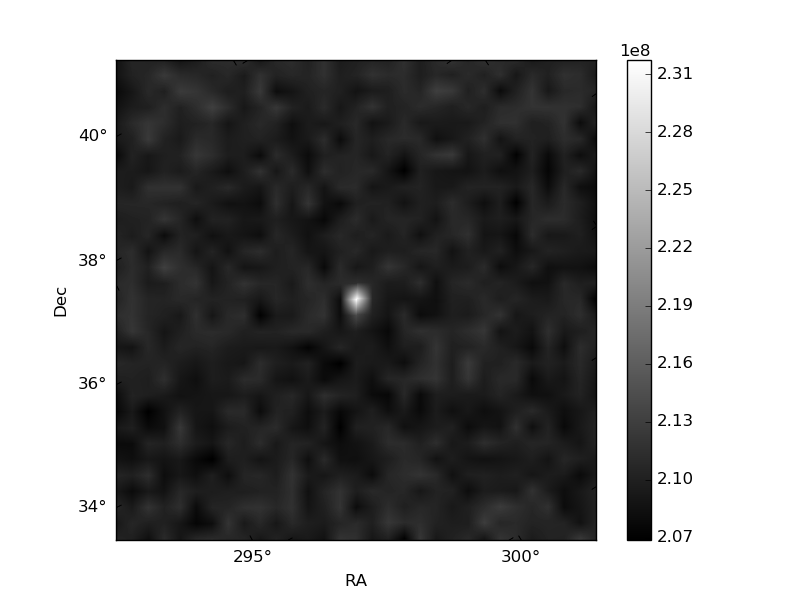
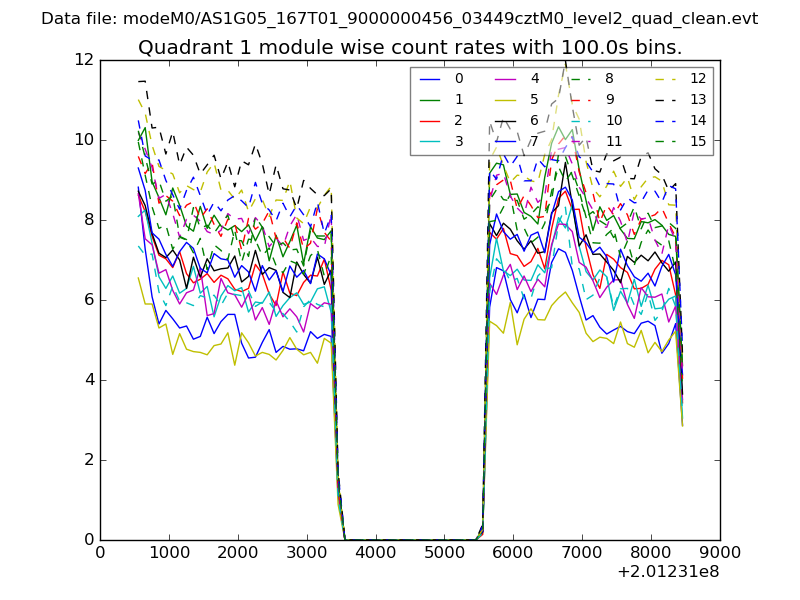
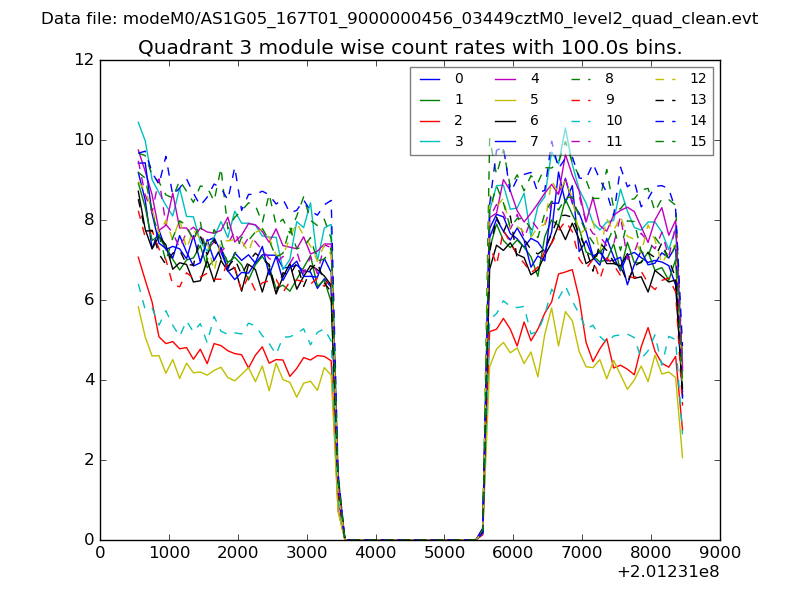
| Module-wise count rates for Quadrant C Data is divided into 100 sec bins |
 |
 |
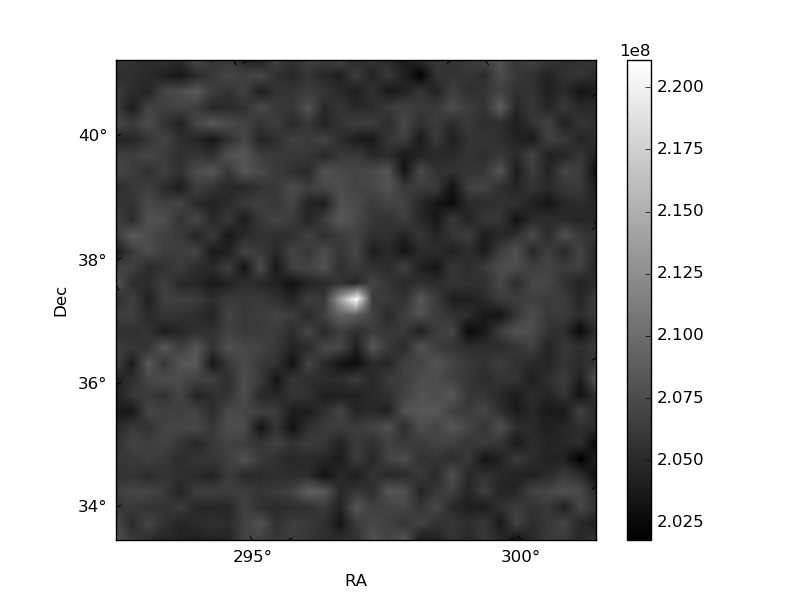
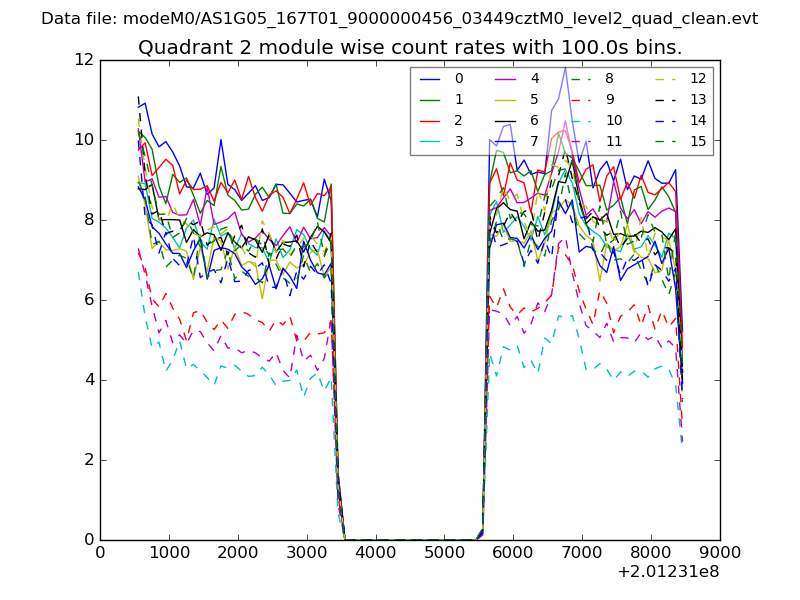
| Module-wise count rates for Quadrant D Data is divided into 100 sec bins |
 |
 |
| Parameter | Plot |
|---|---|
| CZT HV Monitor | 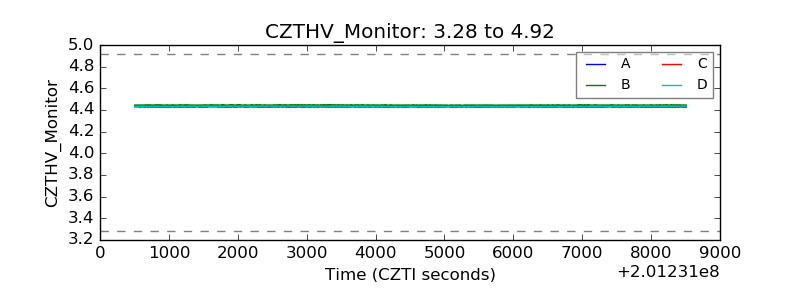 |
| D_VDD | 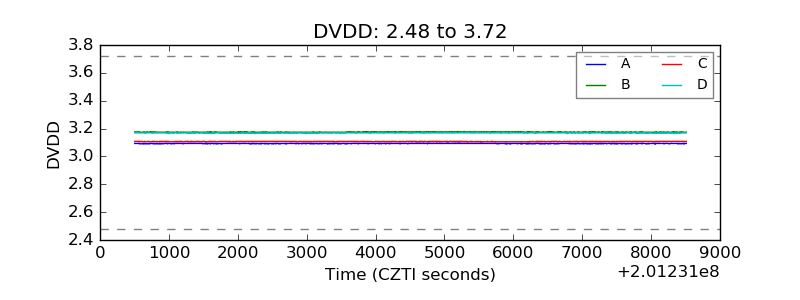 |
| Temperature 1 | 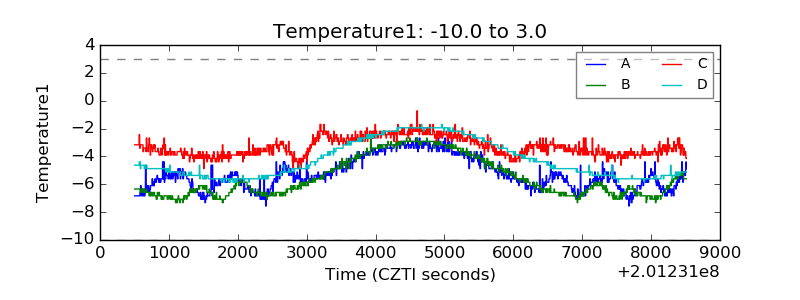 |
| Veto HV Monitor | 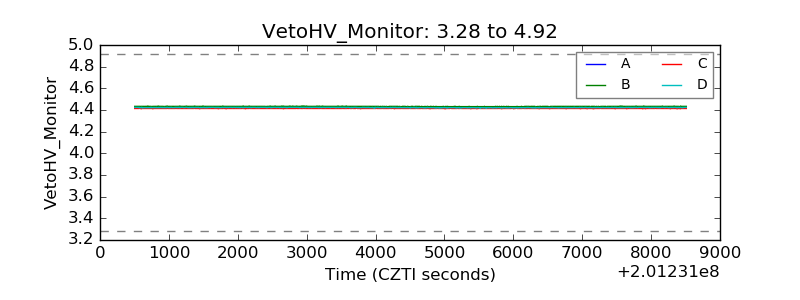 |
| Veto LLD | 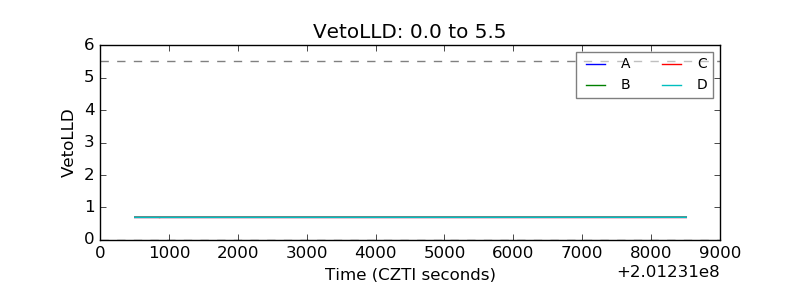 |
| Alpha Counter | 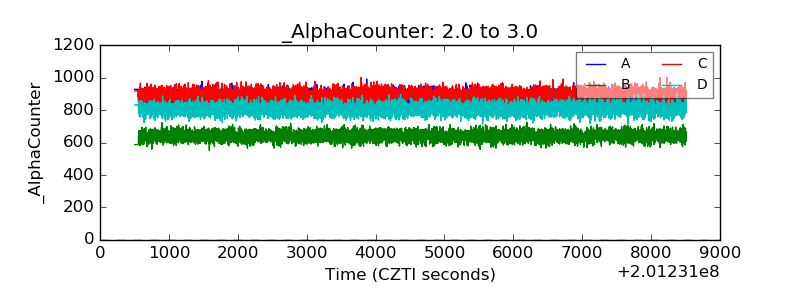 |
| _CPM_Rate |  |
| CZT Counter | 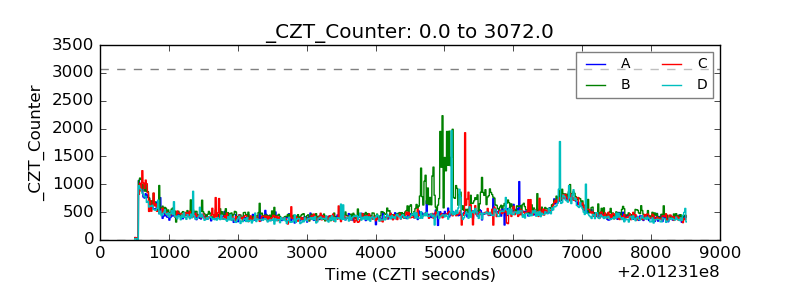 |
| +2.5 Volts monitor |  |
| +5 Volts monitor |  |
| _ROLL_ROT | 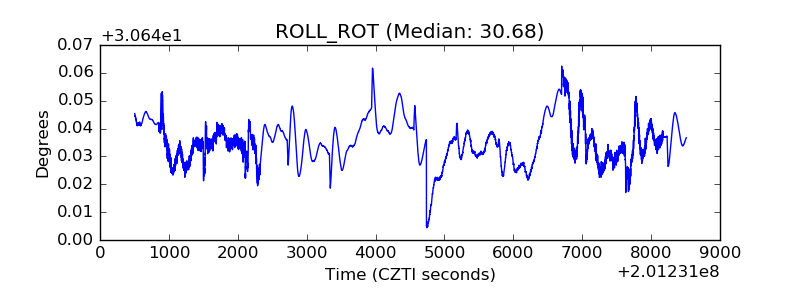 |
| _Roll_DEC | 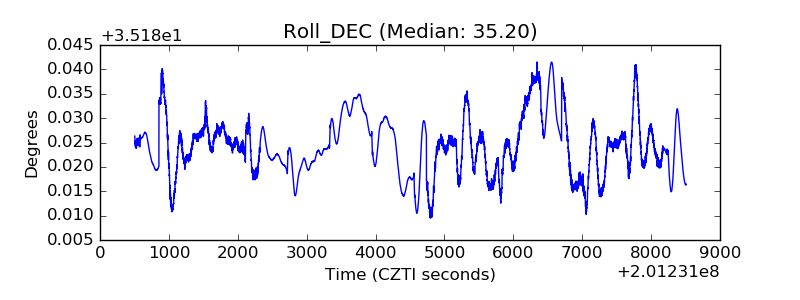 |
| _Roll_RA | 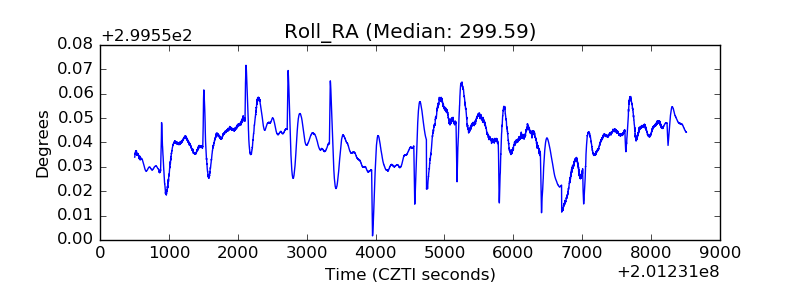 |
| Veto Counter | 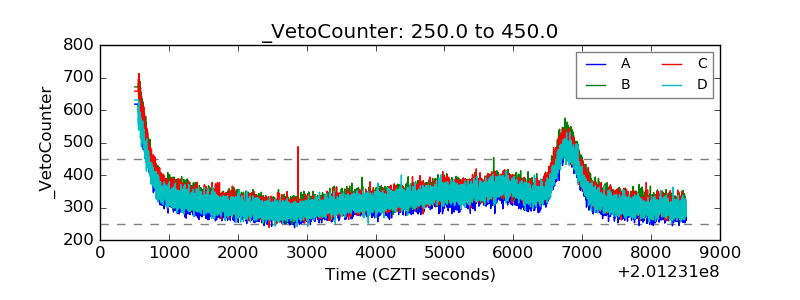 |