| Param | Original file | Final file |
|---|---|---|
| Filename | modeM0/AS1G05_167T01_9000000456_03450cztM0_level2.evt | modeM0/AS1G05_167T01_9000000456_03450cztM0_level2_quad_clean.evt |
| Size (bytes) | 505,428,480 | 104,664,960 |
| Size | 482.0 MB | 99.8 MB |
| Events in quadrant A | 3,541,846 | 660,478 |
| Events in quadrant B | 3,961,607 | 663,764 |
| Events in quadrant C | 3,661,002 | 664,006 |
| Events in quadrant D | 3,612,015 | 638,776 |
| Mode SS | |||
|---|---|---|---|
| Quadrant | BADHDUFLAG | Total packets | Discarded packets |
| A | 0 | 158 | 0 |
| B | 0 | 158 | 0 |
| C | 0 | 158 | 0 |
| D | 0 | 158 | 0 |
| Mode M0 | |||
|---|---|---|---|
| Quadrant | BADHDUFLAG | Total packets | Discarded packets |
| A | 0 | 16104 | 2 |
| B | 0 | 16883 | 1 |
| C | 0 | 16489 | 1 |
| D | 0 | 16728 | 1 |
| Quadrant | Total seconds | Saturated seconds | Saturation percentage |
|---|---|---|---|
| A | 7799 | 113 | 1.448904% |
| B | 7799 | 106 | 1.359149% |
| C | 7799 | 66 | 0.846262% |
| D | 7799 | 101 | 1.295038% |
Noise dominated data is calculated using 1-second bins in cleaned event files. If a bin has >2000 counts, and if more than 50% of those come from <1% of pixels, then it is considered to be noise-dominated and hence unusable.
| Quadrant | # 1 sec bins | Bins with >0 counts | Bins with >2000 counts | High rate bins dominated by noise | Noise dominated (total time) | Noise dominated (detector-on time) | Marked lightcurve |
|---|---|---|---|---|---|---|---|
| A | 7829 | 7801 | 2 | 2 | 0.03% | 0.03% | 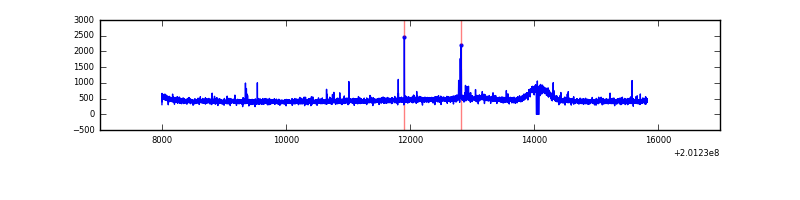 |
| B | 7829 | 7801 | 2 | 2 | 0.03% | 0.03% | 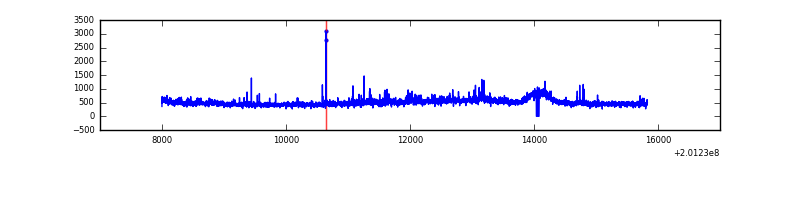 |
| C | 7829 | 7801 | 23 | 23 | 0.29% | 0.29% | 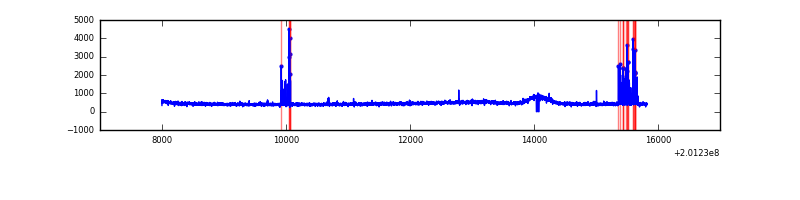 |
| D | 7829 | 7801 | 57 | 57 | 0.73% | 0.73% | 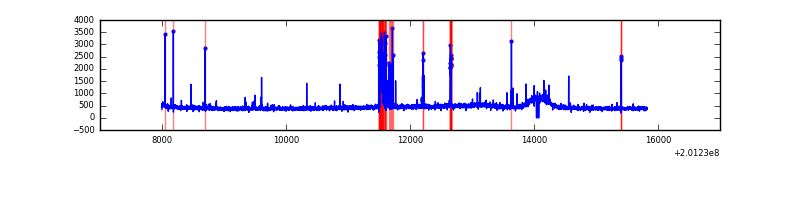 |
Top three noisy pixels from each quadrant. If the there are fewer than three noisy pixels in the level2.evt file, extra rows are filled as -1
| Pixel properties | Quadrant properties | ||||||
|---|---|---|---|---|---|---|---|
| Quadrant | DetID | PixID | Counts | Sigma | Mean | Median | Sigma |
| A | 0 | 50 | 29146 | 148.55 | 909 | 890 | 190.2 |
| A | 12 | 194 | 9374 | 44.6 | 909 | 890 | 190.2 |
| A | 0 | 226 | 9268 | 44.04 | 909 | 890 | 190.2 |
| B | 15 | 204 | 299086 | 1642.93 | 924 | 901 | 181.5 |
| B | 4 | 81 | 36181 | 194.38 | 924 | 901 | 181.5 |
| B | 0 | 229 | 19474 | 102.33 | 924 | 901 | 181.5 |
| C | 14 | 234 | 123365 | 589.09 | 885 | 891 | 207.9 |
| C | 14 | 223 | 50474 | 238.49 | 885 | 891 | 207.9 |
| C | 1 | 192 | 13230 | 59.35 | 885 | 891 | 207.9 |
| D | 13 | 223 | 252451 | 1172.07 | 876 | 851 | 214.7 |
| D | 7 | 223 | 13352 | 58.24 | 876 | 851 | 214.7 |
| D | 9 | 85 | 12893 | 56.1 | 876 | 851 | 214.7 |
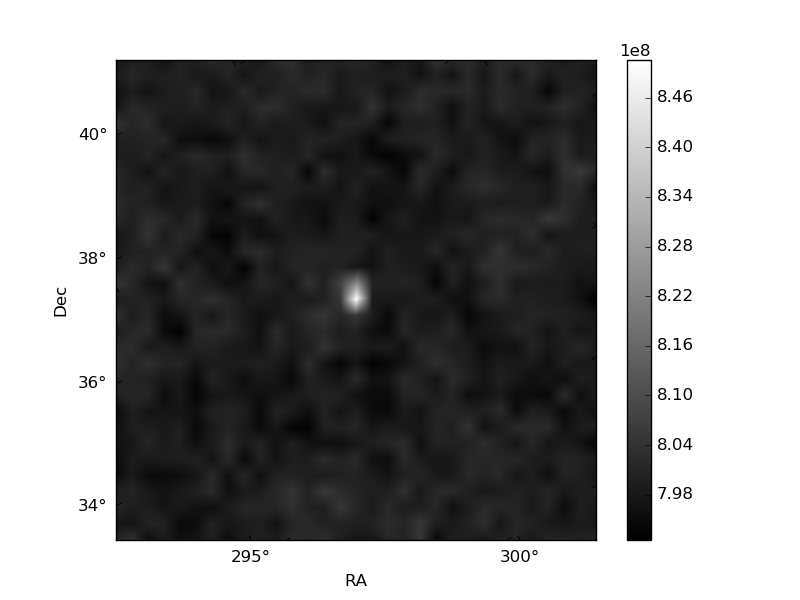
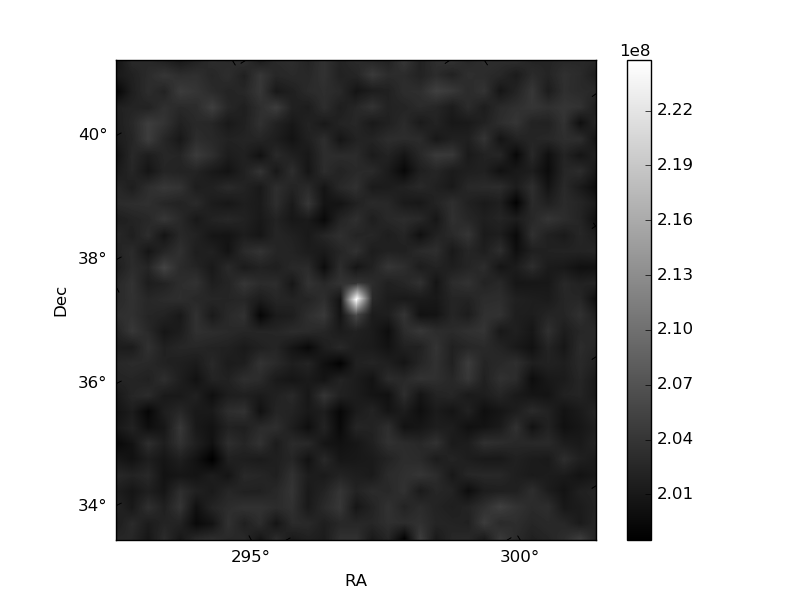
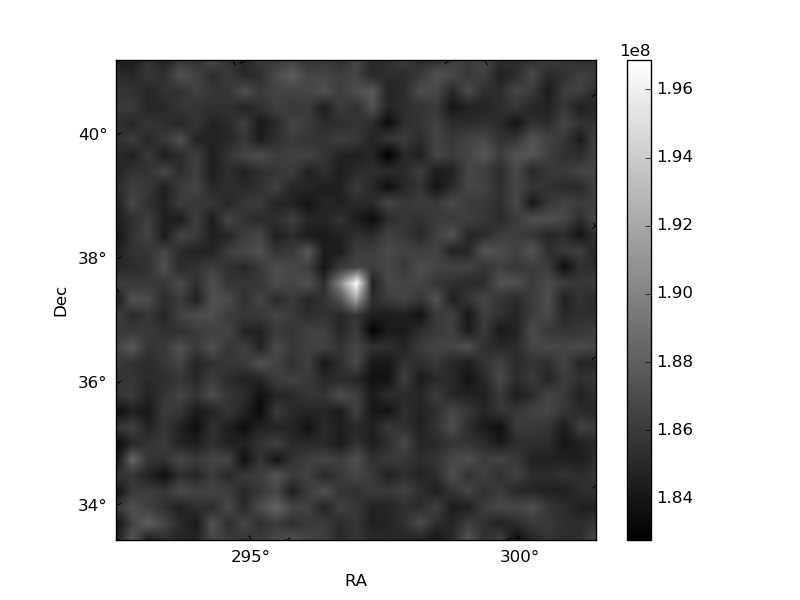
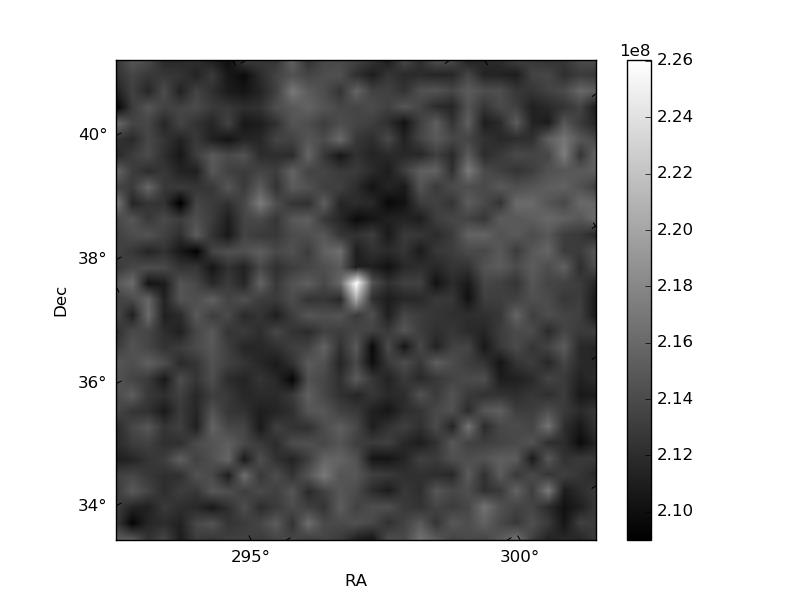
Histogram calculated using DETX and DETY for each event in the final _common_clean file
| Quadrant A | 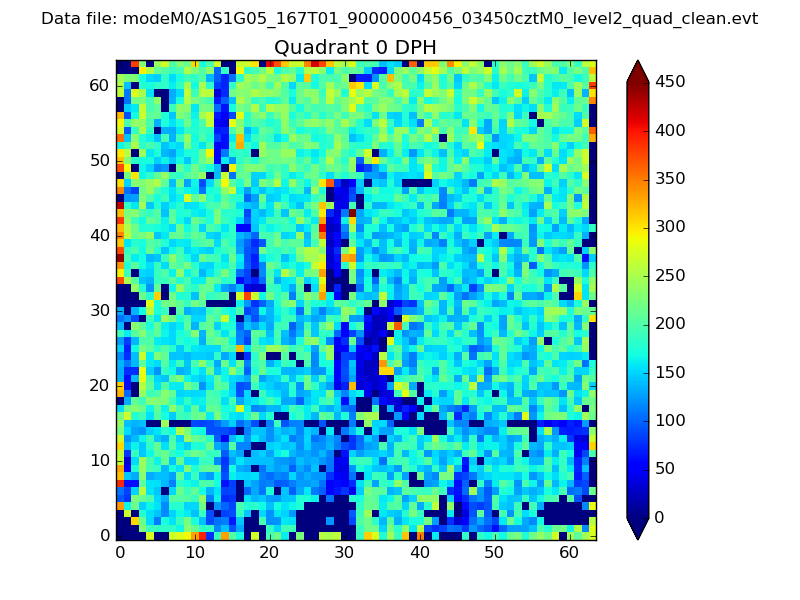 |
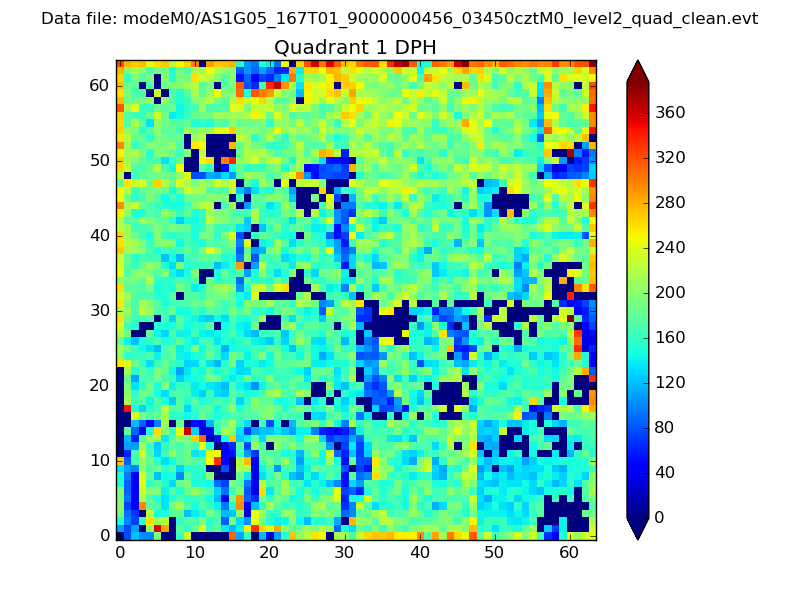 |
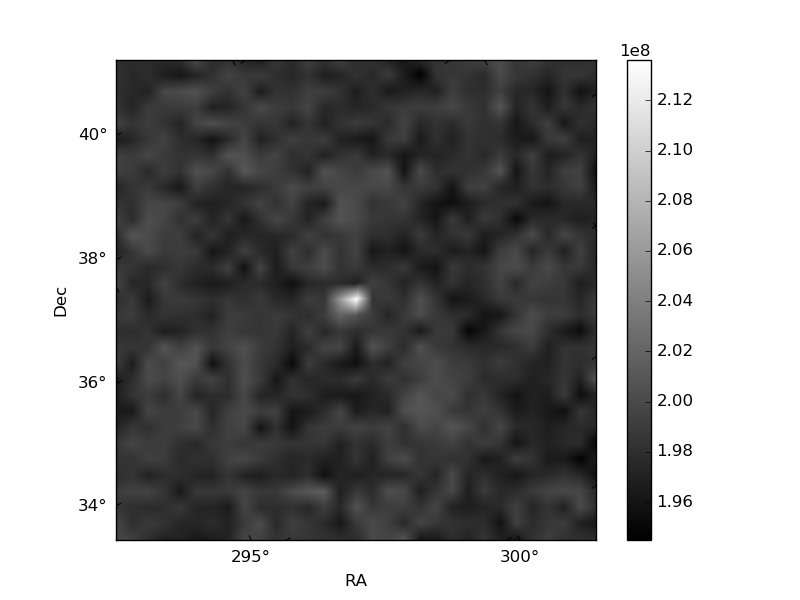
Quadrant B |
|---|---|---|---|
| Quadrant D | 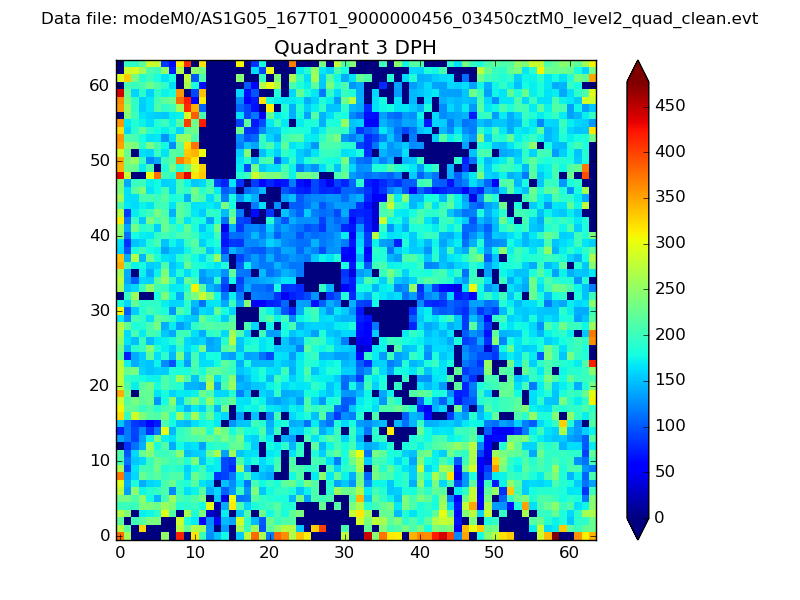 |
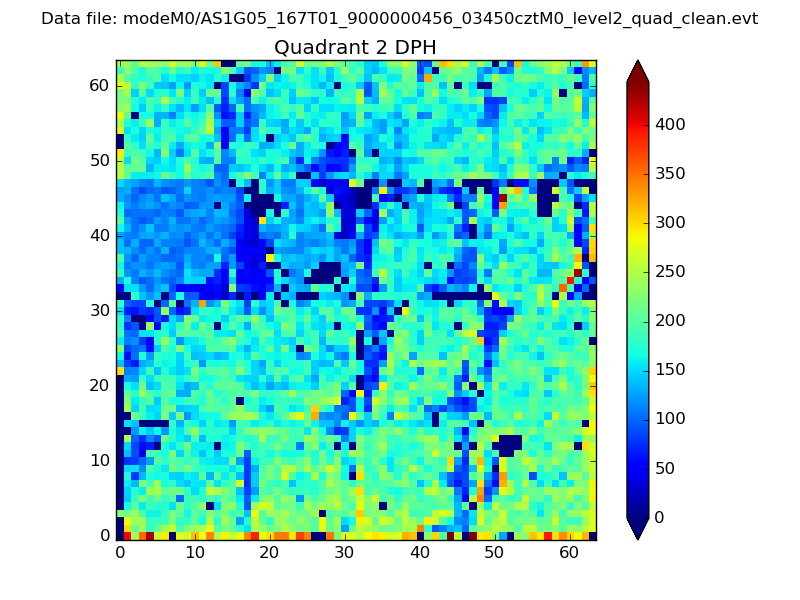 |
Quadrant C |
| Plot type | Count rate plots | Images |
|---|---|---|
| Comparison with Poisson distribution Blue bars denote a histogram of data divided into 1 sec bins. Red curve is a Poisson curve with rate = median count rate of data. |
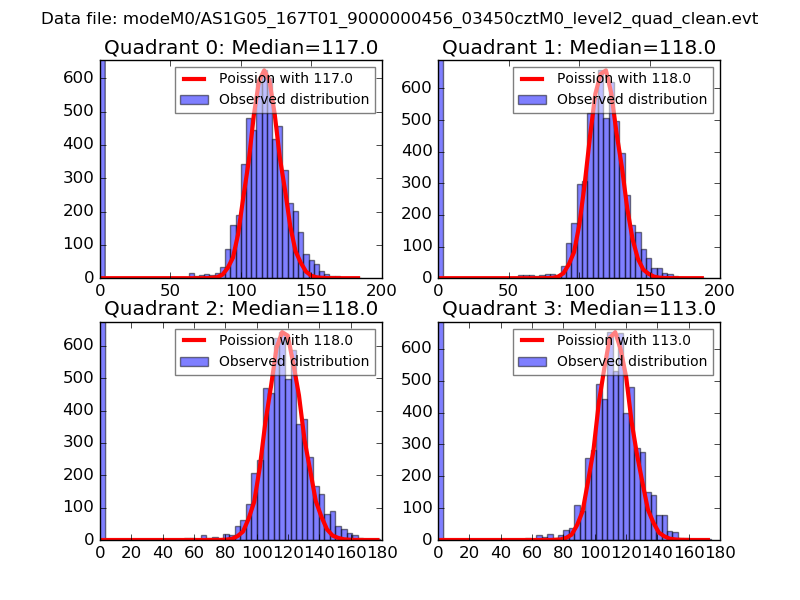 |
 |
| Quadrant-wise count rates Data is divided into 100 sec bins |
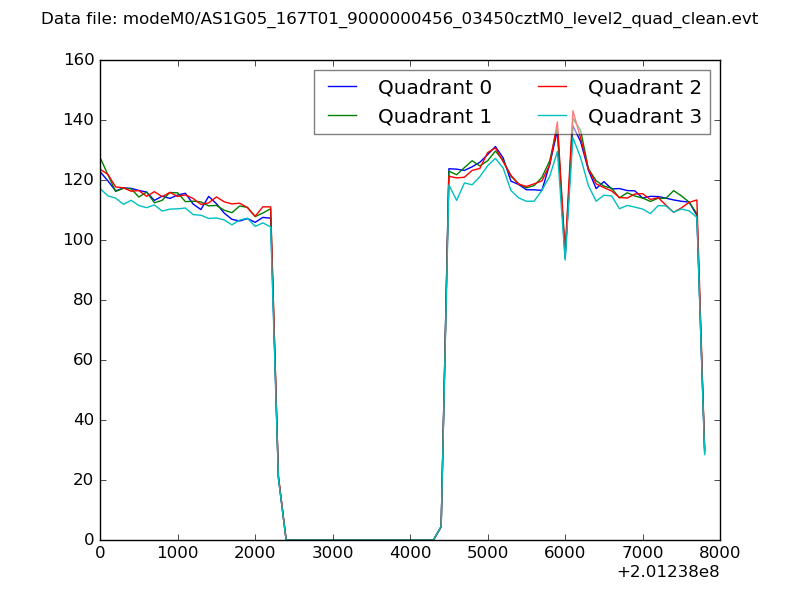 |
|
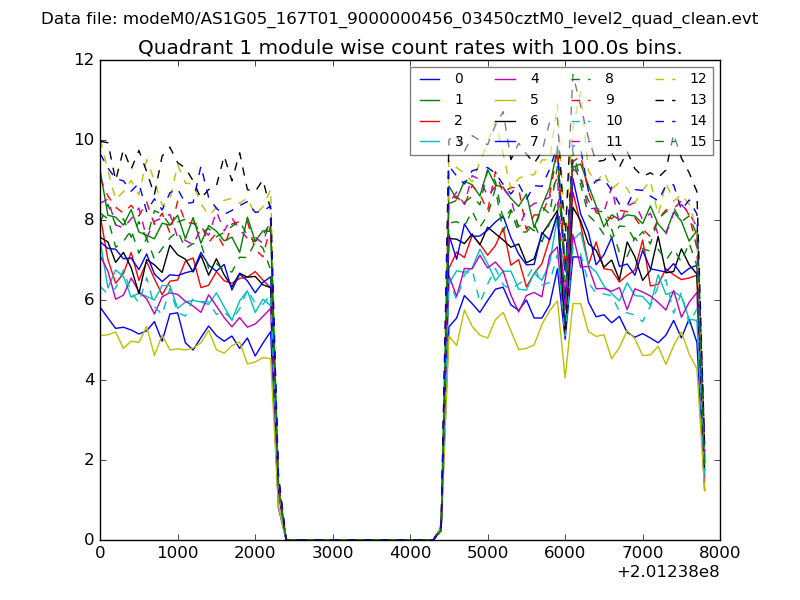
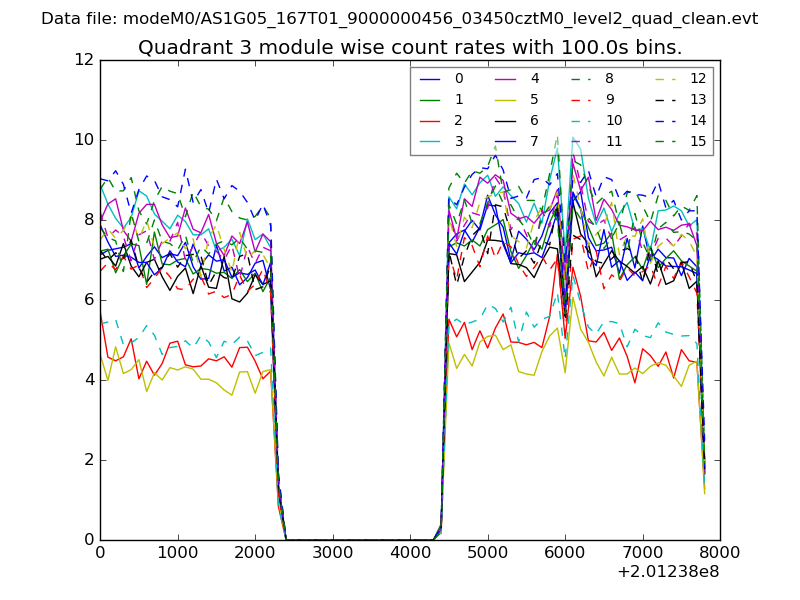
| Module-wise count rates for Quadrant A Data is divided into 100 sec bins |
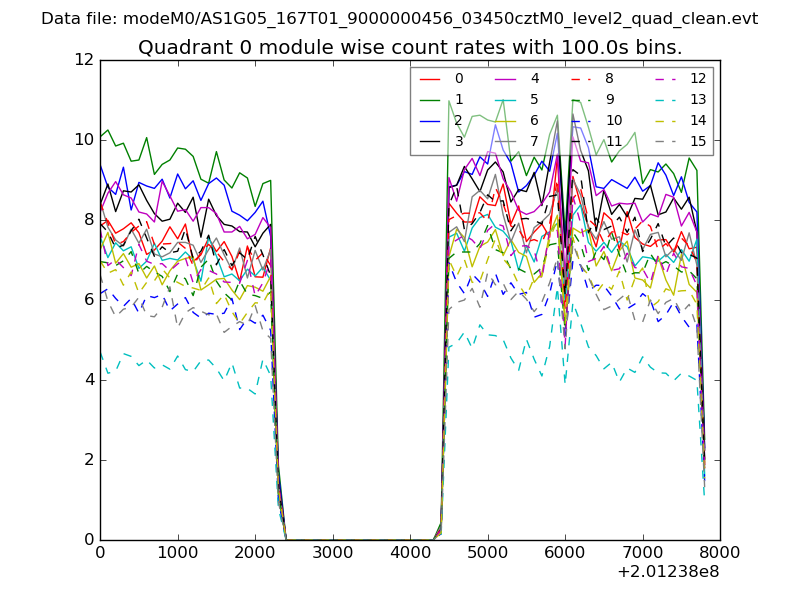 |
 |
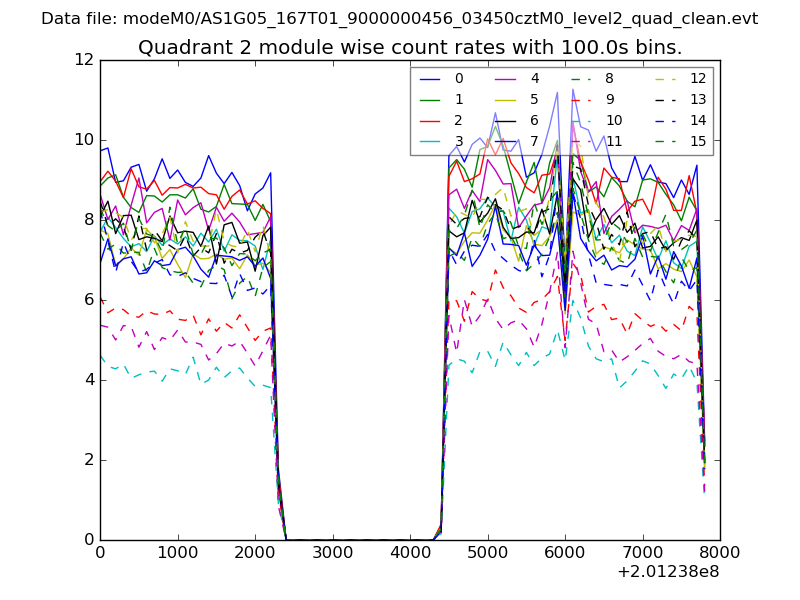
| Module-wise count rates for Quadrant B Data is divided into 100 sec bins |
 |
 |
| Module-wise count rates for Quadrant C Data is divided into 100 sec bins |
 |
 |
| Module-wise count rates for Quadrant D Data is divided into 100 sec bins |
 |
 |
| Parameter | Plot |
|---|---|
| CZT HV Monitor | 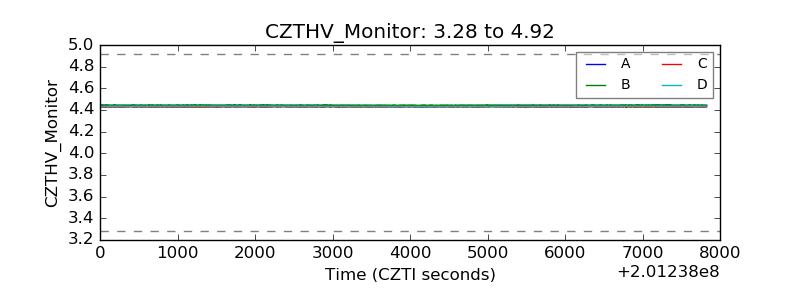 |
| D_VDD | 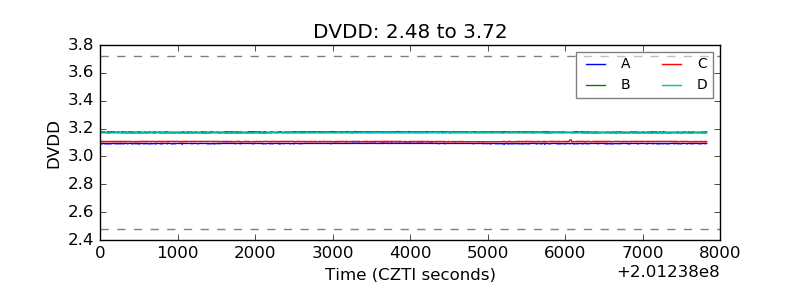 |
| Temperature 1 | 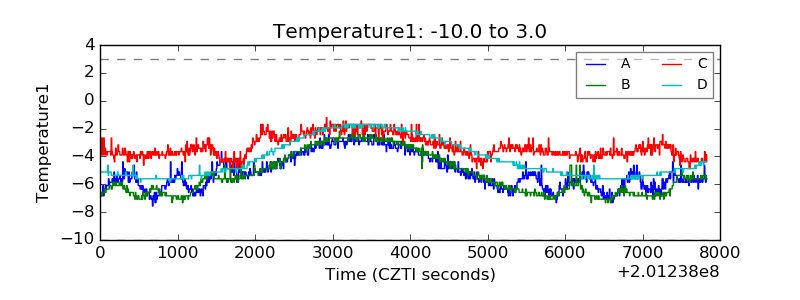 |
| Veto HV Monitor | 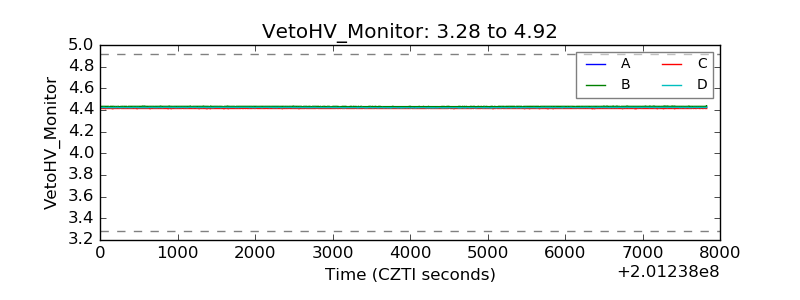 |
| Veto LLD | 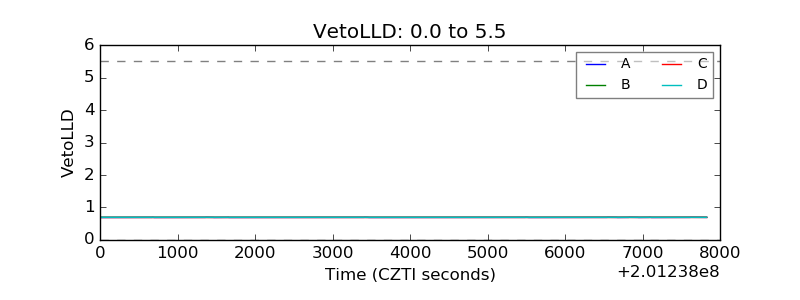 |
| Alpha Counter | 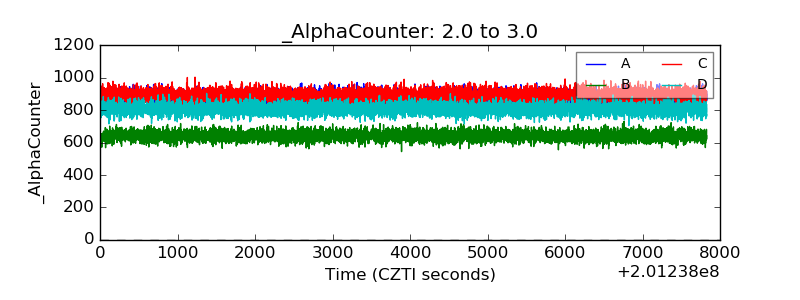 |
| _CPM_Rate | 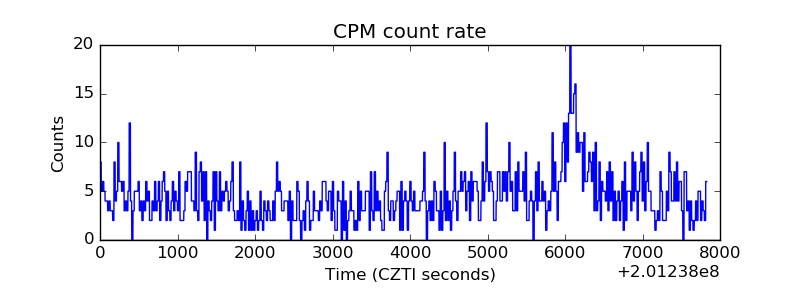 |
| CZT Counter | 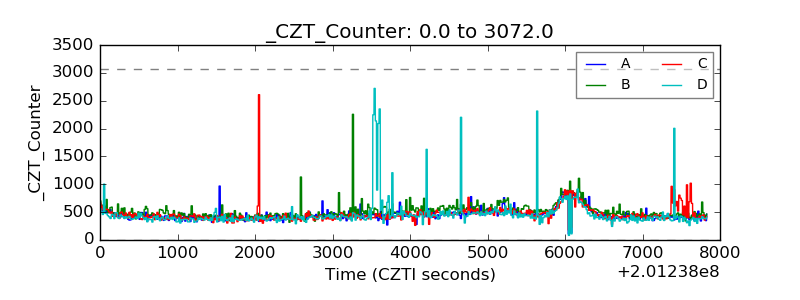 |
| +2.5 Volts monitor | 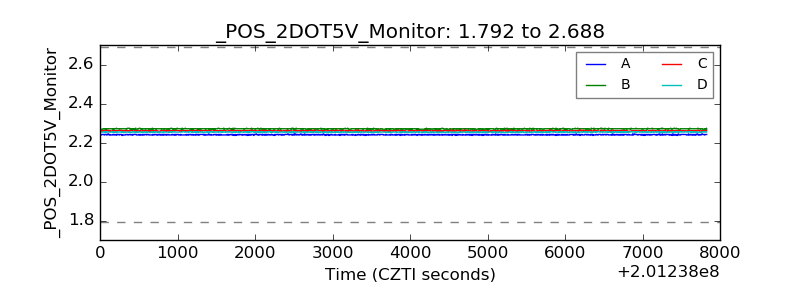 |
| +5 Volts monitor |  |
| _ROLL_ROT | 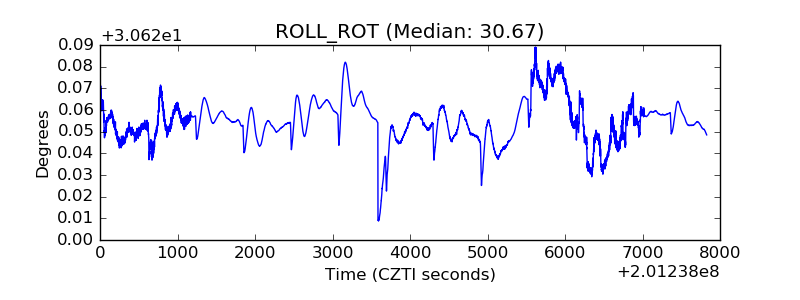 |
| _Roll_DEC | 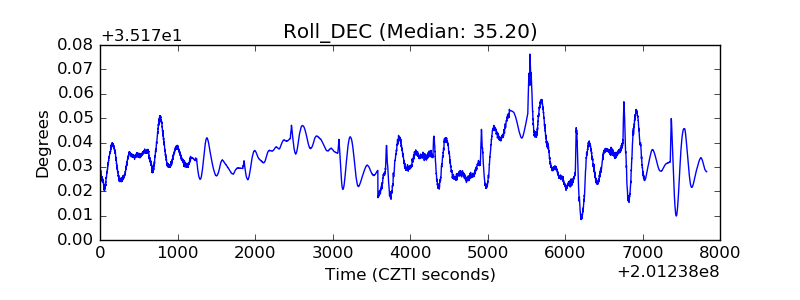 |
| _Roll_RA | 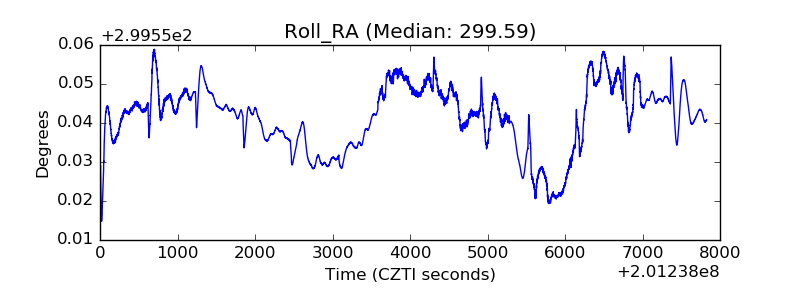 |
| Veto Counter | 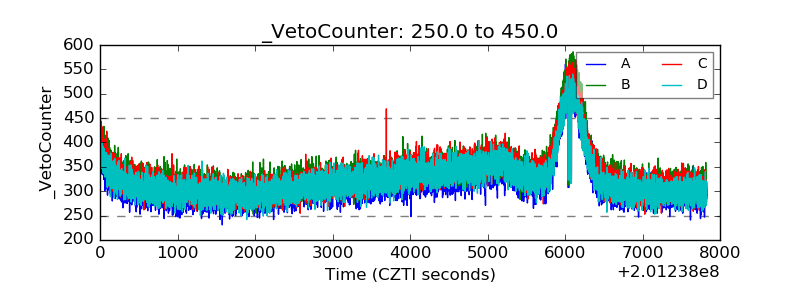 |