| Param | Original file | Final file |
|---|---|---|
| Filename | modeM0/AS1G05_167T01_9000000456_03454cztM0_level2.evt | modeM0/AS1G05_167T01_9000000456_03454cztM0_level2_quad_clean.evt |
| Size (bytes) | 467,228,160 | 64,880,640 |
| Size | 445.6 MB | 61.9 MB |
| Events in quadrant A | 3,394,920 | 375,156 |
| Events in quadrant B | 3,923,095 | 376,911 |
| Events in quadrant C | 3,106,371 | 374,935 |
| Events in quadrant D | 3,263,955 | 363,784 |
| Mode M9 | |||
|---|---|---|---|
| Quadrant | BADHDUFLAG | Total packets | Discarded packets |
| A | 0 | 9 | 0 |
| B | 0 | 9 | 0 |
| C | 0 | 9 | 0 |
| D | 0 | 9 | 0 |
| Mode SS | |||
|---|---|---|---|
| Quadrant | BADHDUFLAG | Total packets | Discarded packets |
| A | 0 | 138 | 0 |
| B | 0 | 138 | 0 |
| C | 0 | 138 | 0 |
| D | 0 | 138 | 0 |
| Mode M0 | |||
|---|---|---|---|
| Quadrant | BADHDUFLAG | Total packets | Discarded packets |
| A | 0 | 14551 | 2 |
| B | 0 | 15856 | 1 |
| C | 0 | 13883 | 1 |
| D | 0 | 14553 | 1 |
| Quadrant | Total seconds | Saturated seconds | Saturation percentage |
|---|---|---|---|
| A | 6794 | 133 | 1.957610% |
| B | 6794 | 86 | 1.265823% |
| C | 6794 | 64 | 0.942008% |
| D | 6794 | 105 | 1.545481% |
Noise dominated data is calculated using 1-second bins in cleaned event files. If a bin has >2000 counts, and if more than 50% of those come from <1% of pixels, then it is considered to be noise-dominated and hence unusable.
| Quadrant | # 1 sec bins | Bins with >0 counts | Bins with >2000 counts | High rate bins dominated by noise | Noise dominated (total time) | Noise dominated (detector-on time) | Marked lightcurve |
|---|---|---|---|---|---|---|---|
| A | 7719 | 6794 | 43 | 43 | 0.56% | 0.63% | 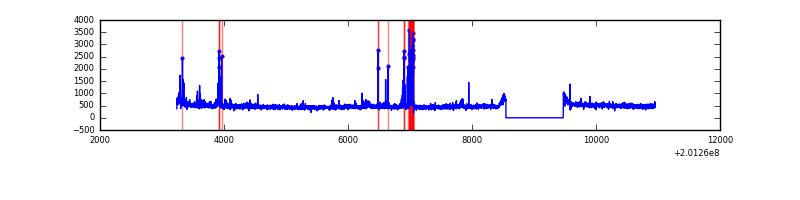 |
| B | 7719 | 6794 | 10 | 10 | 0.13% | 0.15% | 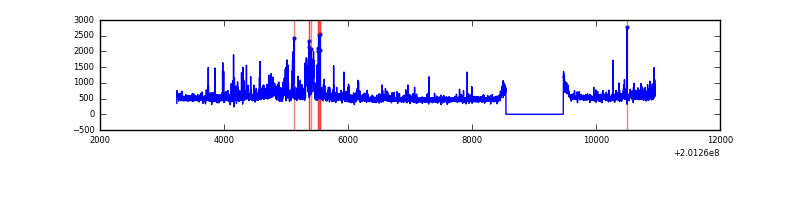 |
| C | 7719 | 6794 | 0 | 0 | 0.00% | 0.00% | 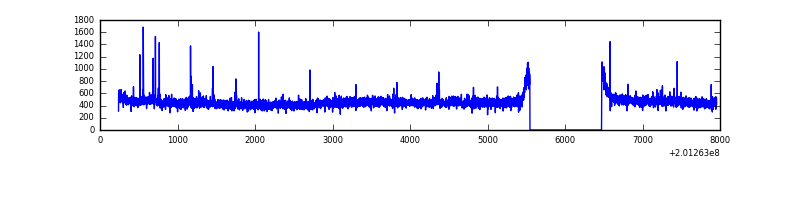 |
| D | 7719 | 6794 | 37 | 37 | 0.48% | 0.54% | 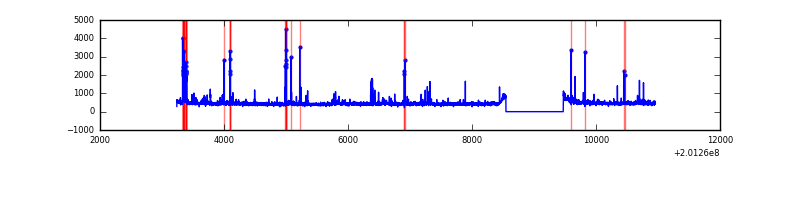 |
Top three noisy pixels from each quadrant. If the there are fewer than three noisy pixels in the level2.evt file, extra rows are filled as -1
| Pixel properties | Quadrant properties | ||||||
|---|---|---|---|---|---|---|---|
| Quadrant | DetID | PixID | Counts | Sigma | Mean | Median | Sigma |
| A | 0 | 50 | 216716 | 1305.05 | 804 | 787 | 165.5 |
| A | 8 | 15 | 57444 | 342.43 | 804 | 787 | 165.5 |
| A | 0 | 31 | 17750 | 102.52 | 804 | 787 | 165.5 |
| B | 15 | 204 | 612432 | 3849.17 | 811 | 792 | 158.9 |
| B | 0 | 228 | 47150 | 291.74 | 811 | 792 | 158.9 |
| B | 14 | 167 | 38558 | 237.67 | 811 | 792 | 158.9 |
| C | 1 | 192 | 17805 | 94.15 | 779 | 785 | 180.8 |
| C | 15 | 208 | 10623 | 54.42 | 779 | 785 | 180.8 |
| C | 14 | 67 | 7785 | 38.72 | 779 | 785 | 180.8 |
| D | 13 | 223 | 207686 | 1087.08 | 778 | 754 | 190.4 |
| D | 4 | 160 | 45666 | 235.94 | 778 | 754 | 190.4 |
| D | 3 | 247 | 25096 | 127.88 | 778 | 754 | 190.4 |
Histogram calculated using DETX and DETY for each event in the final _common_clean file
| Quadrant A | 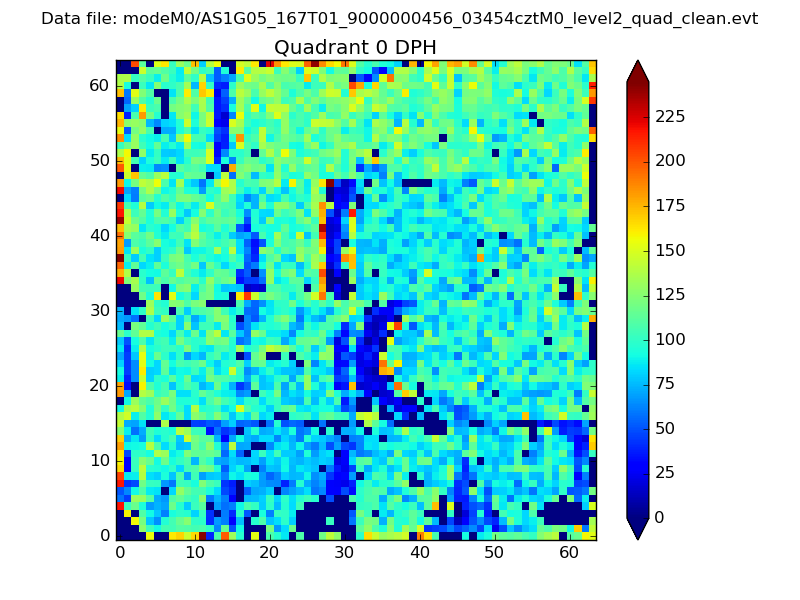 |
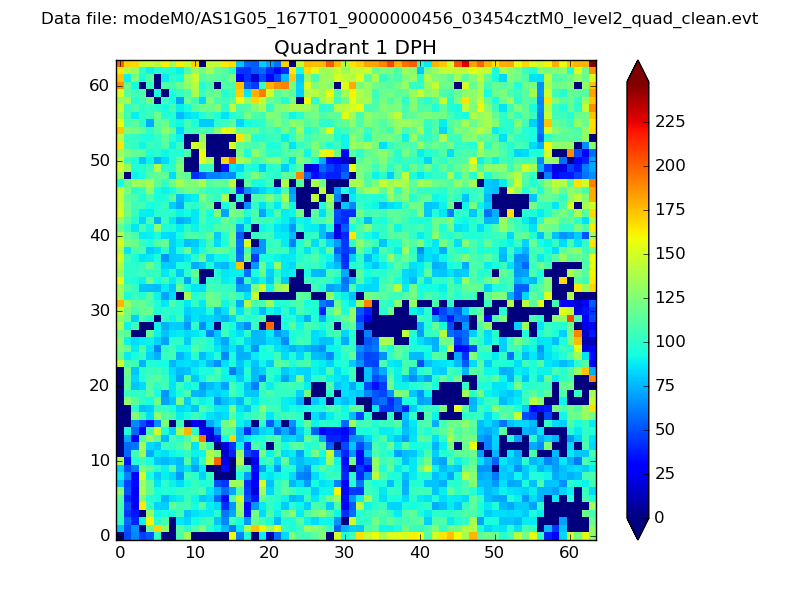 |
Quadrant B |
|---|---|---|---|
| Quadrant D | 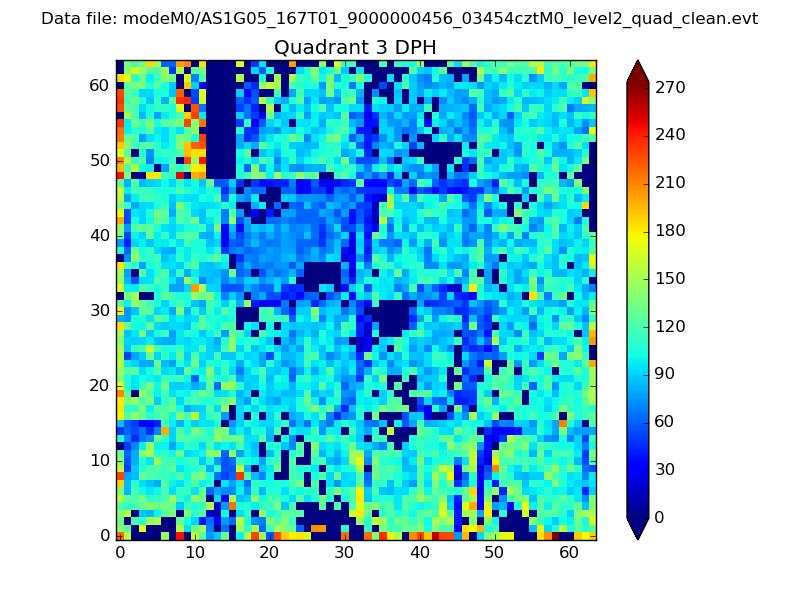 |
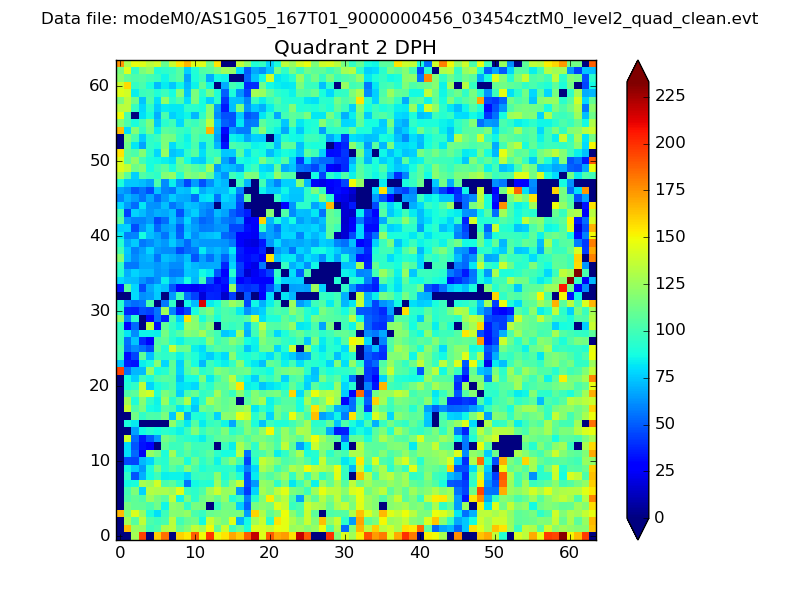 |
Quadrant C |
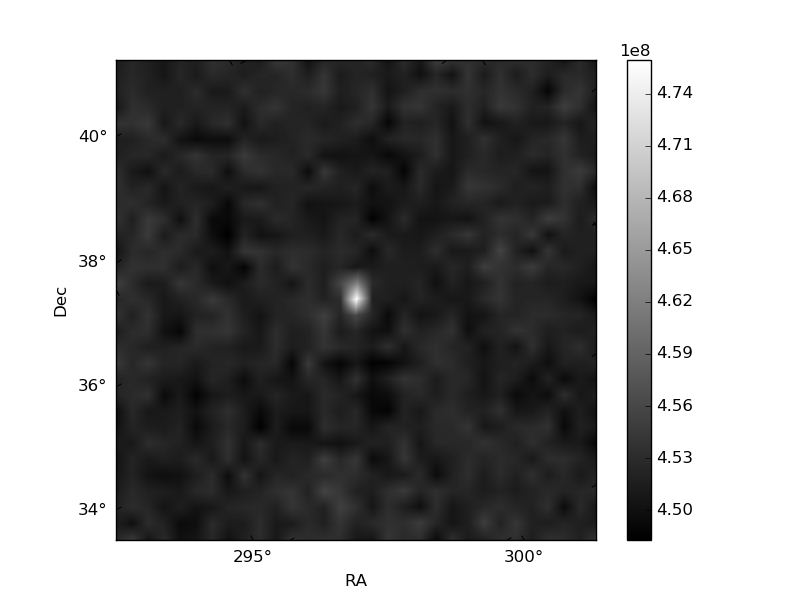
| Plot type | Count rate plots | Images |
|---|---|---|
| Comparison with Poisson distribution Blue bars denote a histogram of data divided into 1 sec bins. Red curve is a Poisson curve with rate = median count rate of data. |
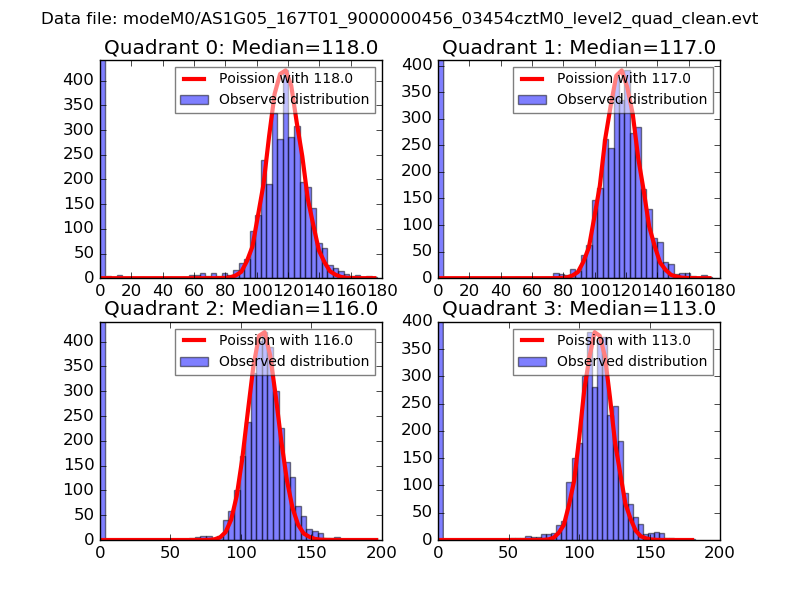 |
 |
| Quadrant-wise count rates Data is divided into 100 sec bins |
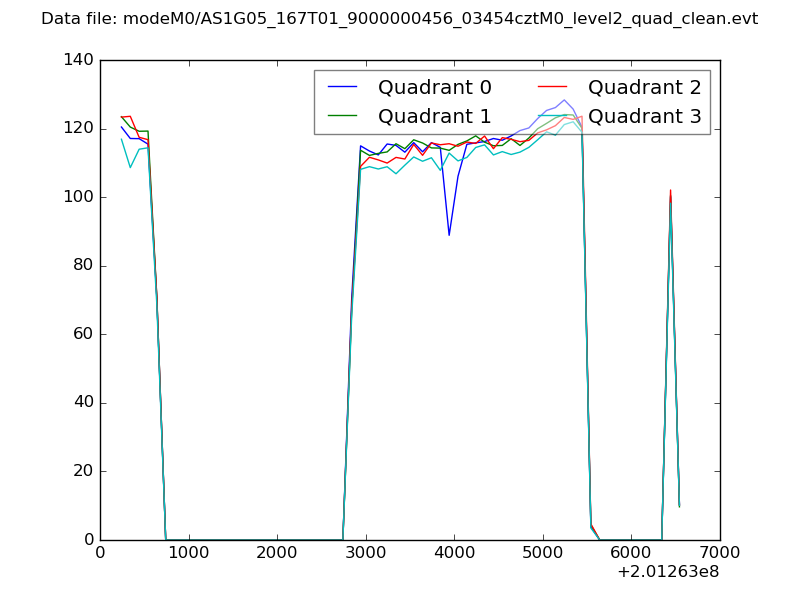 |
|
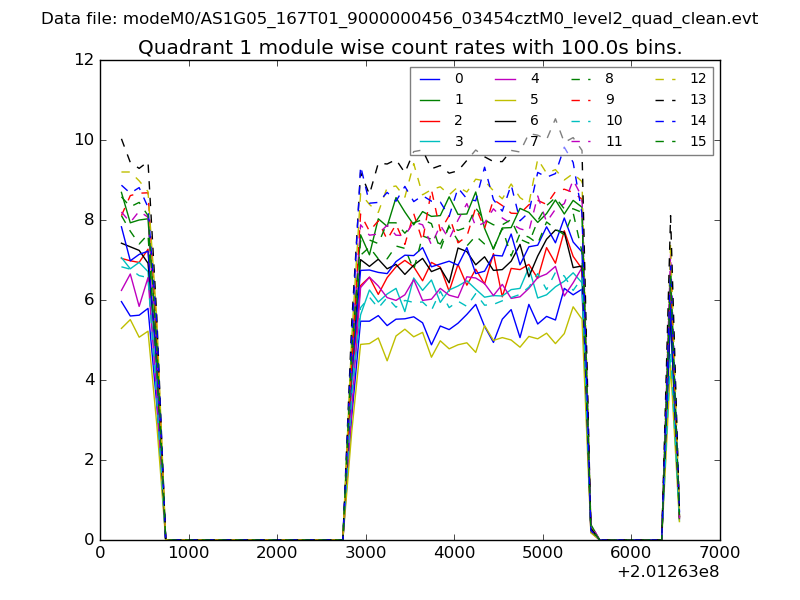
| Module-wise count rates for Quadrant A Data is divided into 100 sec bins |
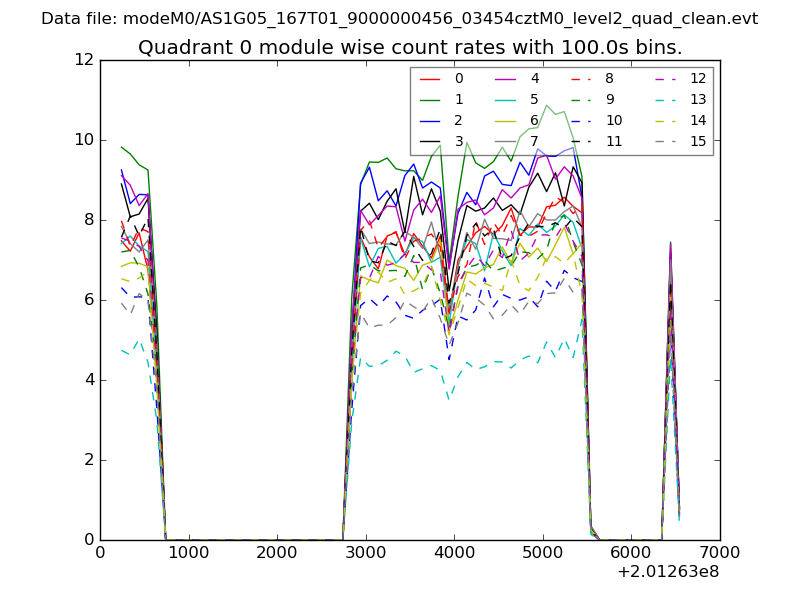 |
 |
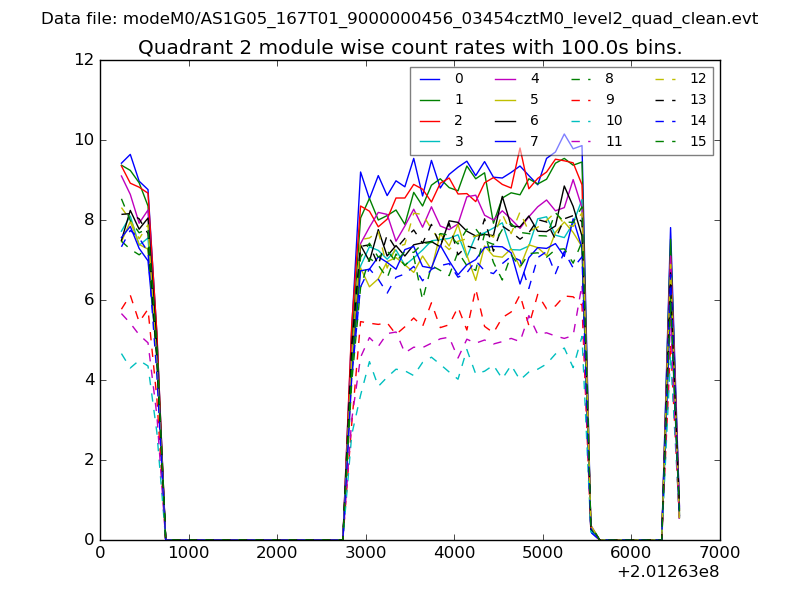
| Module-wise count rates for Quadrant B Data is divided into 100 sec bins |
 |
 |
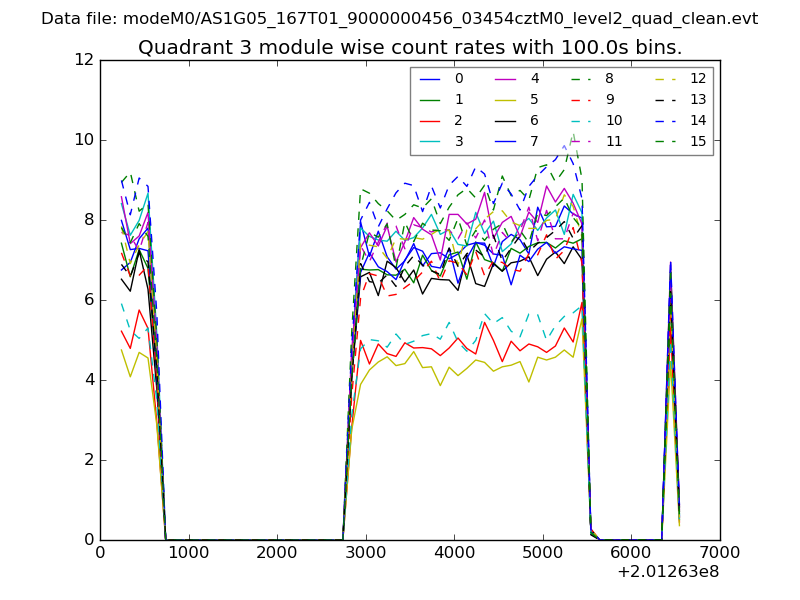
| Module-wise count rates for Quadrant C Data is divided into 100 sec bins |
 |
 |
| Module-wise count rates for Quadrant D Data is divided into 100 sec bins |
 |
 |
| Parameter | Plot |
|---|---|
| CZT HV Monitor | 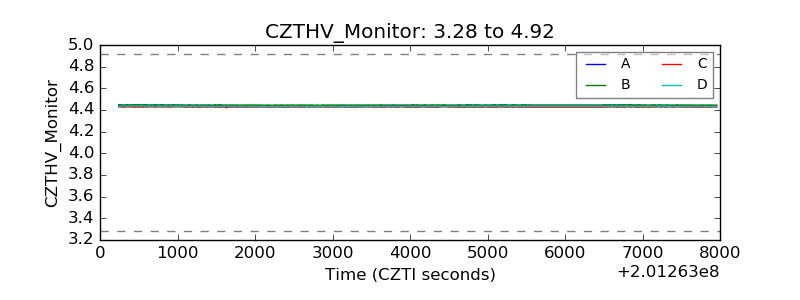 |
| D_VDD | 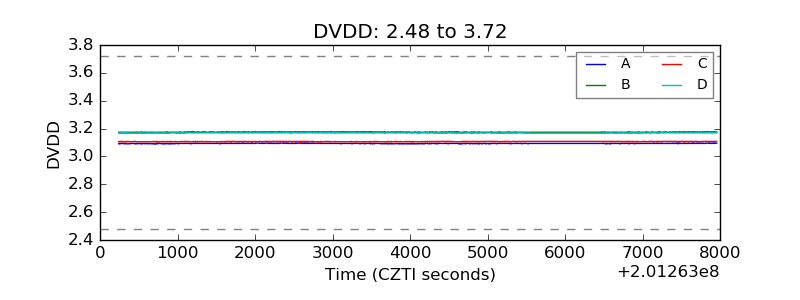 |
| Temperature 1 | 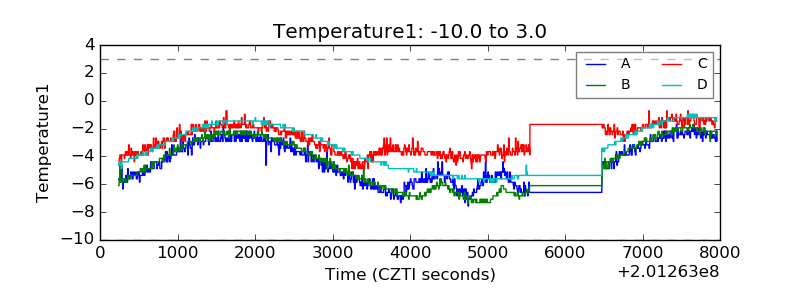 |
| Veto HV Monitor | 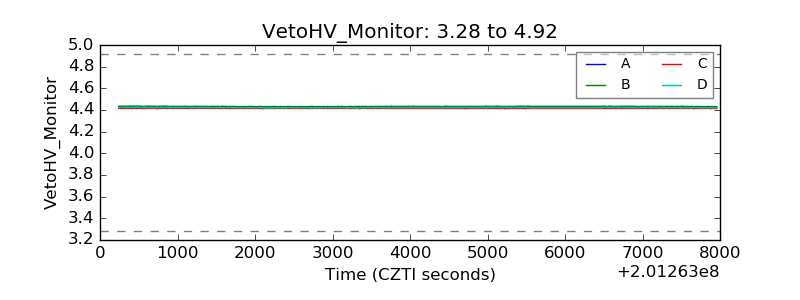 |
| Veto LLD | 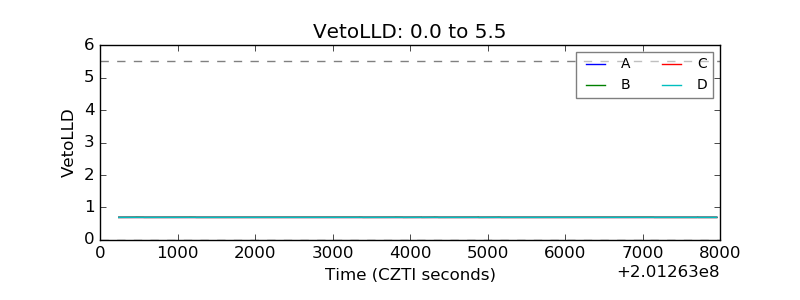 |
| Alpha Counter | 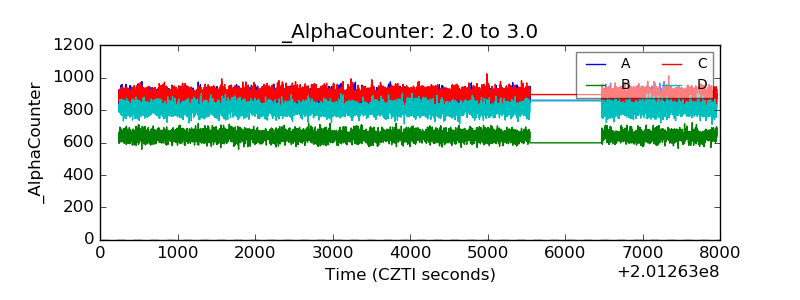 |
| _CPM_Rate | 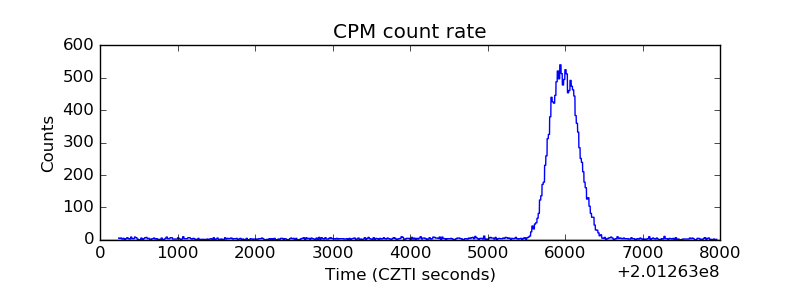 |
| CZT Counter | 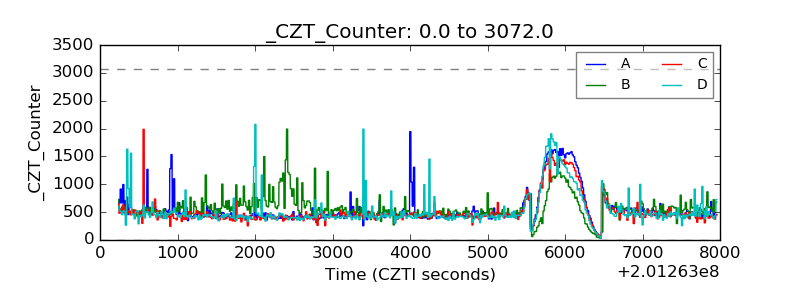 |
| +2.5 Volts monitor |  |
| +5 Volts monitor |  |
| _ROLL_ROT |  |
| _Roll_DEC |  |
| _Roll_RA | 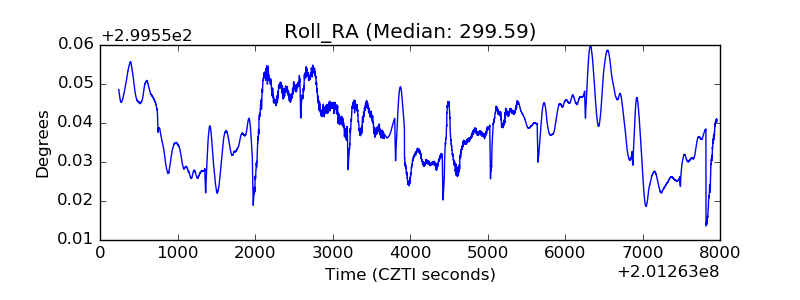 |
| Veto Counter | 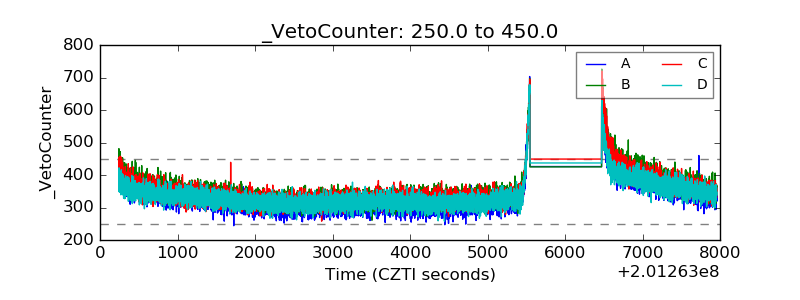 |