| Param | Original file | Final file |
|---|---|---|
| Filename | modeM0/AS1G05_167T01_9000000456_03457cztM0_level2.evt | modeM0/AS1G05_167T01_9000000456_03457cztM0_level2_quad_clean.evt |
| Size (bytes) | 748,768,320 | 122,621,760 |
| Size | 714.1 MB | 116.9 MB |
| Events in quadrant A | 5,213,976 | 751,487 |
| Events in quadrant B | 6,049,357 | 745,603 |
| Events in quadrant C | 5,435,420 | 740,247 |
| Events in quadrant D | 5,237,269 | 719,705 |
| Mode M9 | |||
|---|---|---|---|
| Quadrant | BADHDUFLAG | Total packets | Discarded packets |
| A | 0 | 23 | 0 |
| B | 0 | 23 | 0 |
| C | 0 | 23 | 0 |
| D | 0 | 23 | 0 |
| Mode SS | |||
|---|---|---|---|
| Quadrant | BADHDUFLAG | Total packets | Discarded packets |
| A | 0 | 224 | 0 |
| B | 0 | 224 | 0 |
| C | 0 | 224 | 0 |
| D | 0 | 224 | 0 |
| Mode M0 | |||
|---|---|---|---|
| Quadrant | BADHDUFLAG | Total packets | Discarded packets |
| A | 0 | 22712 | 3 |
| B | 0 | 24924 | 2 |
| C | 0 | 23371 | 2 |
| D | 0 | 23072 | 2 |
| Quadrant | Total seconds | Saturated seconds | Saturation percentage |
|---|---|---|---|
| A | 10923 | 103 | 0.942964% |
| B | 10923 | 127 | 1.162684% |
| C | 10923 | 140 | 1.281699% |
| D | 10923 | 114 | 1.043669% |
Noise dominated data is calculated using 1-second bins in cleaned event files. If a bin has >2000 counts, and if more than 50% of those come from <1% of pixels, then it is considered to be noise-dominated and hence unusable.
| Quadrant | # 1 sec bins | Bins with >0 counts | Bins with >2000 counts | High rate bins dominated by noise | Noise dominated (total time) | Noise dominated (detector-on time) | Marked lightcurve |
|---|---|---|---|---|---|---|---|
| A | 13243 | 10923 | 1 | 1 | 0.01% | 0.01% | 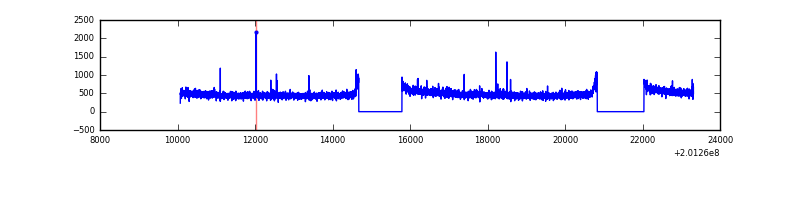 |
| B | 13243 | 10923 | 10 | 10 | 0.08% | 0.09% | 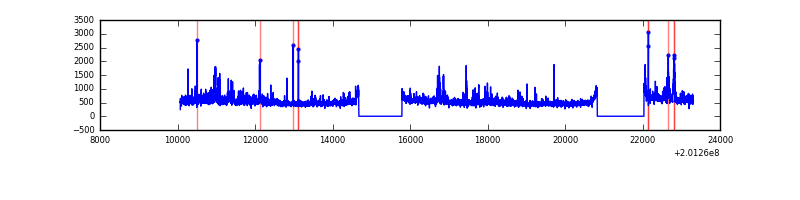 |
| C | 13243 | 10925 | 43 | 43 | 0.32% | 0.39% | 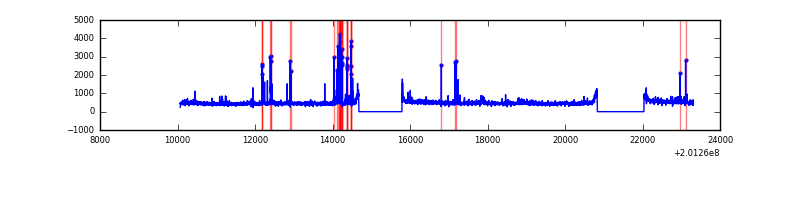 |
| D | 13243 | 10923 | 31 | 31 | 0.23% | 0.28% | 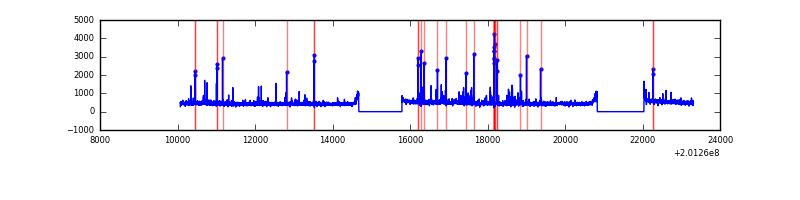 |
Top three noisy pixels from each quadrant. If the there are fewer than three noisy pixels in the level2.evt file, extra rows are filled as -1
| Pixel properties | Quadrant properties | ||||||
|---|---|---|---|---|---|---|---|
| Quadrant | DetID | PixID | Counts | Sigma | Mean | Median | Sigma |
| A | 8 | 15 | 51708 | 185.86 | 1331 | 1306 | 271.2 |
| A | 0 | 31 | 15807 | 53.47 | 1331 | 1306 | 271.2 |
| A | 12 | 194 | 13915 | 46.5 | 1331 | 1306 | 271.2 |
| B | 15 | 204 | 541362 | 2105.47 | 1344 | 1316 | 256.5 |
| B | 7 | 252 | 100684 | 387.4 | 1344 | 1316 | 256.5 |
| B | 0 | 228 | 49878 | 189.33 | 1344 | 1316 | 256.5 |
| C | 15 | 208 | 220383 | 736.34 | 1294 | 1305 | 297.5 |
| C | 1 | 192 | 54119 | 177.51 | 1294 | 1305 | 297.5 |
| C | 14 | 234 | 45268 | 147.76 | 1294 | 1305 | 297.5 |
| D | 4 | 160 | 102833 | 325.76 | 1290 | 1254 | 311.8 |
| D | 13 | 223 | 93713 | 296.51 | 1290 | 1254 | 311.8 |
| D | 3 | 247 | 49557 | 154.9 | 1290 | 1254 | 311.8 |
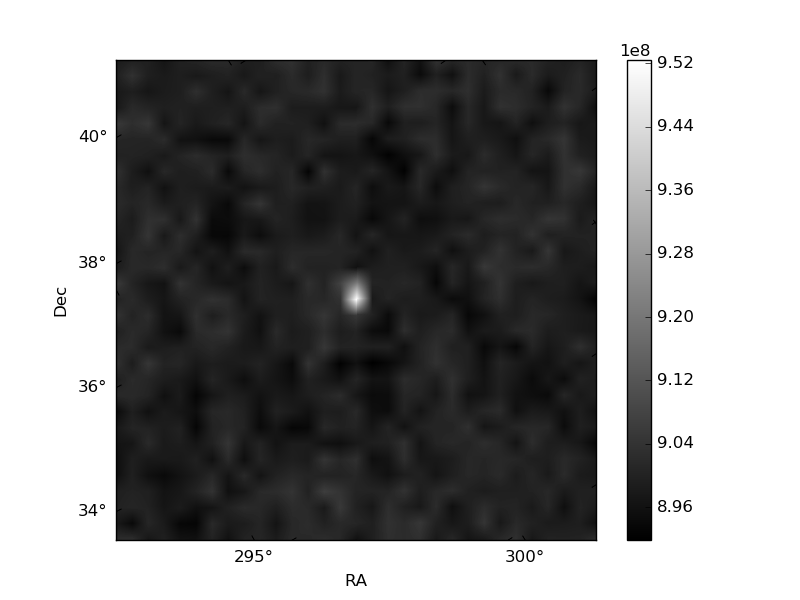
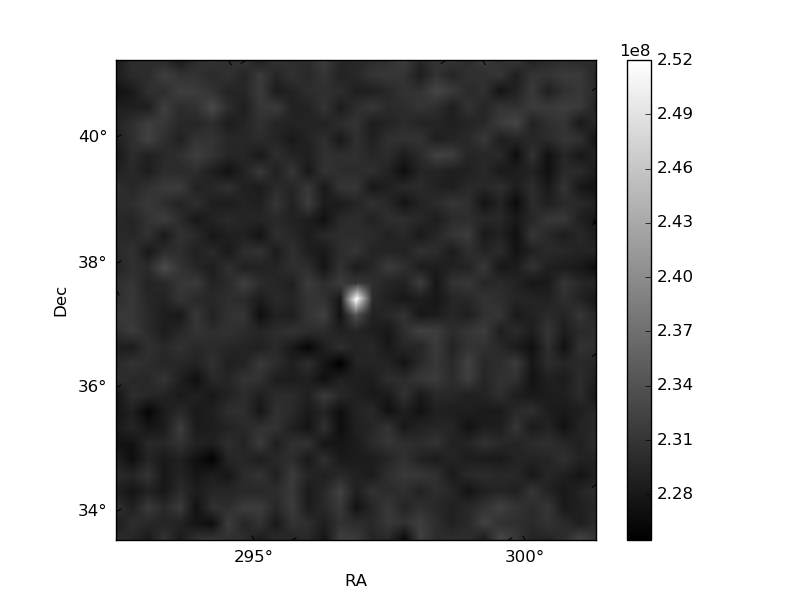
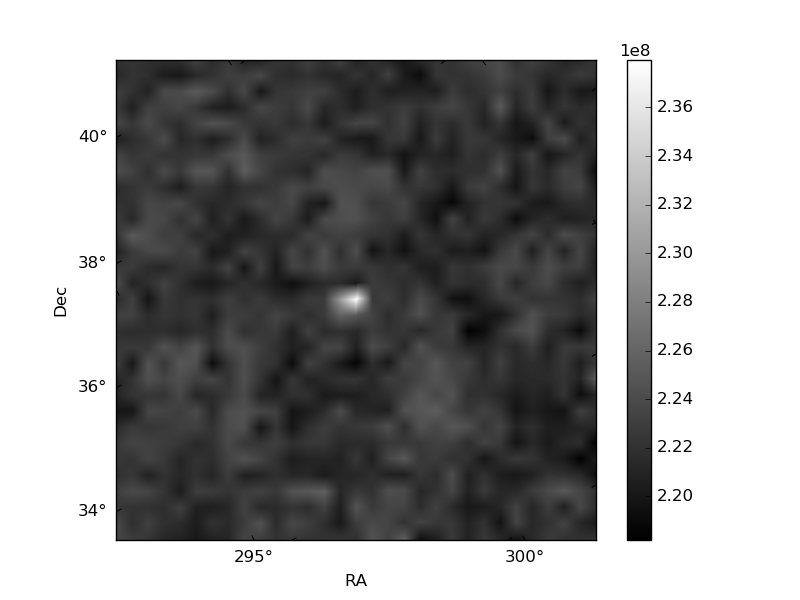
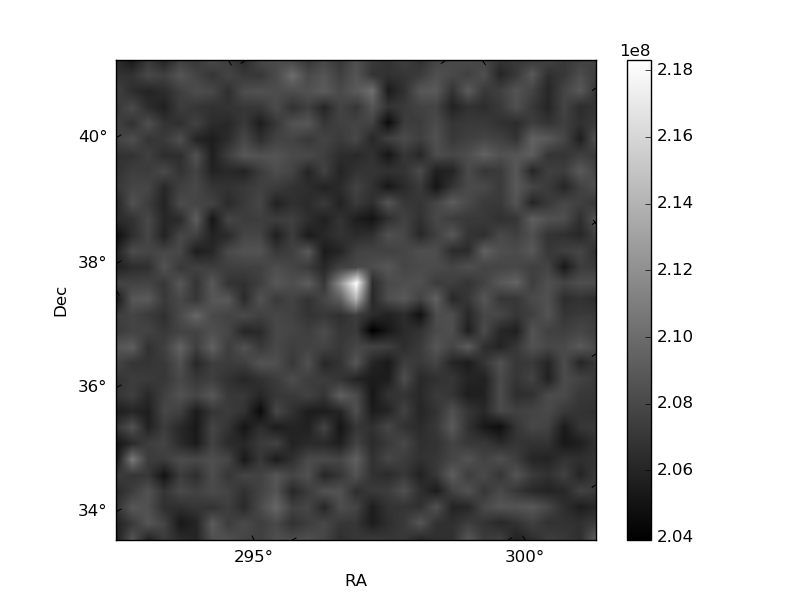
Histogram calculated using DETX and DETY for each event in the final _common_clean file
| Quadrant A | 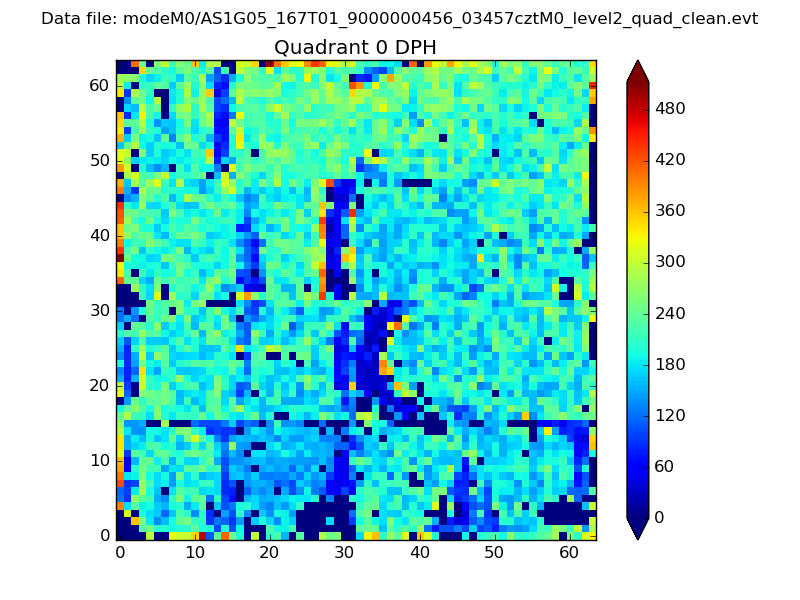 |
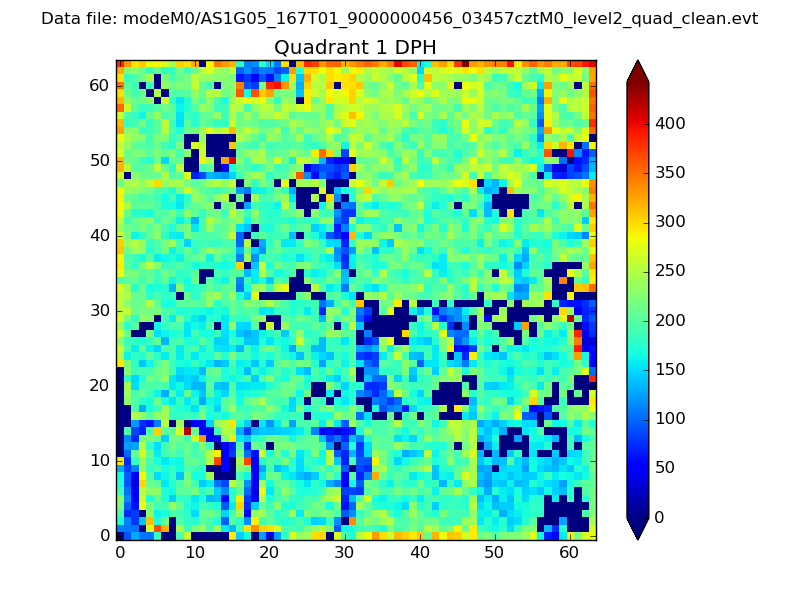 |
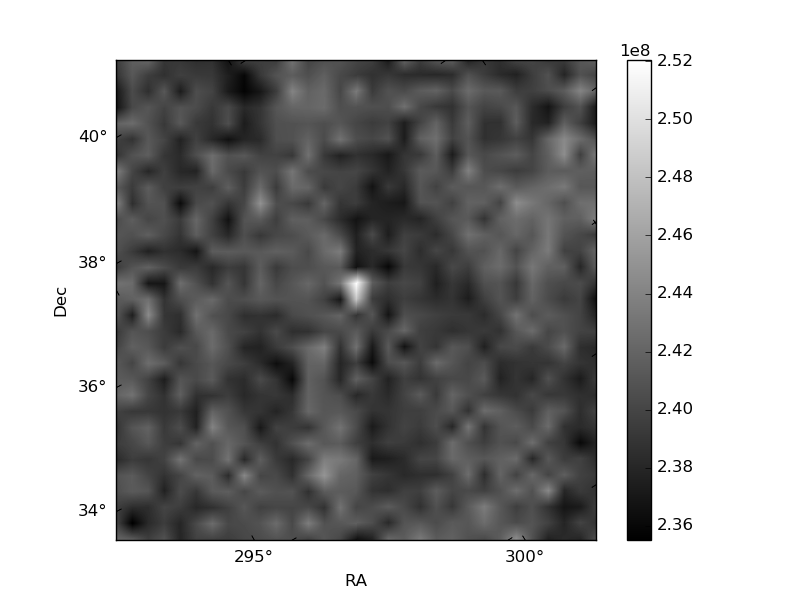
Quadrant B |
|---|---|---|---|
| Quadrant D | 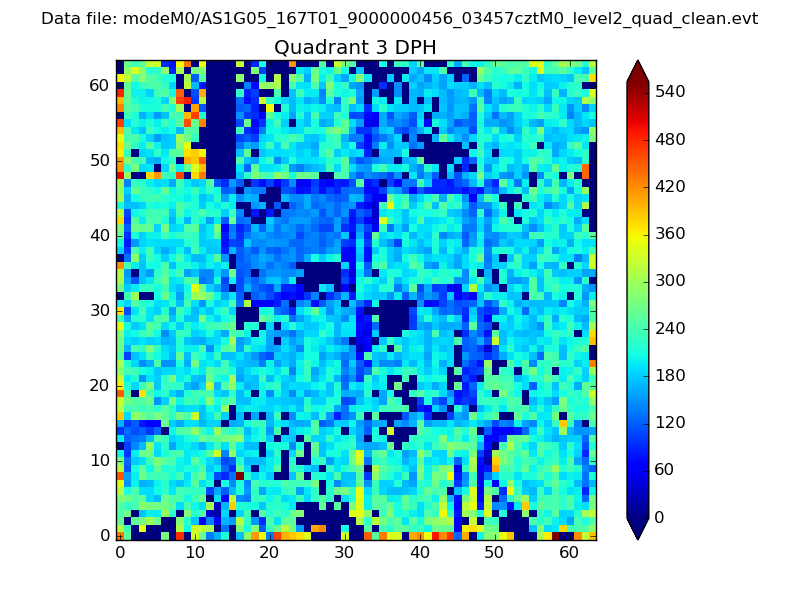 |
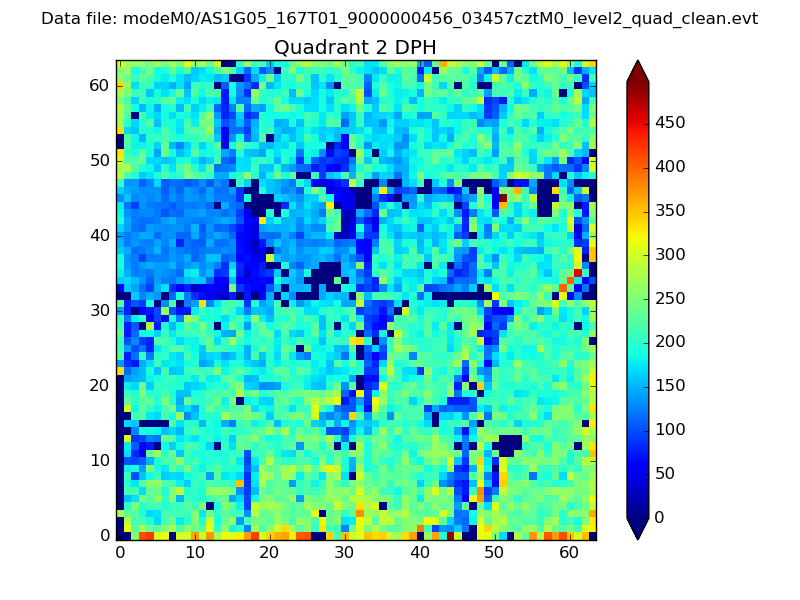 |
Quadrant C |
| Plot type | Count rate plots | Images |
|---|---|---|
| Comparison with Poisson distribution Blue bars denote a histogram of data divided into 1 sec bins. Red curve is a Poisson curve with rate = median count rate of data. |
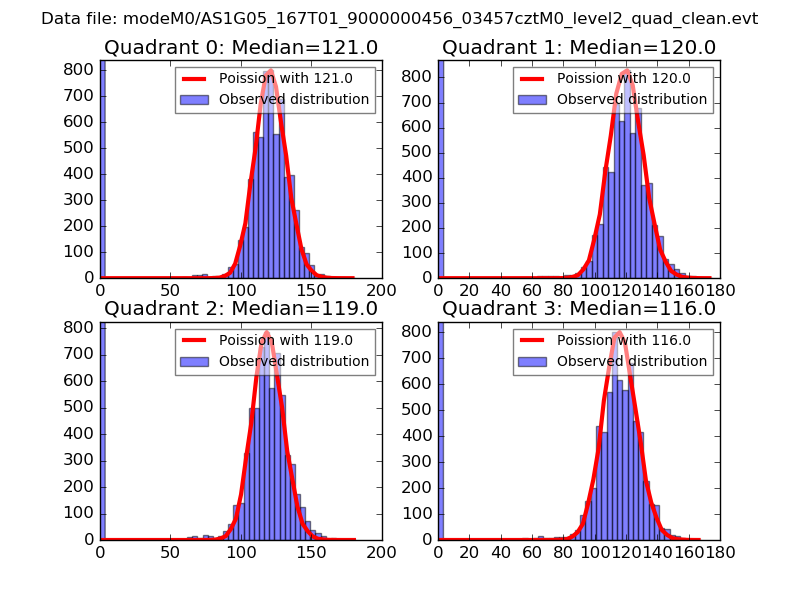 |
 |
| Quadrant-wise count rates Data is divided into 100 sec bins |
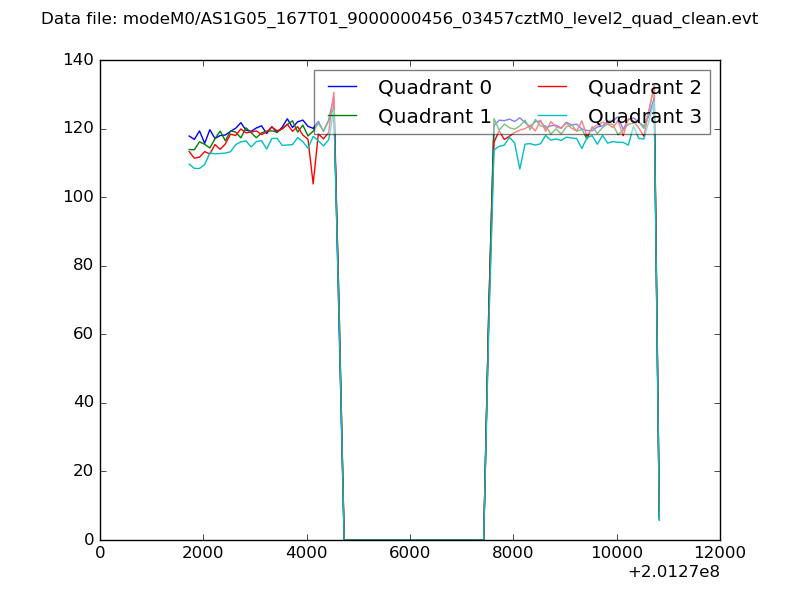 |
|
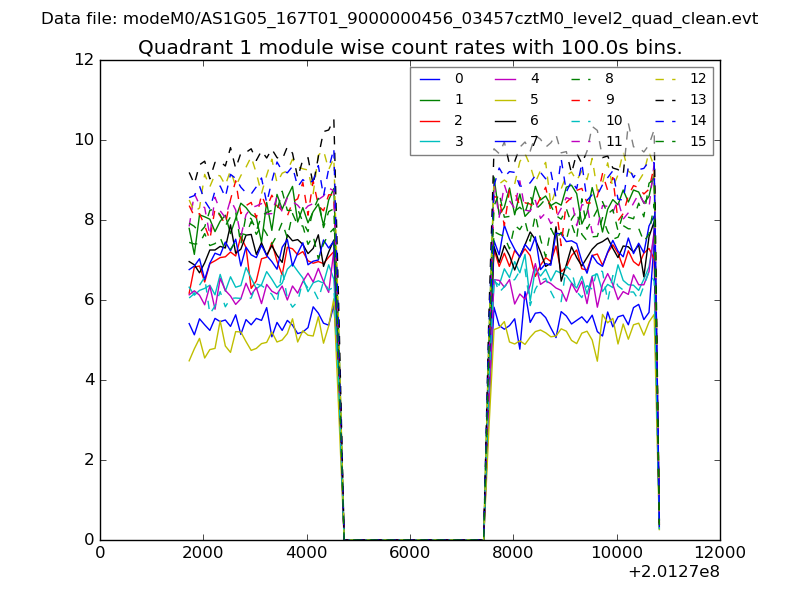
| Module-wise count rates for Quadrant A Data is divided into 100 sec bins |
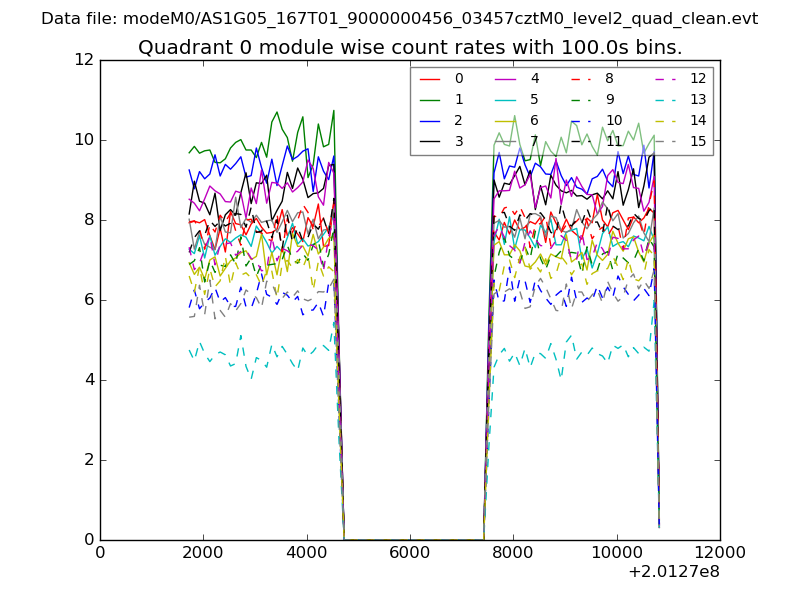 |
 |
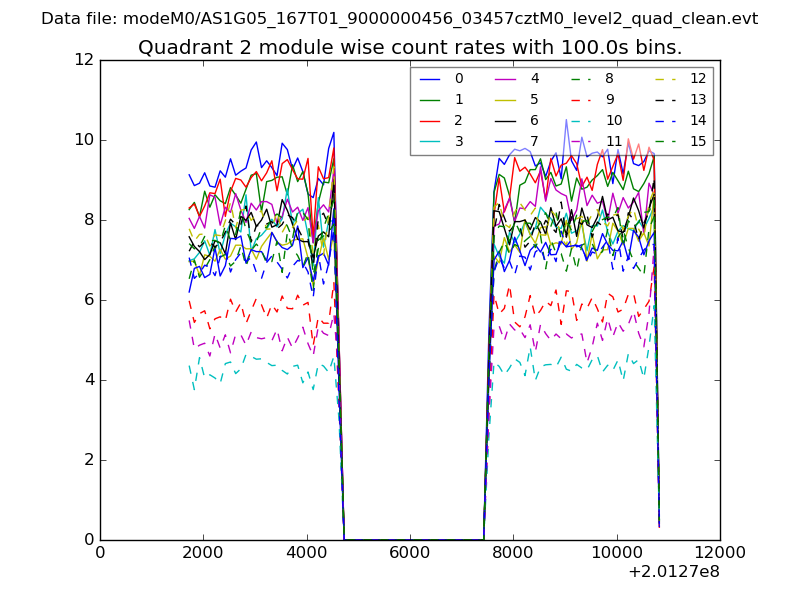
| Module-wise count rates for Quadrant B Data is divided into 100 sec bins |
 |
 |
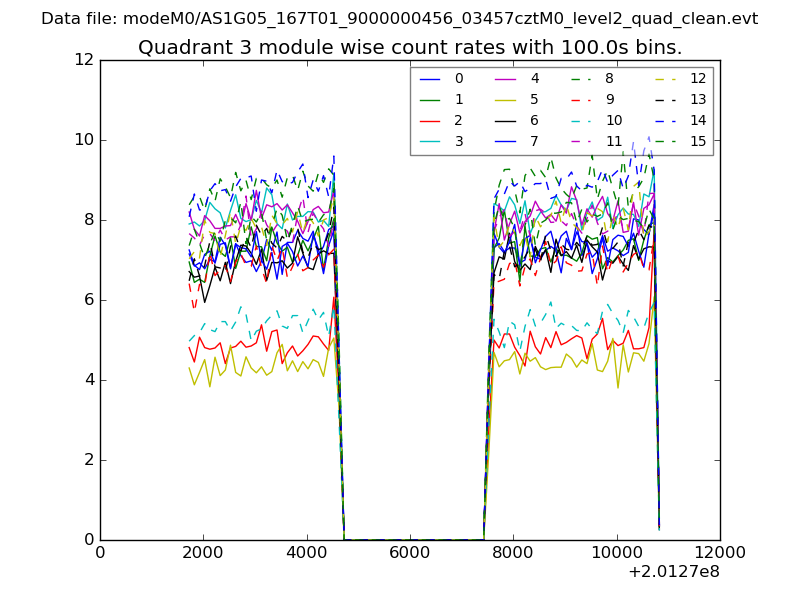
| Module-wise count rates for Quadrant C Data is divided into 100 sec bins |
 |
 |
| Module-wise count rates for Quadrant D Data is divided into 100 sec bins |
 |
 |
| Parameter | Plot |
|---|---|
| CZT HV Monitor | 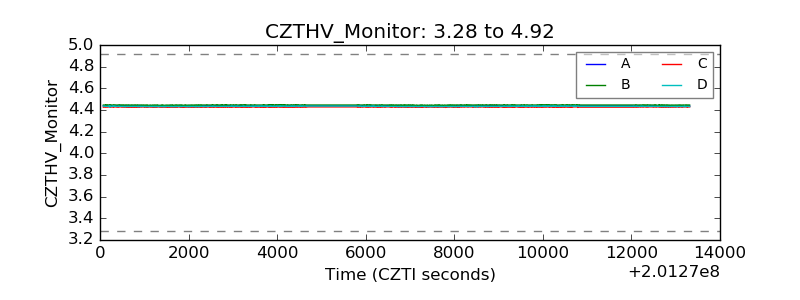 |
| D_VDD | 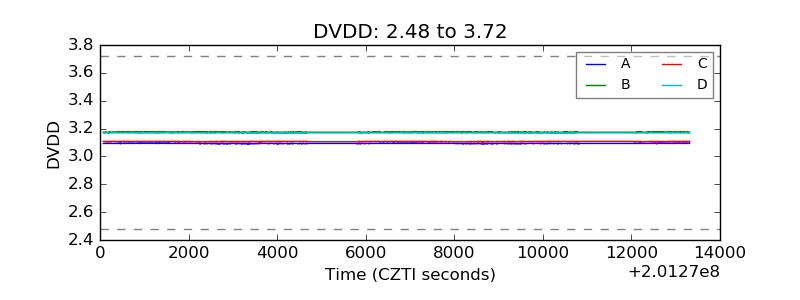 |
| Temperature 1 | 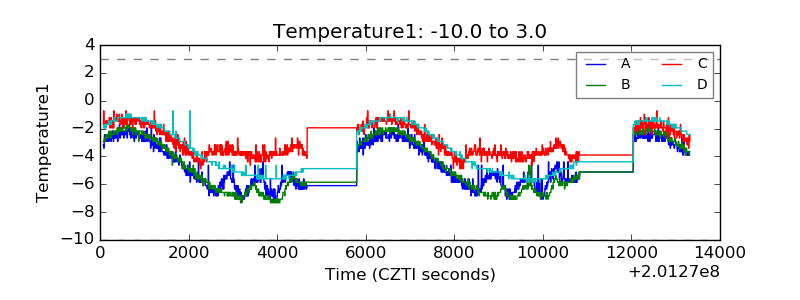 |
| Veto HV Monitor | 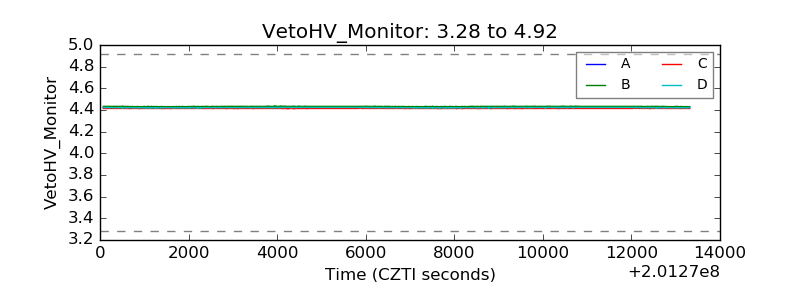 |
| Veto LLD | 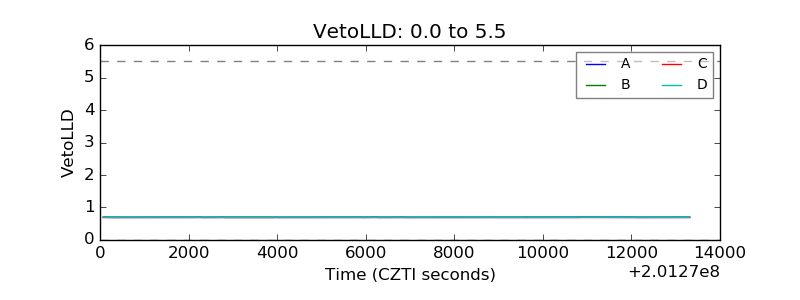 |
| Alpha Counter | 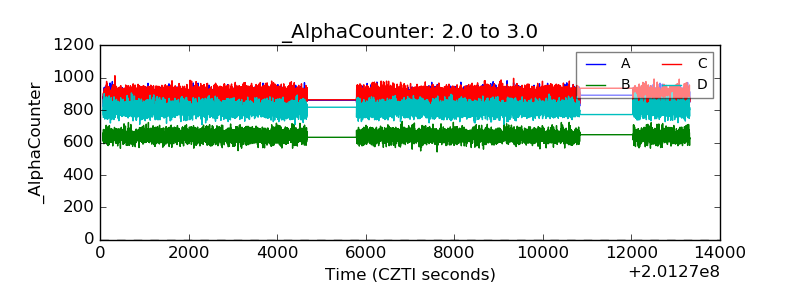 |
| _CPM_Rate | 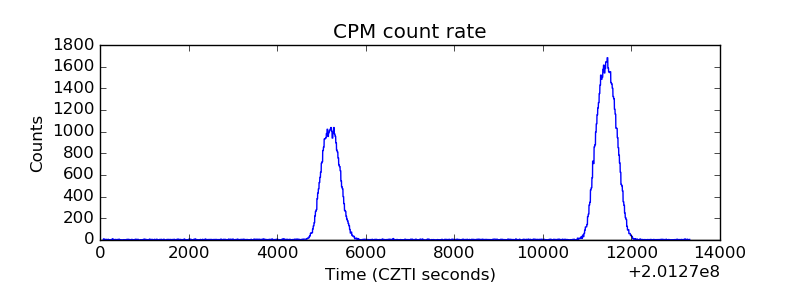 |
| CZT Counter | 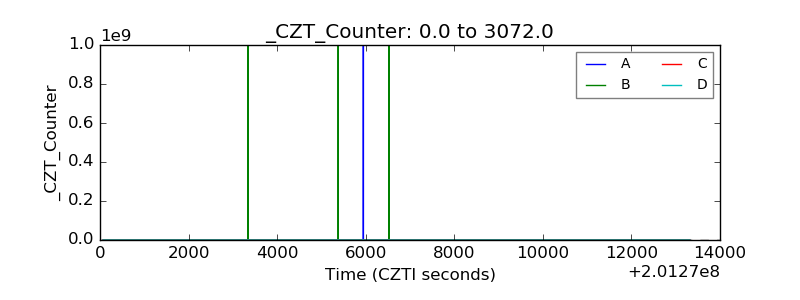 |
| +2.5 Volts monitor |  |
| +5 Volts monitor |  |
| _ROLL_ROT | 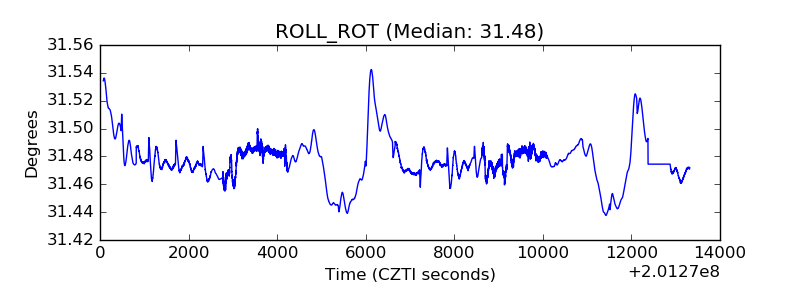 |
| _Roll_DEC | 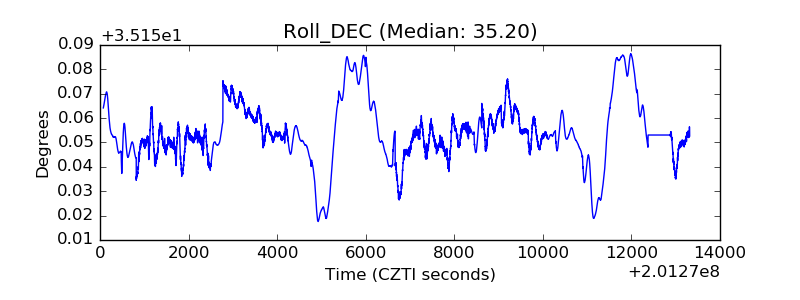 |
| _Roll_RA | 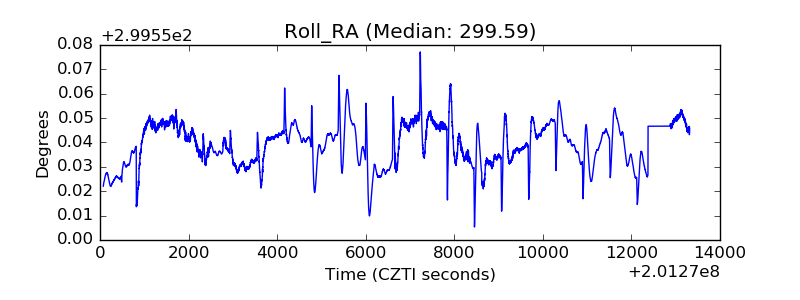 |
| Veto Counter | 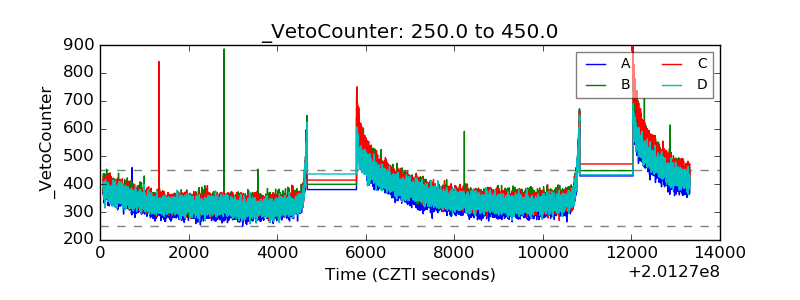 |