| Param | Original file | Final file |
|---|---|---|
| Filename | modeM0/AS1G05_167T01_9000000456_03458cztM0_level2.evt | modeM0/AS1G05_167T01_9000000456_03458cztM0_level2_quad_clean.evt |
| Size (bytes) | 452,442,240 | 77,408,640 |
| Size | 431.5 MB | 73.8 MB |
| Events in quadrant A | 3,241,940 | 482,113 |
| Events in quadrant B | 3,591,077 | 484,471 |
| Events in quadrant C | 3,238,540 | 480,668 |
| Events in quadrant D | 3,209,560 | 463,918 |
| Mode M9 | |||
|---|---|---|---|
| Quadrant | BADHDUFLAG | Total packets | Discarded packets |
| A | 0 | 22 | 0 |
| B | 0 | 22 | 0 |
| C | 0 | 22 | 0 |
| D | 0 | 23 | 0 |
| Mode SS | |||
|---|---|---|---|
| Quadrant | BADHDUFLAG | Total packets | Discarded packets |
| A | 0 | 126 | 0 |
| B | 0 | 126 | 0 |
| C | 0 | 126 | 0 |
| D | 0 | 126 | 0 |
| Mode M0 | |||
|---|---|---|---|
| Quadrant | BADHDUFLAG | Total packets | Discarded packets |
| A | 0 | 13578 | 3 |
| B | 0 | 14742 | 2 |
| C | 0 | 13437 | 2 |
| D | 0 | 13690 | 2 |
| Quadrant | Total seconds | Saturated seconds | Saturation percentage |
|---|---|---|---|
| A | 6200 | 67 | 1.080645% |
| B | 6200 | 74 | 1.193548% |
| C | 6200 | 74 | 1.193548% |
| D | 6200 | 101 | 1.629032% |
Noise dominated data is calculated using 1-second bins in cleaned event files. If a bin has >2000 counts, and if more than 50% of those come from <1% of pixels, then it is considered to be noise-dominated and hence unusable.
| Quadrant | # 1 sec bins | Bins with >0 counts | Bins with >2000 counts | High rate bins dominated by noise | Noise dominated (total time) | Noise dominated (detector-on time) | Marked lightcurve |
|---|---|---|---|---|---|---|---|
| A | 7500 | 6201 | 9 | 9 | 0.12% | 0.15% | 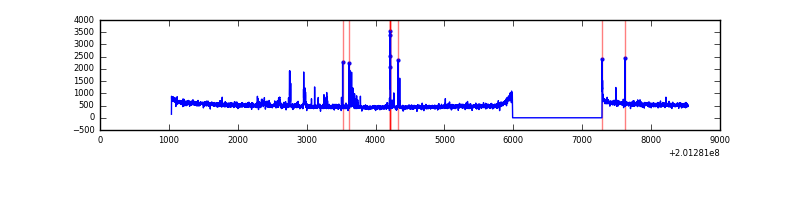 |
| B | 7500 | 6201 | 5 | 5 | 0.07% | 0.08% | 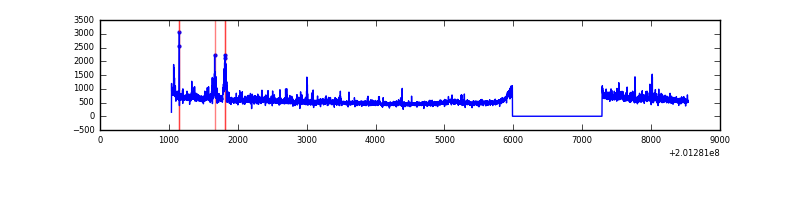 |
| C | 7500 | 6201 | 18 | 18 | 0.24% | 0.29% | 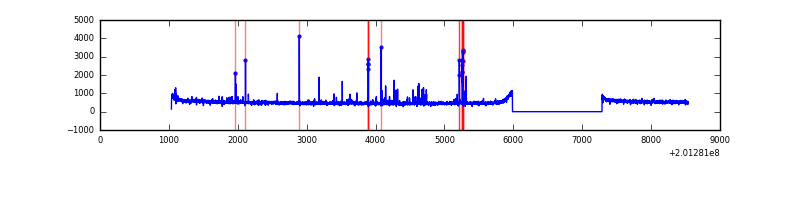 |
| D | 7500 | 6201 | 48 | 48 | 0.64% | 0.77% | 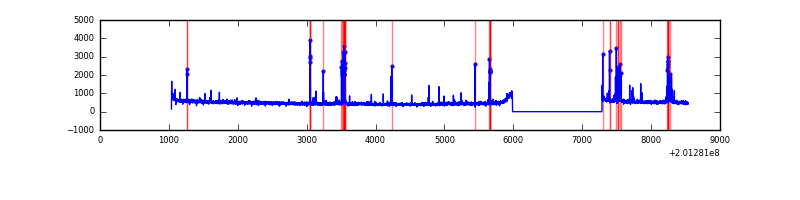 |
Top three noisy pixels from each quadrant. If the there are fewer than three noisy pixels in the level2.evt file, extra rows are filled as -1
| Pixel properties | Quadrant properties | ||||||
|---|---|---|---|---|---|---|---|
| Quadrant | DetID | PixID | Counts | Sigma | Mean | Median | Sigma |
| A | 0 | 50 | 82517 | 500.9 | 800 | 786 | 163.2 |
| A | 8 | 15 | 61849 | 374.23 | 800 | 786 | 163.2 |
| A | 0 | 31 | 10732 | 60.96 | 800 | 786 | 163.2 |
| B | 15 | 204 | 329474 | 2142.48 | 810 | 793 | 153.4 |
| B | 7 | 252 | 68999 | 444.6 | 810 | 793 | 153.4 |
| B | 4 | 81 | 15987 | 99.04 | 810 | 793 | 153.4 |
| C | 1 | 192 | 110673 | 607.18 | 786 | 793 | 181.0 |
| C | 15 | 208 | 33184 | 178.99 | 786 | 793 | 181.0 |
| C | 1 | 16 | 15780 | 82.82 | 786 | 793 | 181.0 |
| D | 13 | 223 | 202992 | 1095.89 | 778 | 760 | 184.5 |
| D | 2 | 37 | 23317 | 122.24 | 778 | 760 | 184.5 |
| D | 1 | 31 | 21896 | 114.54 | 778 | 760 | 184.5 |
Histogram calculated using DETX and DETY for each event in the final _common_clean file
| Quadrant A | 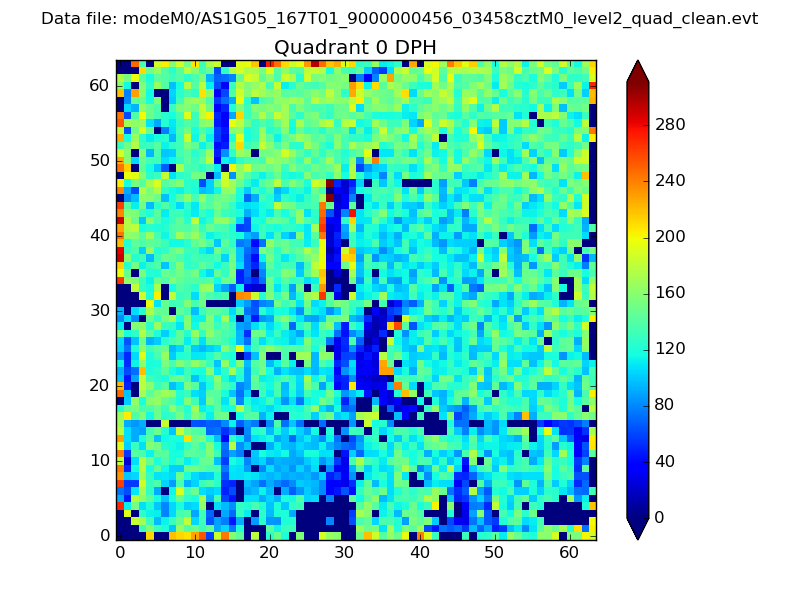 |
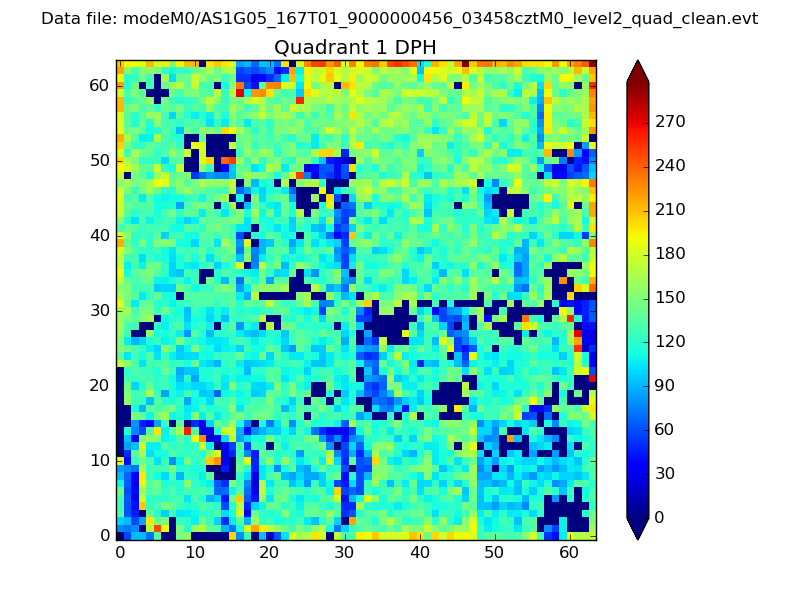 |
Quadrant B |
|---|---|---|---|
| Quadrant D | 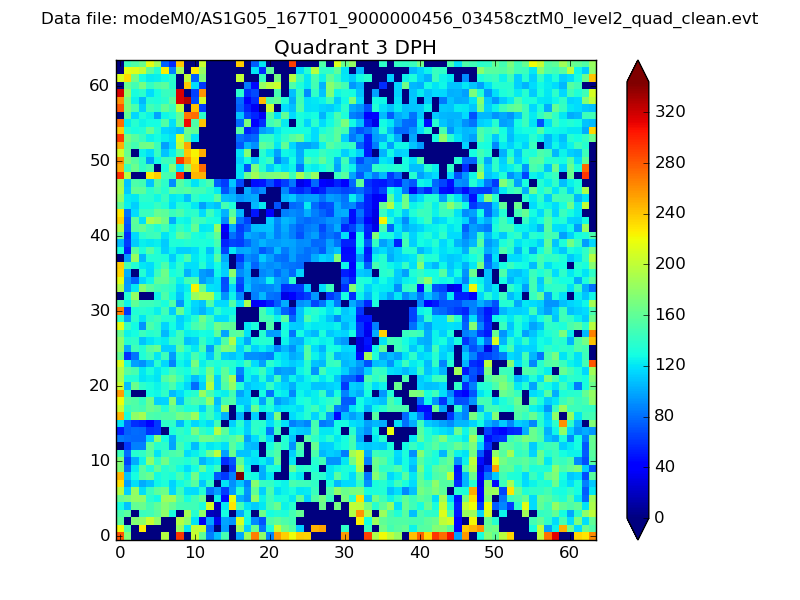 |
 |
Quadrant C |
| Plot type | Count rate plots | Images |
|---|---|---|
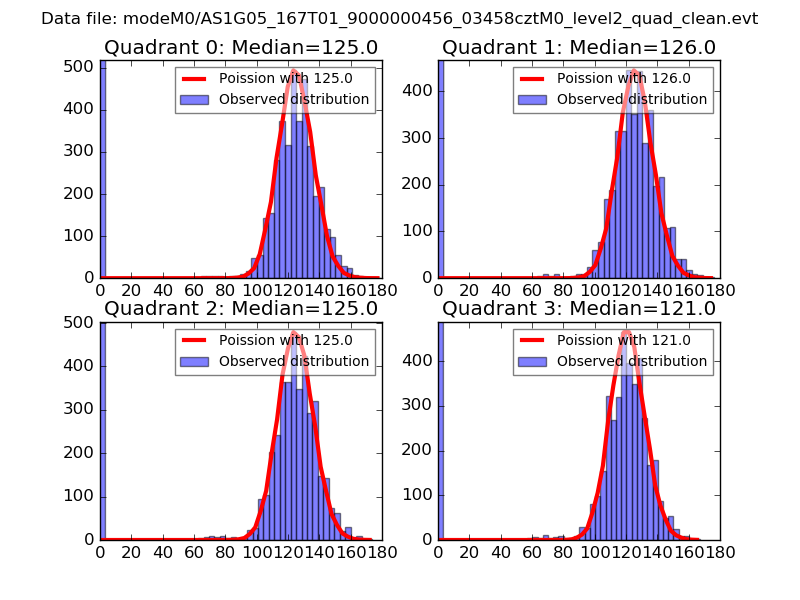
| Comparison with Poisson distribution Blue bars denote a histogram of data divided into 1 sec bins. Red curve is a Poisson curve with rate = median count rate of data. |
 |
 |
| Quadrant-wise count rates Data is divided into 100 sec bins |
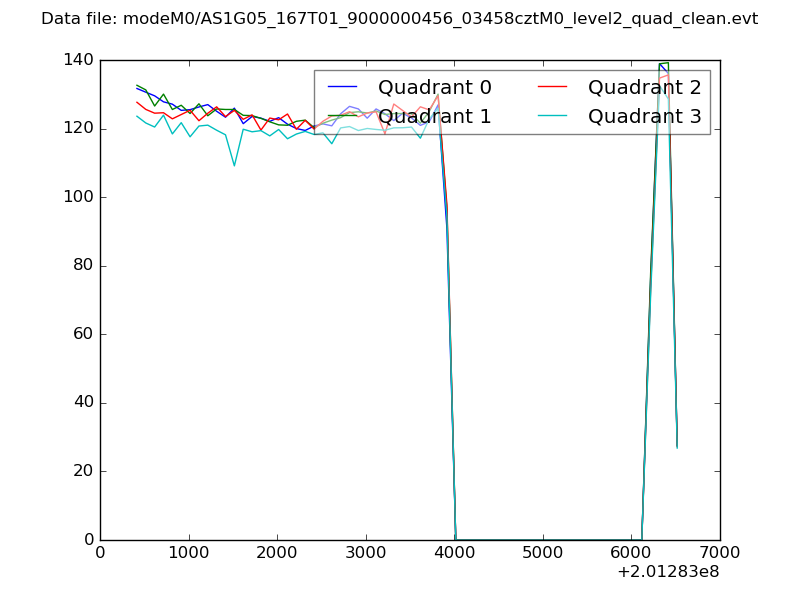 |
|
| Module-wise count rates for Quadrant A Data is divided into 100 sec bins |
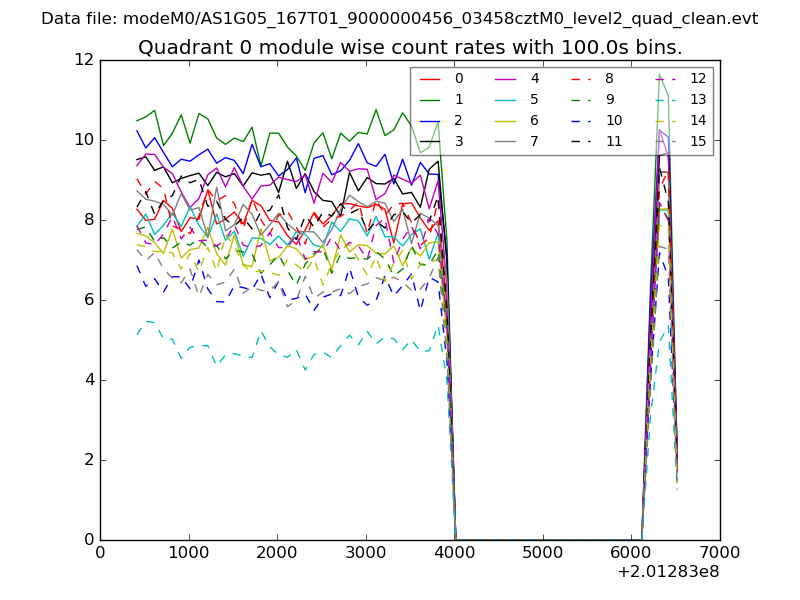 |
 |
| Module-wise count rates for Quadrant B Data is divided into 100 sec bins |
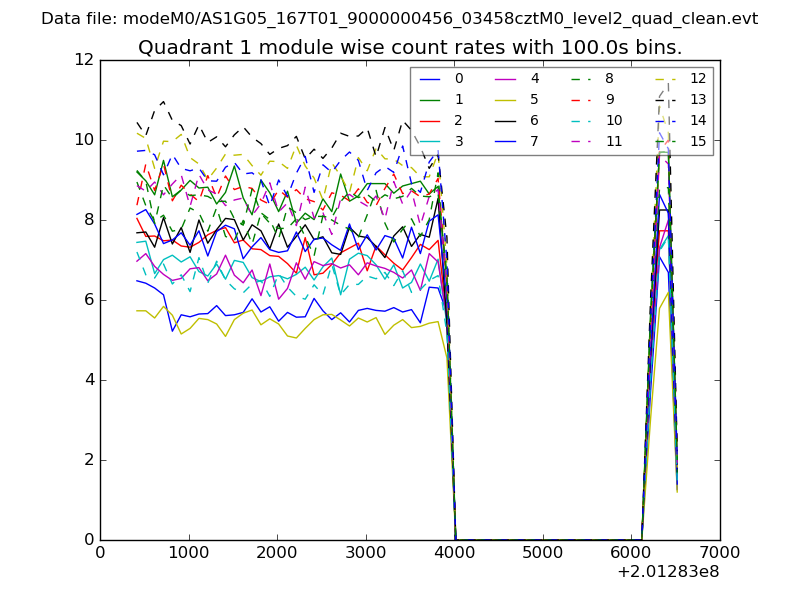 |
 |
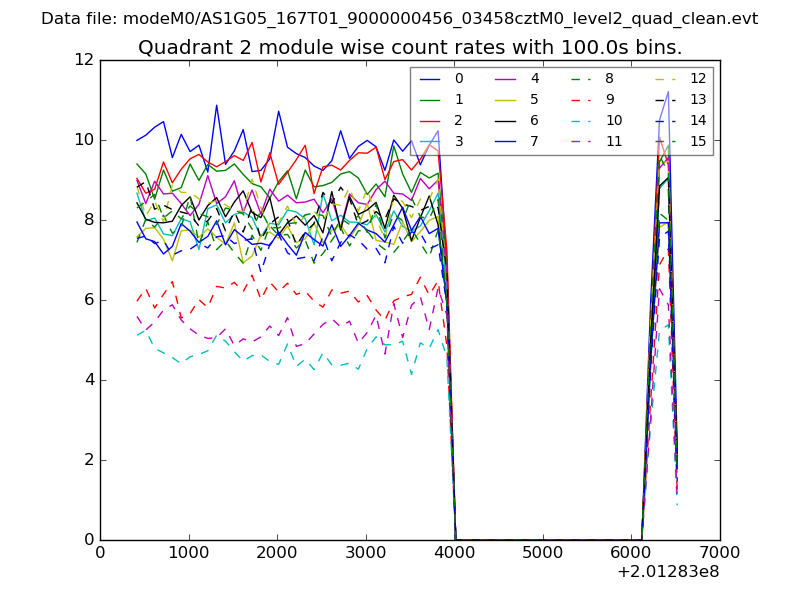
| Module-wise count rates for Quadrant C Data is divided into 100 sec bins |
 |
 |
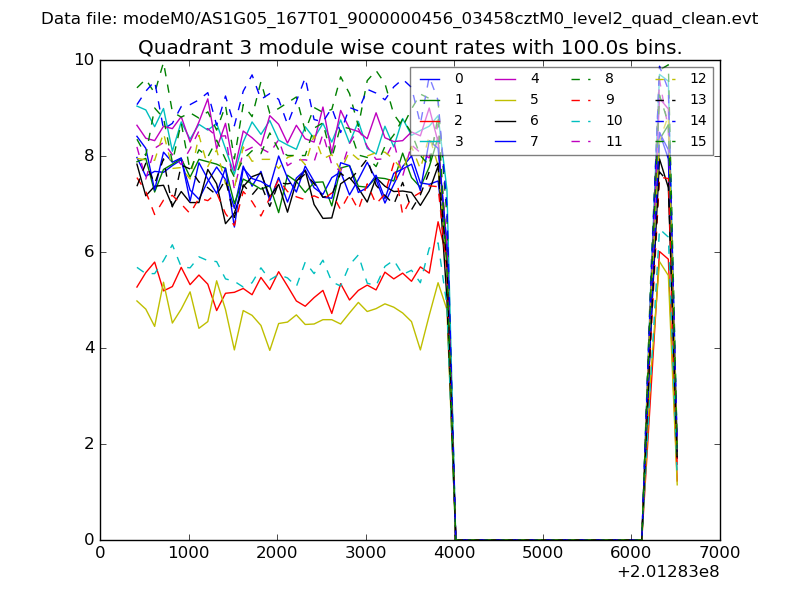
| Module-wise count rates for Quadrant D Data is divided into 100 sec bins |
 |
 |
| Parameter | Plot |
|---|---|
| CZT HV Monitor | 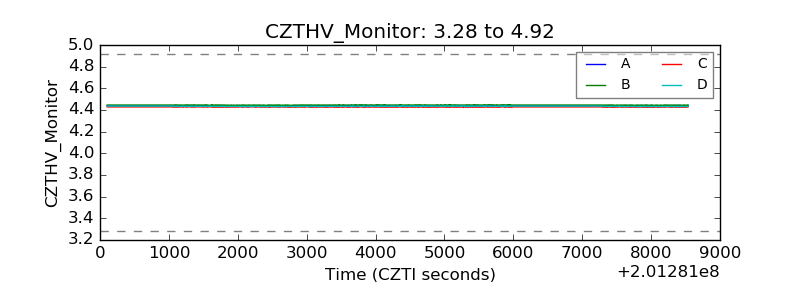 |
| D_VDD | 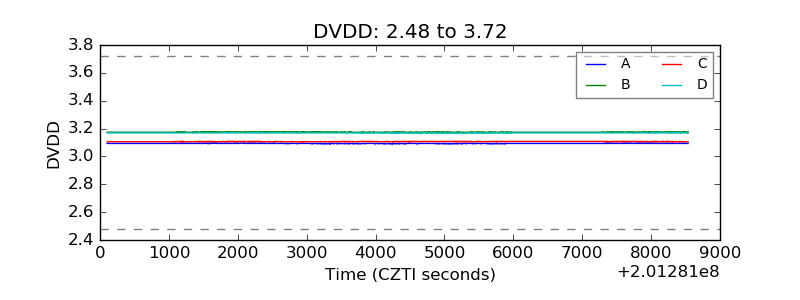 |
| Temperature 1 | 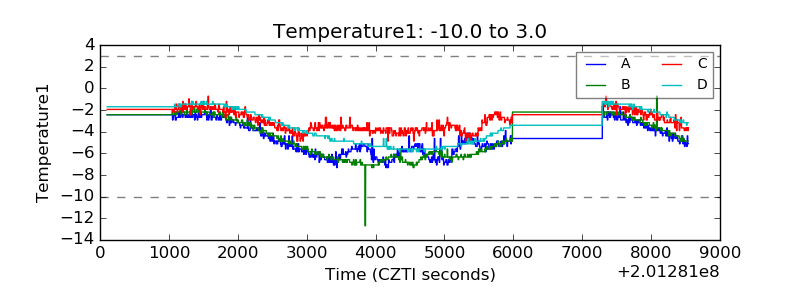 |
| Veto HV Monitor | 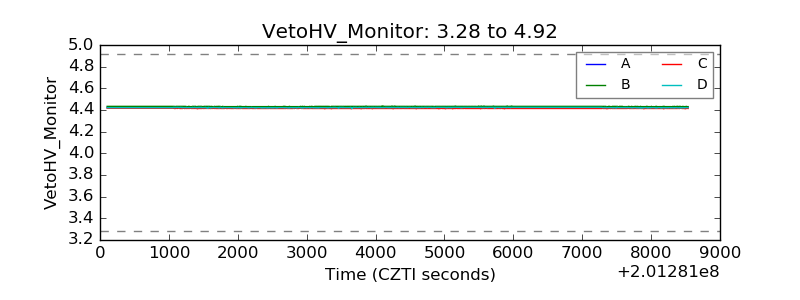 |
| Veto LLD | 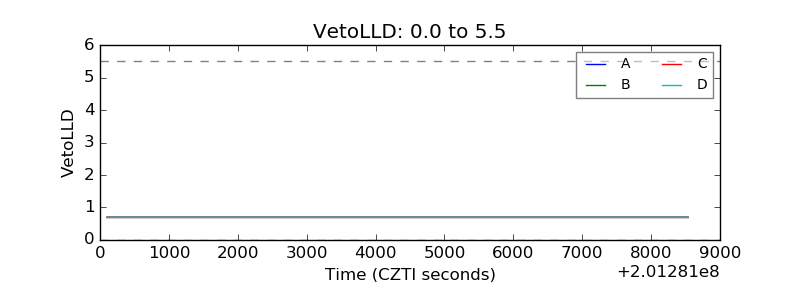 |
| Alpha Counter | 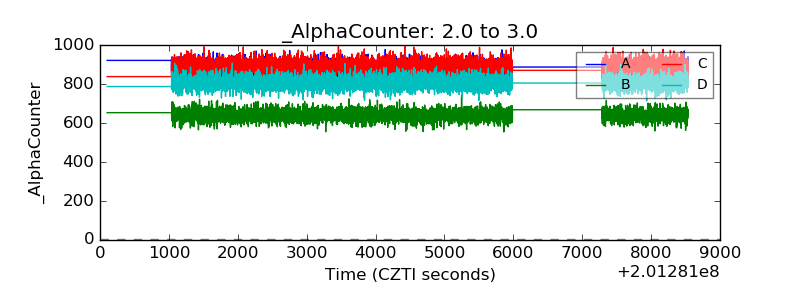 |
| _CPM_Rate | 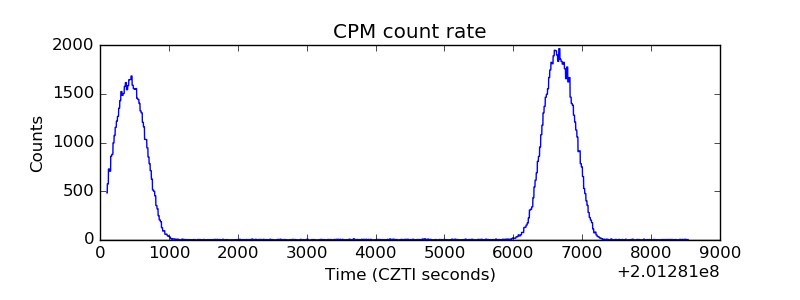 |
| CZT Counter | 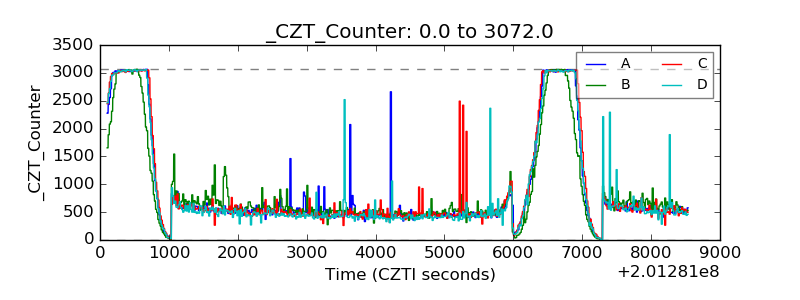 |
| +2.5 Volts monitor |  |
| +5 Volts monitor | 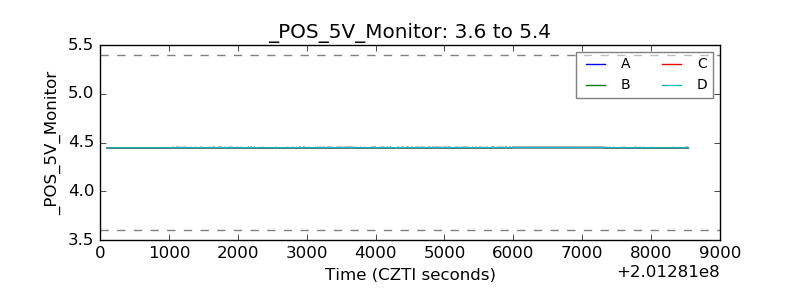 |
| _ROLL_ROT | 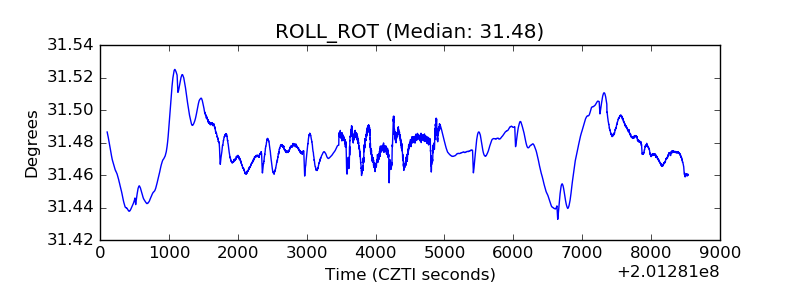 |
| _Roll_DEC | 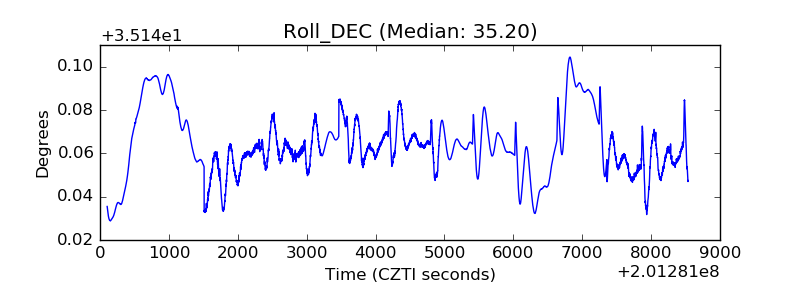 |
| _Roll_RA |  |
| Veto Counter | 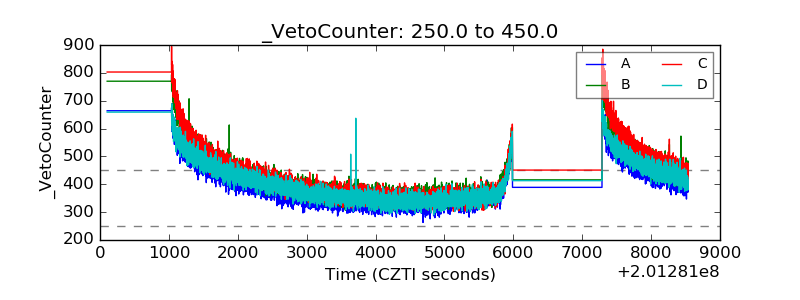 |