| Param | Original file | Final file |
|---|---|---|
| Filename | modeM0/AS1G05_167T01_9000000456_03459cztM0_level2.evt | modeM0/AS1G05_167T01_9000000456_03459cztM0_level2_quad_clean.evt |
| Size (bytes) | 166,204,800 | 37,517,760 |
| Size | 158.5 MB | 35.8 MB |
| Events in quadrant A | 1,156,961 | 242,492 |
| Events in quadrant B | 1,332,018 | 246,451 |
| Events in quadrant C | 1,168,715 | 242,859 |
| Events in quadrant D | 1,212,064 | 233,014 |
| Mode SS | |||
|---|---|---|---|
| Quadrant | BADHDUFLAG | Total packets | Discarded packets |
| A | 0 | 48 | 0 |
| B | 0 | 48 | 0 |
| C | 0 | 48 | 0 |
| D | 0 | 48 | 0 |
| Mode M0 | |||
|---|---|---|---|
| Quadrant | BADHDUFLAG | Total packets | Discarded packets |
| A | 0 | 4868 | 0 |
| B | 0 | 5534 | 0 |
| C | 0 | 4846 | 0 |
| D | 0 | 5119 | 0 |
| Quadrant | Total seconds | Saturated seconds | Saturation percentage |
|---|---|---|---|
| A | 2373 | 2 | 0.084282% |
| B | 2373 | 4 | 0.168563% |
| C | 2373 | 2 | 0.084282% |
| D | 2373 | 13 | 0.547830% |
Noise dominated data is calculated using 1-second bins in cleaned event files. If a bin has >2000 counts, and if more than 50% of those come from <1% of pixels, then it is considered to be noise-dominated and hence unusable.
| Quadrant | # 1 sec bins | Bins with >0 counts | Bins with >2000 counts | High rate bins dominated by noise | Noise dominated (total time) | Noise dominated (detector-on time) | Marked lightcurve |
|---|---|---|---|---|---|---|---|
| A | 2373 | 2373 | 1 | 1 | 0.04% | 0.04% | 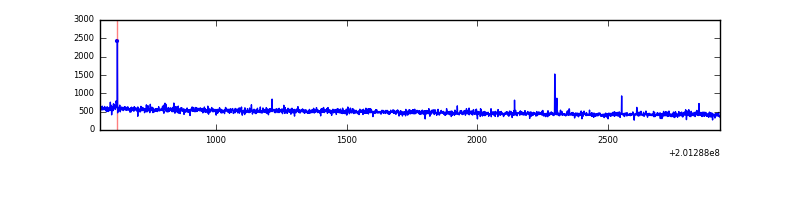 |
| B | 2373 | 2373 | 2 | 2 | 0.08% | 0.08% | 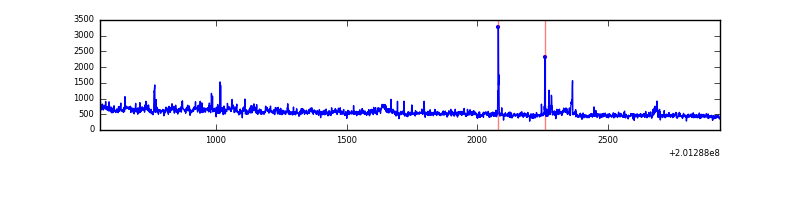 |
| C | 2373 | 2373 | 0 | 0 | 0.00% | 0.00% | 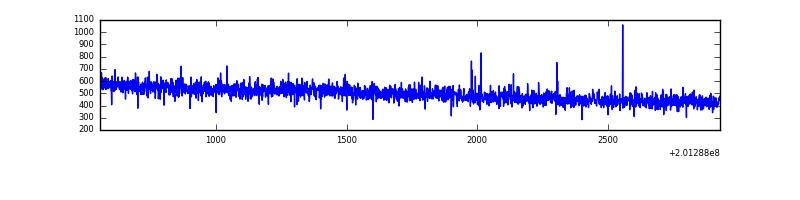 |
| D | 2373 | 2373 | 12 | 12 | 0.51% | 0.51% | 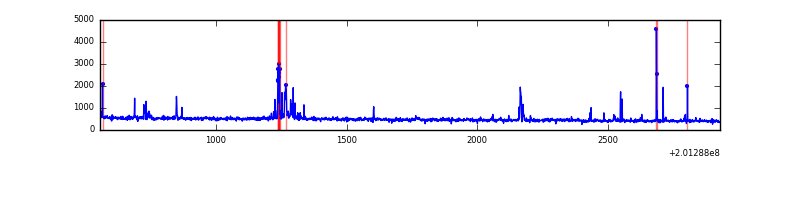 |
Top three noisy pixels from each quadrant. If the there are fewer than three noisy pixels in the level2.evt file, extra rows are filled as -1
| Pixel properties | Quadrant properties | ||||||
|---|---|---|---|---|---|---|---|
| Quadrant | DetID | PixID | Counts | Sigma | Mean | Median | Sigma |
| A | 0 | 31 | 4451 | 68.43 | 296 | 291 | 60.8 |
| A | 8 | 15 | 4193 | 64.19 | 296 | 291 | 60.8 |
| A | 0 | 226 | 3428 | 51.6 | 296 | 291 | 60.8 |
| B | 15 | 204 | 110268 | 1843.92 | 304 | 298 | 59.6 |
| B | 15 | 85 | 23583 | 390.43 | 304 | 298 | 59.6 |
| B | 4 | 81 | 15122 | 248.56 | 304 | 298 | 59.6 |
| C | 1 | 192 | 3456 | 45.6 | 297 | 299 | 69.2 |
| C | 1 | 16 | 2550 | 32.52 | 297 | 299 | 69.2 |
| C | 13 | 61 | 2507 | 31.89 | 297 | 299 | 69.2 |
| D | 13 | 223 | 83915 | 1181.17 | 292 | 284 | 70.8 |
| D | 2 | 37 | 8141 | 110.97 | 292 | 284 | 70.8 |
| D | 8 | 195 | 7385 | 100.29 | 292 | 284 | 70.8 |
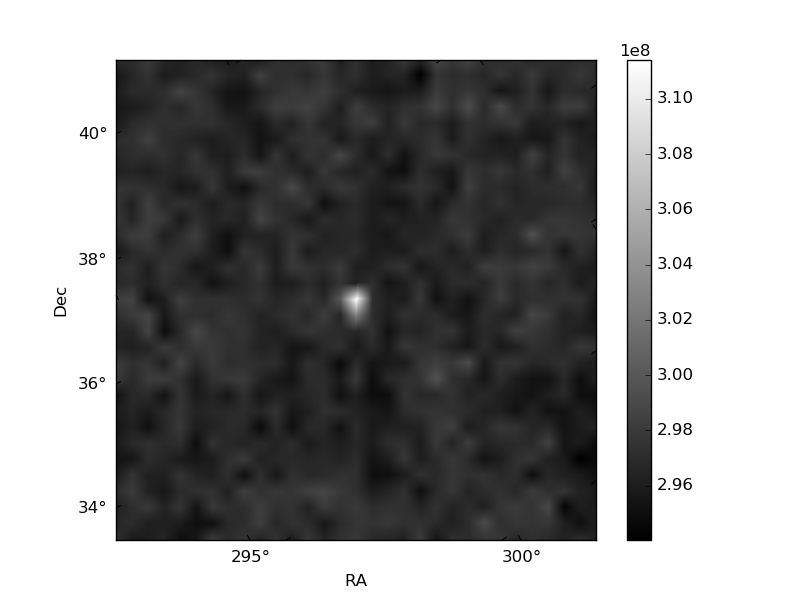
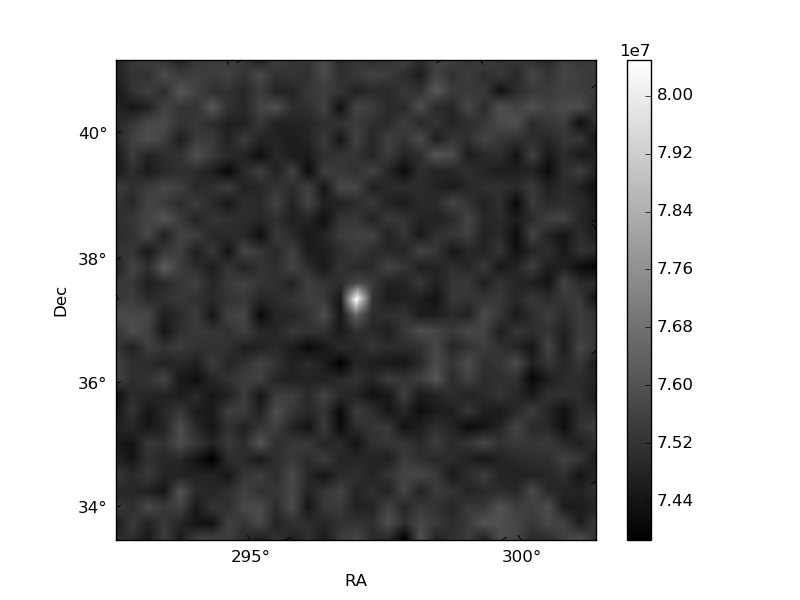
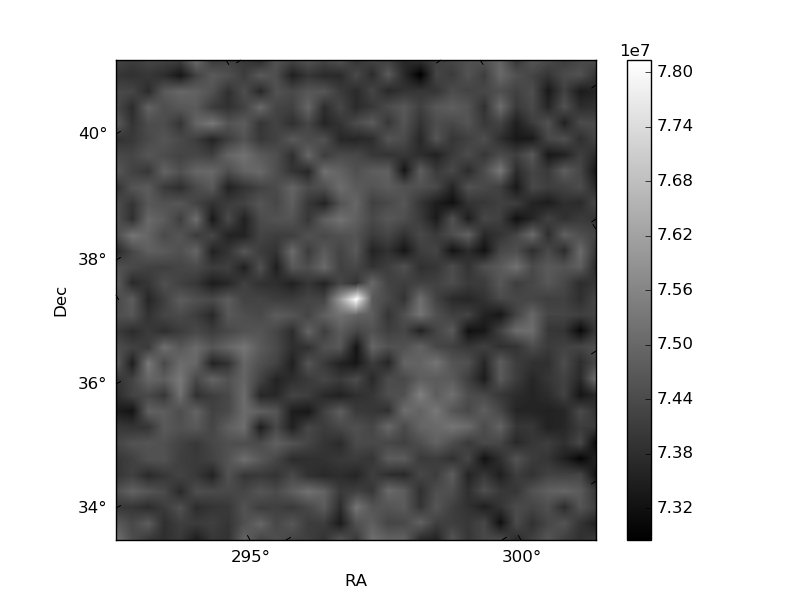
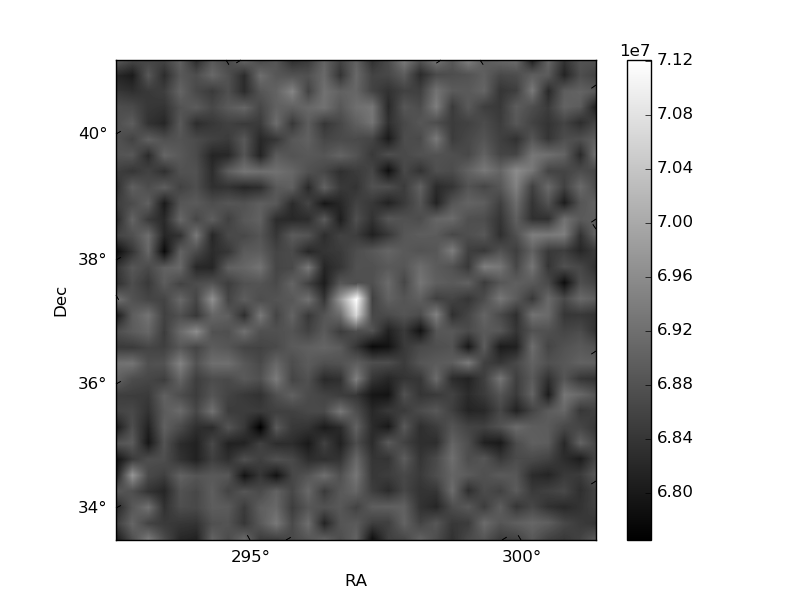
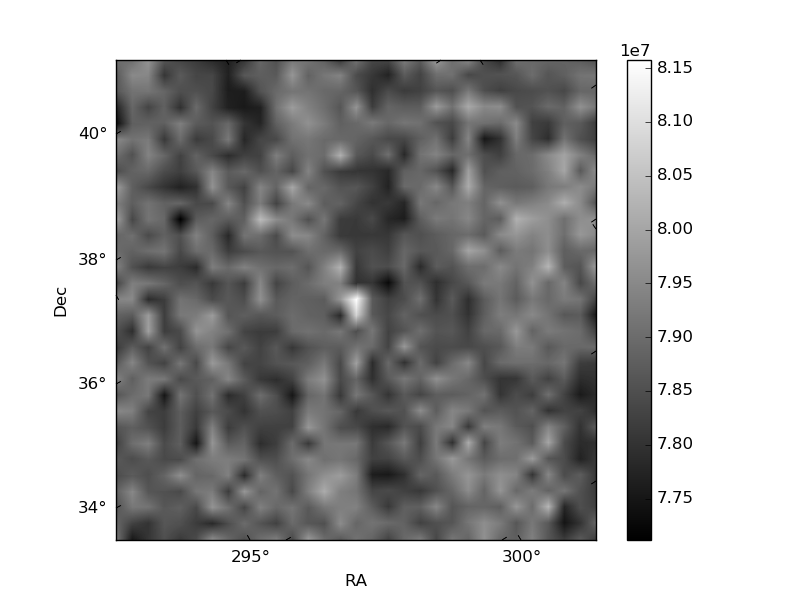
Histogram calculated using DETX and DETY for each event in the final _common_clean file
| Quadrant A | 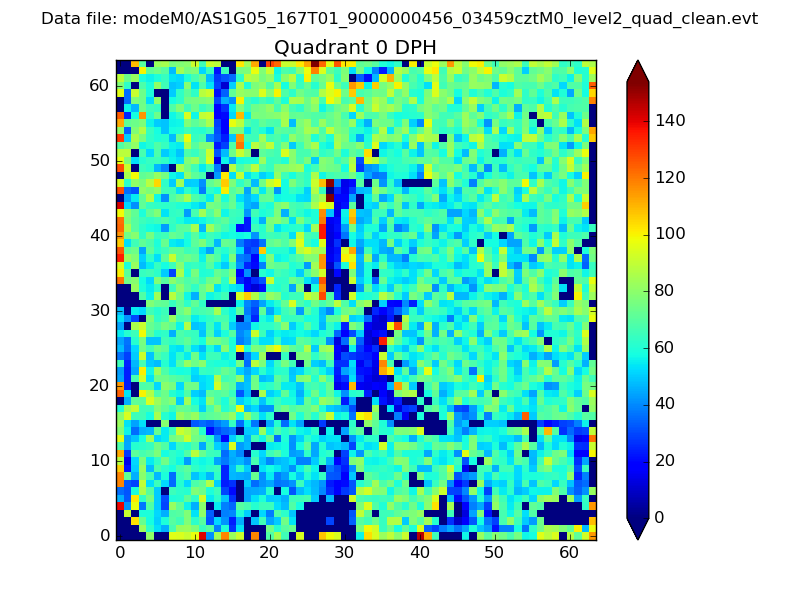 |
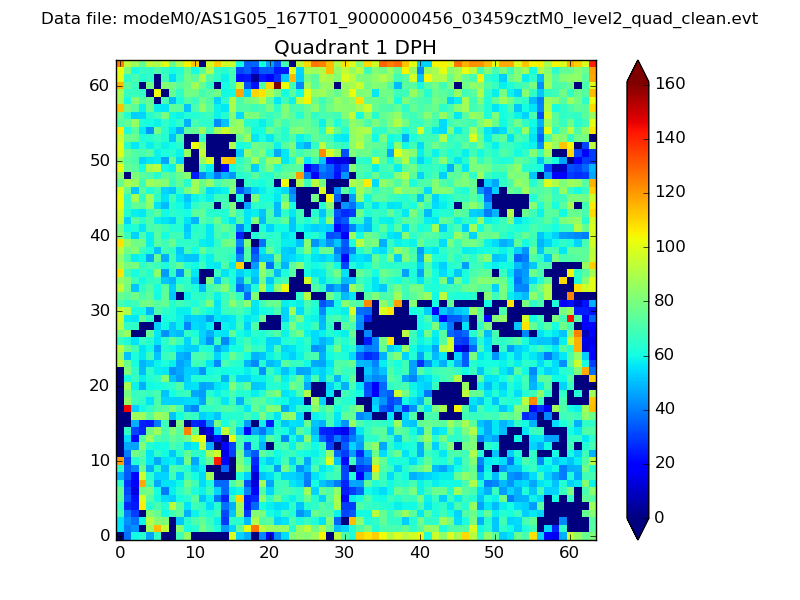 |
Quadrant B |
|---|---|---|---|
| Quadrant D | 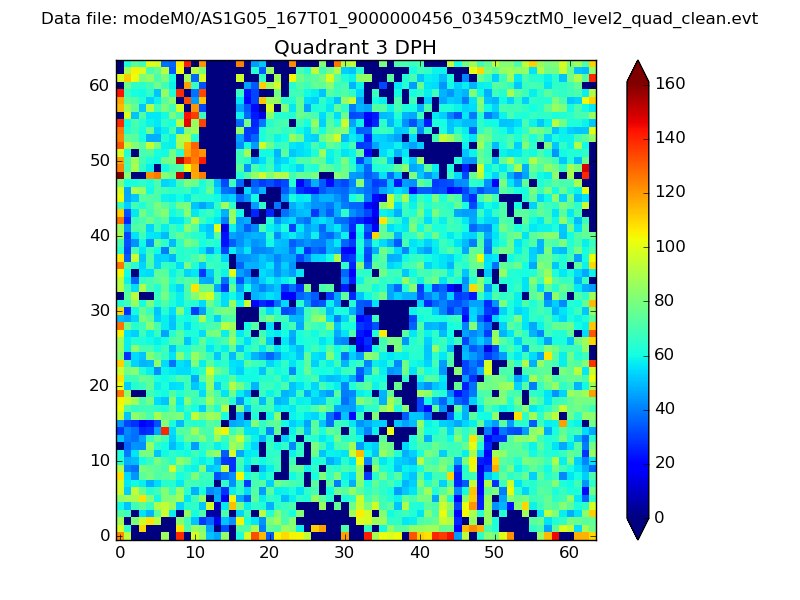 |
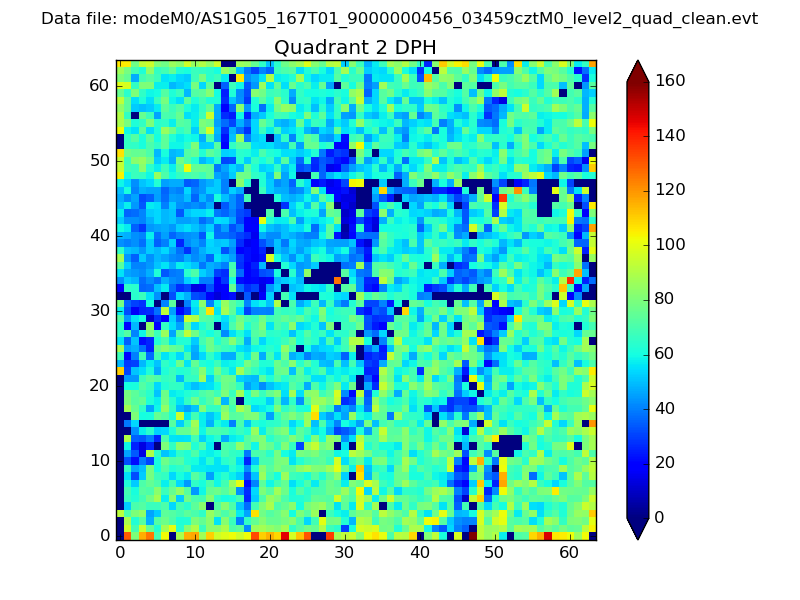 |
Quadrant C |
| Plot type | Count rate plots | Images |
|---|---|---|
| Comparison with Poisson distribution Blue bars denote a histogram of data divided into 1 sec bins. Red curve is a Poisson curve with rate = median count rate of data. |
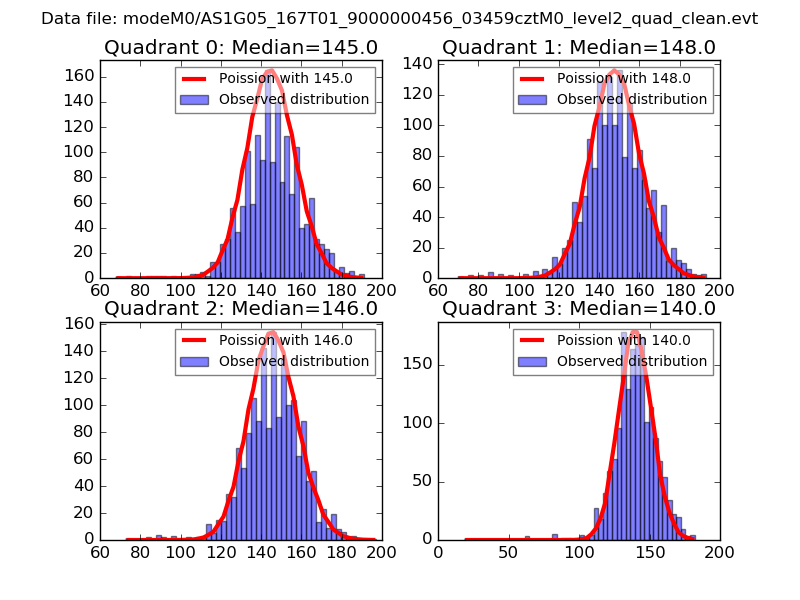 |
 |
| Quadrant-wise count rates Data is divided into 100 sec bins |
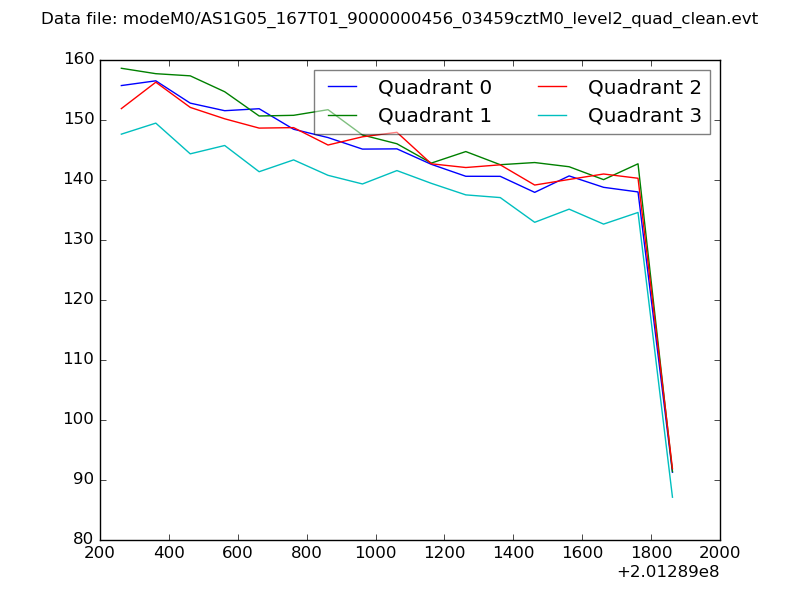 |
|
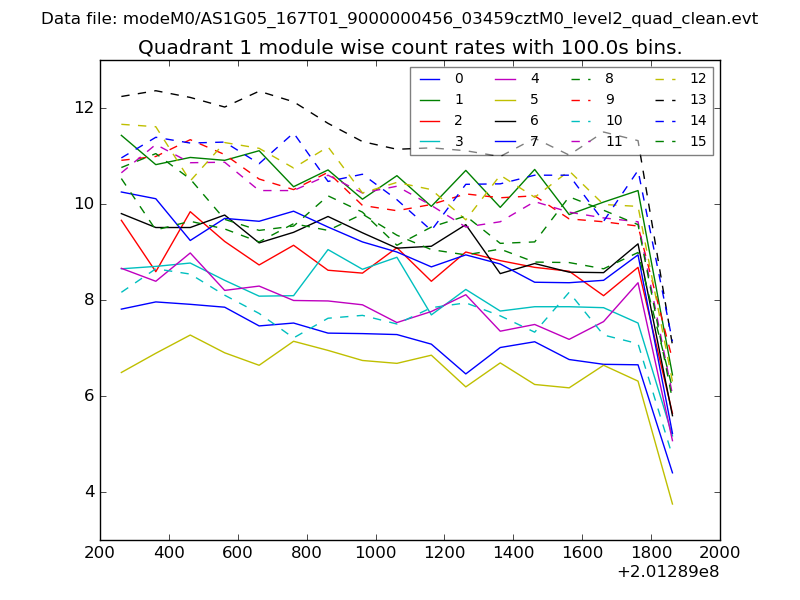
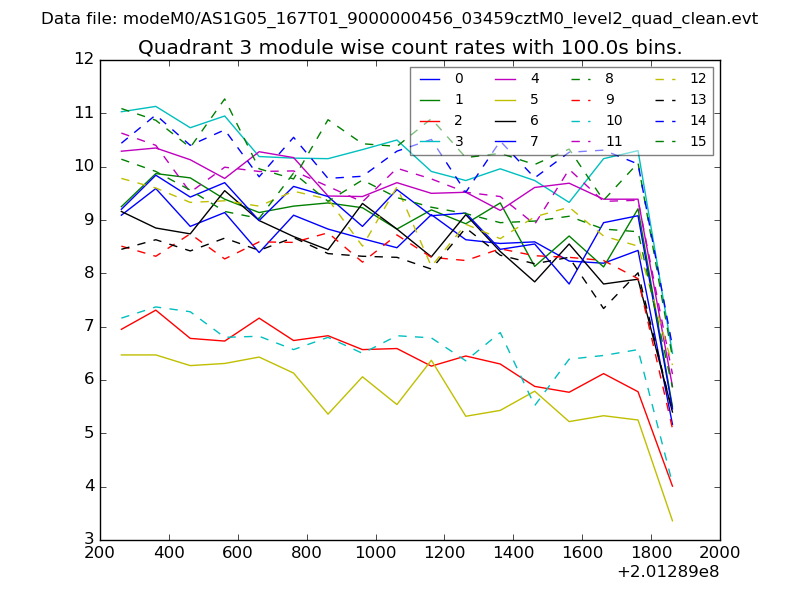
| Module-wise count rates for Quadrant A Data is divided into 100 sec bins |
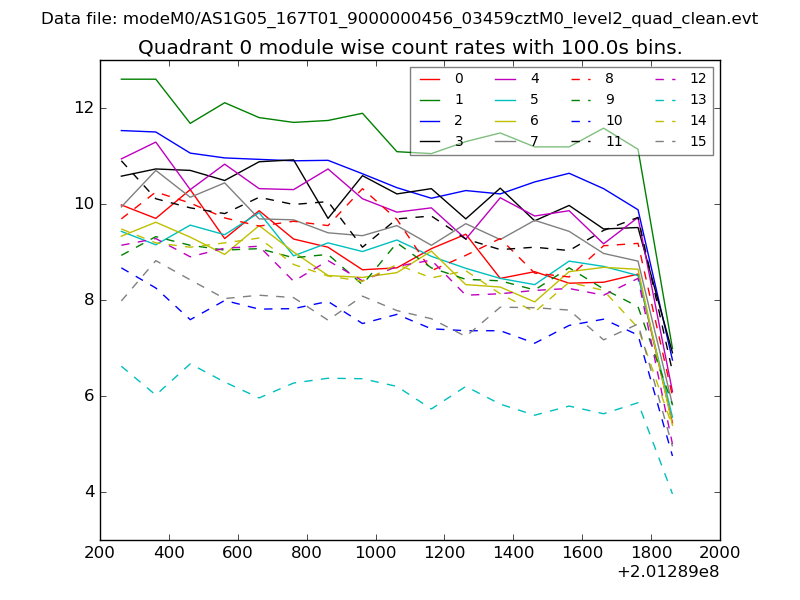 |
 |
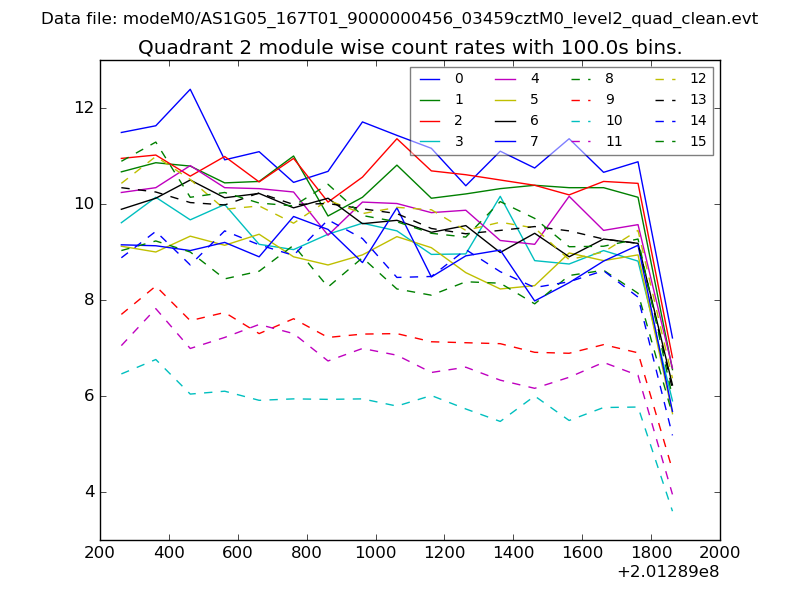
| Module-wise count rates for Quadrant B Data is divided into 100 sec bins |
 |
 |
| Module-wise count rates for Quadrant C Data is divided into 100 sec bins |
 |
 |
| Module-wise count rates for Quadrant D Data is divided into 100 sec bins |
 |
 |
| Parameter | Plot |
|---|---|
| CZT HV Monitor | 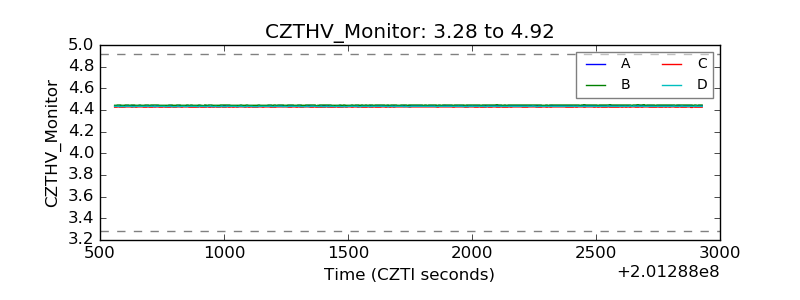 |
| D_VDD | 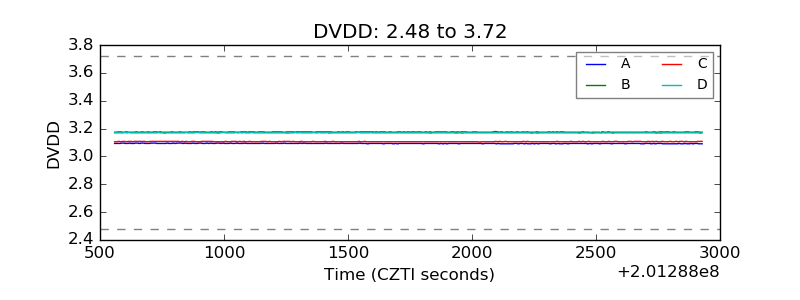 |
| Temperature 1 | 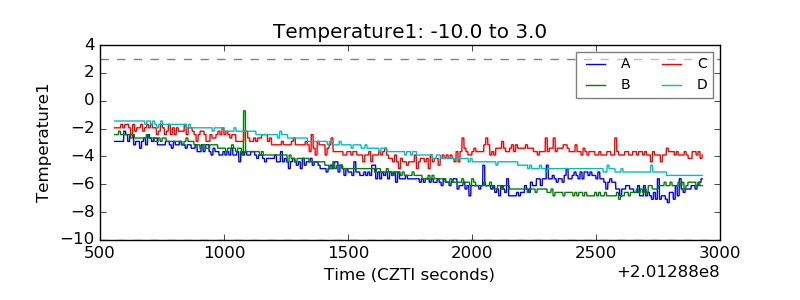 |
| Veto HV Monitor | 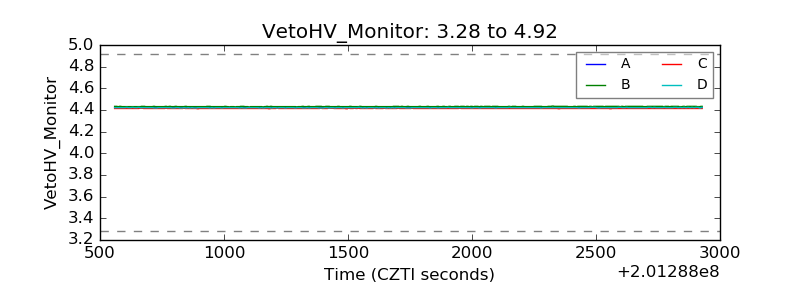 |
| Veto LLD | 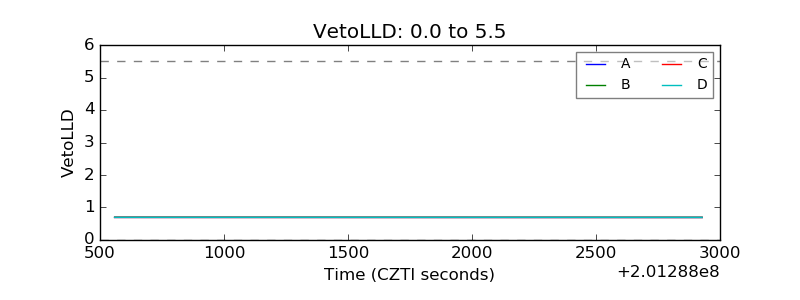 |
| Alpha Counter | 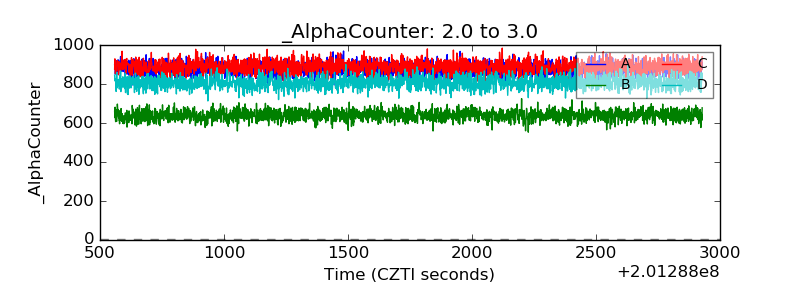 |
| _CPM_Rate | 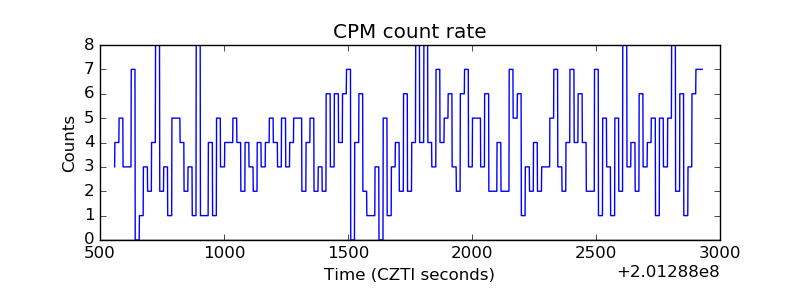 |
| CZT Counter | 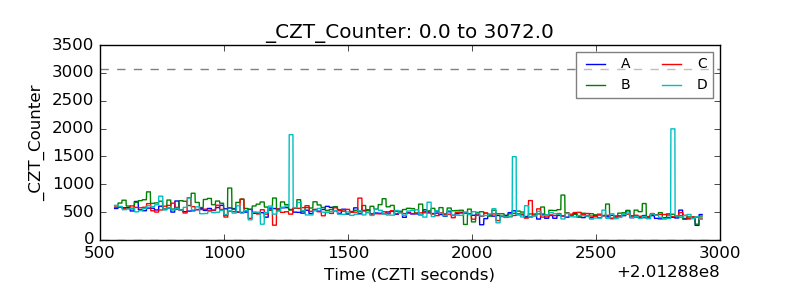 |
| +2.5 Volts monitor |  |
| +5 Volts monitor |  |
| _ROLL_ROT | 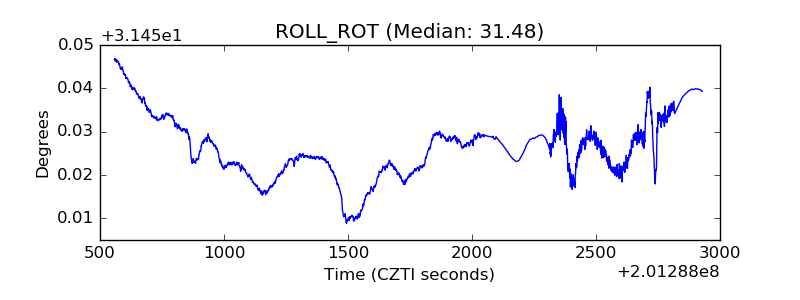 |
| _Roll_DEC |  |
| _Roll_RA | 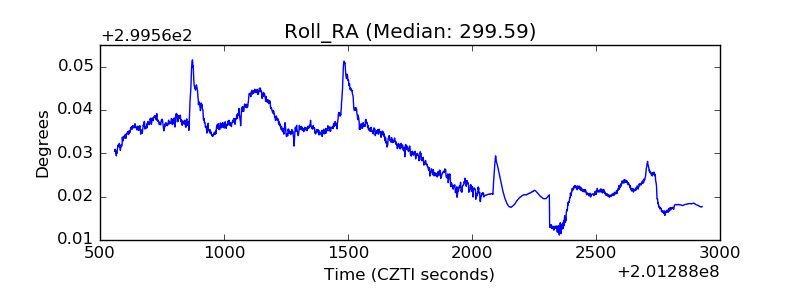 |
| Veto Counter | 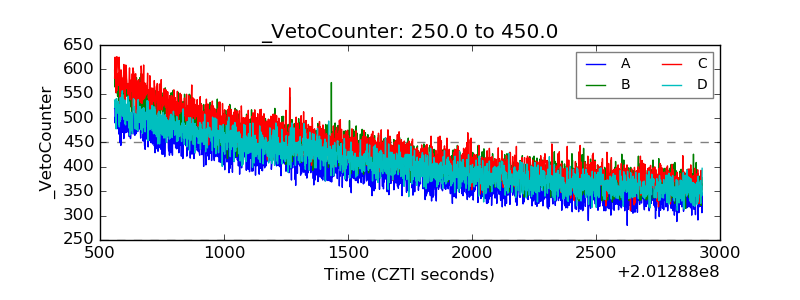 |