| Param | Original file | Final file |
|---|---|---|
| Filename | modeM0/AS1SLEW_01234_9000000455_03417cztM0_level2.evt | modeM0/AS1SLEW_01234_9000000455_03417cztM0_level2_quad_clean.evt |
| Size (bytes) | 71,219,520 | 17,239,680 |
| Size | 67.9 MB | 16.4 MB |
| Events in quadrant A | 462,846 | 111,885 |
| Events in quadrant B | 606,868 | 113,264 |
| Events in quadrant C | 529,474 | 112,607 |
| Events in quadrant D | 486,566 | 106,765 |
| Mode SS | |||
|---|---|---|---|
| Quadrant | BADHDUFLAG | Total packets | Discarded packets |
| A | 0 | 20 | 0 |
| B | 0 | 20 | 0 |
| C | 0 | 20 | 0 |
| D | 0 | 20 | 0 |
| Mode M0 | |||
|---|---|---|---|
| Quadrant | BADHDUFLAG | Total packets | Discarded packets |
| A | 0 | 2025 | 0 |
| B | 0 | 2447 | 0 |
| C | 0 | 2182 | 0 |
| D | 0 | 2097 | 0 |
| Quadrant | Total seconds | Saturated seconds | Saturation percentage |
|---|---|---|---|
| A | 998 | 0 | 0.000000% |
| B | 998 | 7 | 0.701403% |
| C | 998 | 11 | 1.102204% |
| D | 998 | 6 | 0.601202% |
Noise dominated data is calculated using 1-second bins in cleaned event files. If a bin has >2000 counts, and if more than 50% of those come from <1% of pixels, then it is considered to be noise-dominated and hence unusable.
| Quadrant | # 1 sec bins | Bins with >0 counts | Bins with >2000 counts | High rate bins dominated by noise | Noise dominated (total time) | Noise dominated (detector-on time) | Marked lightcurve |
|---|---|---|---|---|---|---|---|
| A | 998 | 998 | 0 | 0 | 0.00% | 0.00% | 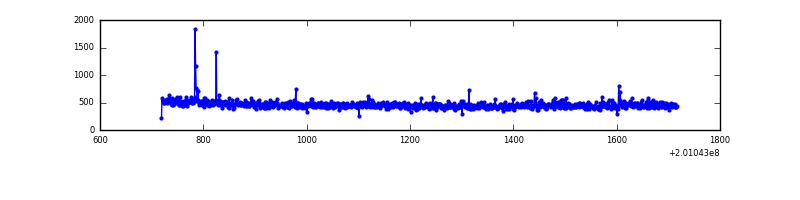 |
| B | 998 | 998 | 1 | 1 | 0.10% | 0.10% | 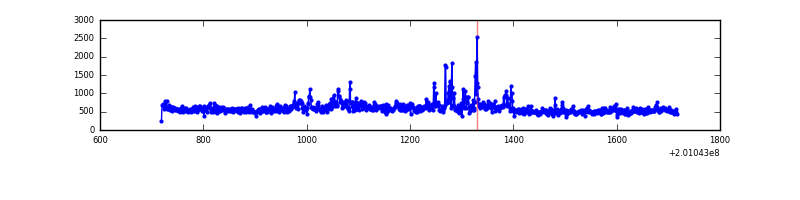 |
| C | 998 | 998 | 6 | 6 | 0.60% | 0.60% | 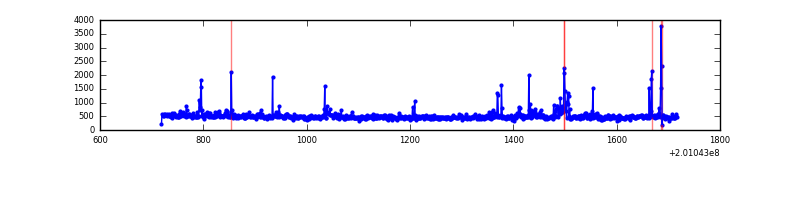 |
| D | 998 | 998 | 7 | 7 | 0.70% | 0.70% | 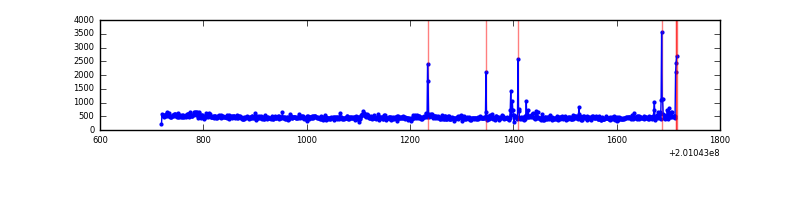 |
Top three noisy pixels from each quadrant. If the there are fewer than three noisy pixels in the level2.evt file, extra rows are filled as -1
| Pixel properties | Quadrant properties | ||||||
|---|---|---|---|---|---|---|---|
| Quadrant | DetID | PixID | Counts | Sigma | Mean | Median | Sigma |
| A | 0 | 31 | 5463 | 203.56 | 118 | 115 | 26.3 |
| A | 0 | 226 | 1270 | 43.96 | 118 | 115 | 26.3 |
| A | 12 | 194 | 1243 | 42.93 | 118 | 115 | 26.3 |
| B | 15 | 204 | 68201 | 2755.54 | 121 | 119 | 24.7 |
| B | 14 | 167 | 23032 | 927.38 | 121 | 119 | 24.7 |
| B | 5 | 70 | 20531 | 826.15 | 121 | 119 | 24.7 |
| C | 7 | 220 | 58492 | 2009.56 | 119 | 119 | 29.0 |
| C | 15 | 208 | 2400 | 78.53 | 119 | 119 | 29.0 |
| C | 8 | 208 | 1976 | 63.93 | 119 | 119 | 29.0 |
| D | 13 | 223 | 27176 | 908.56 | 117 | 113 | 29.8 |
| D | 12 | 246 | 6274 | 206.84 | 117 | 113 | 29.8 |
| D | 2 | 37 | 5334 | 175.28 | 117 | 113 | 29.8 |
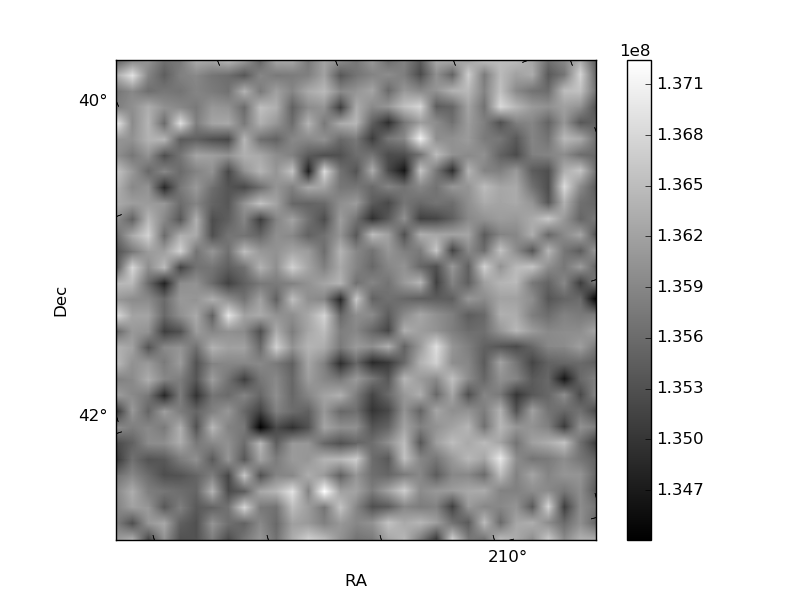
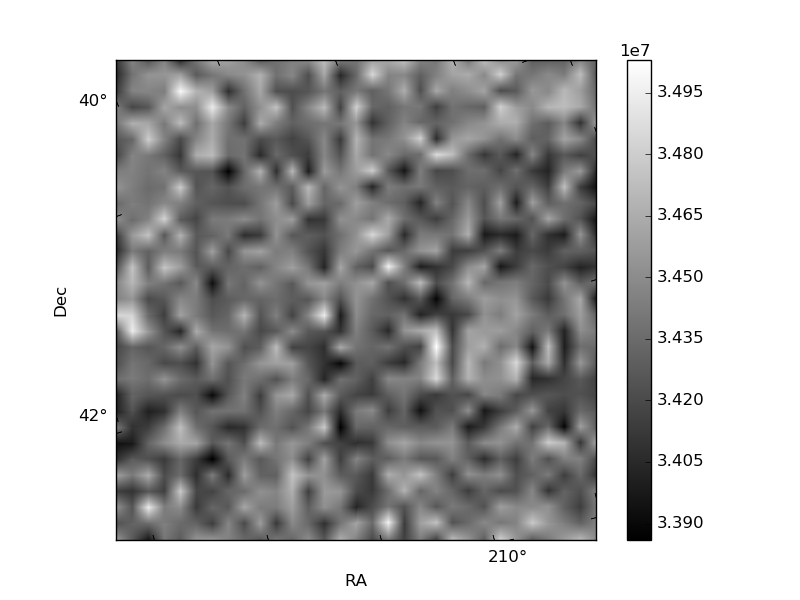
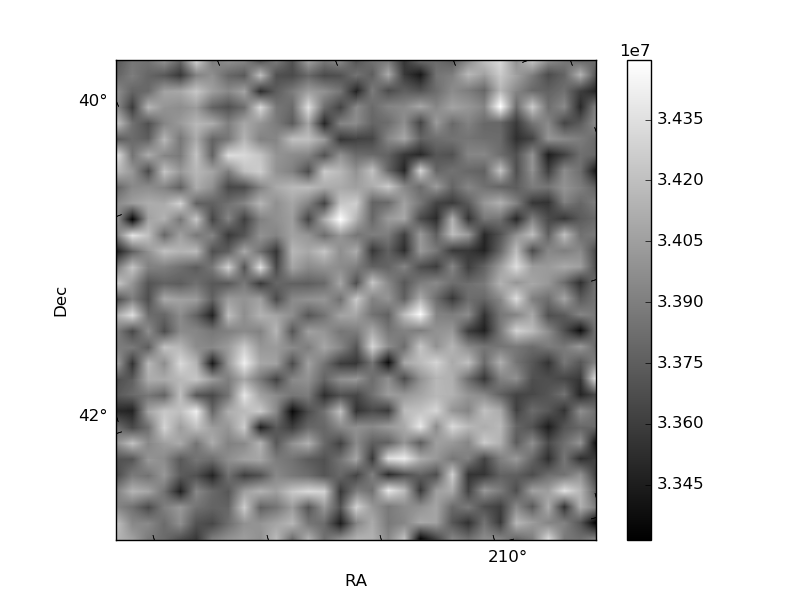
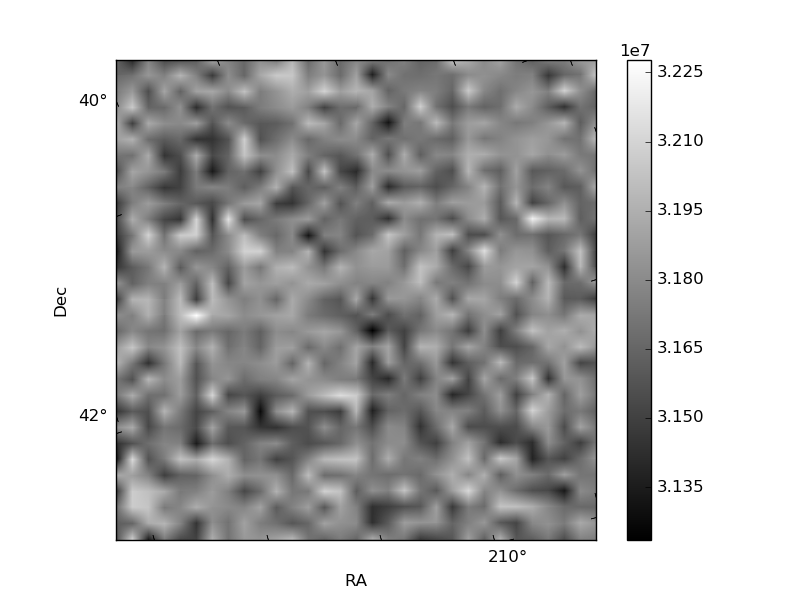
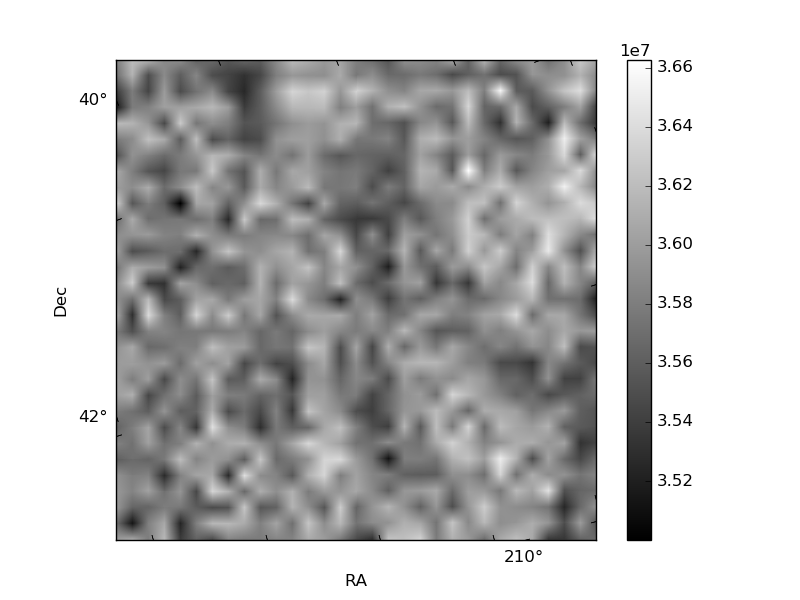
Histogram calculated using DETX and DETY for each event in the final _common_clean file
| Quadrant A | 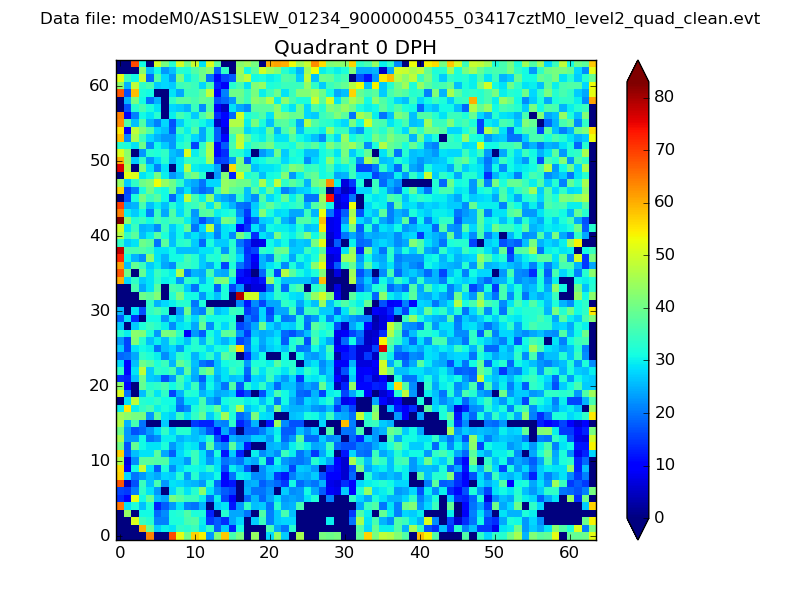 |
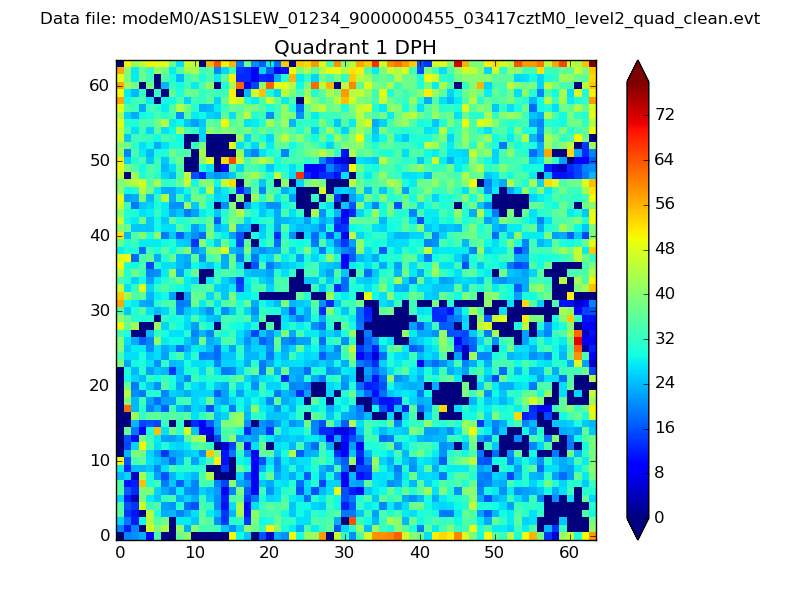 |
Quadrant B |
|---|---|---|---|
| Quadrant D | 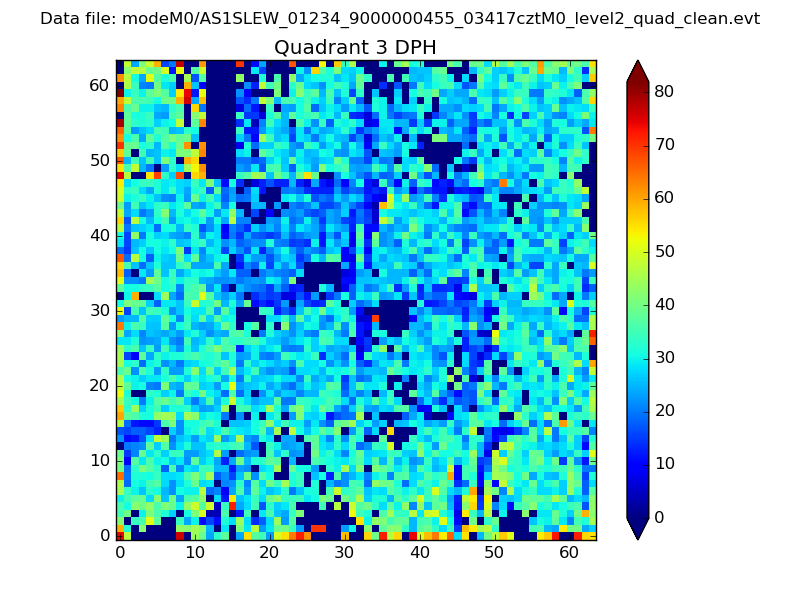 |
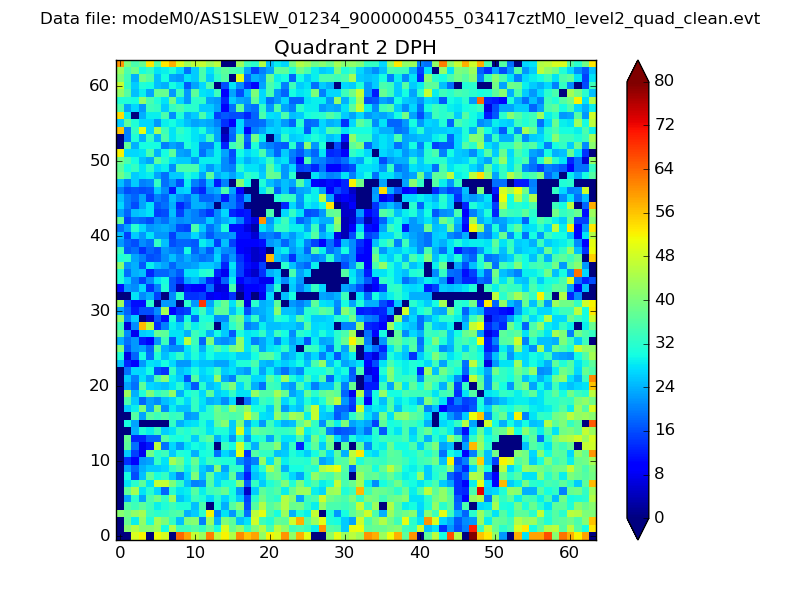 |
Quadrant C |
| Plot type | Count rate plots | Images |
|---|---|---|
| Comparison with Poisson distribution Blue bars denote a histogram of data divided into 1 sec bins. Red curve is a Poisson curve with rate = median count rate of data. |
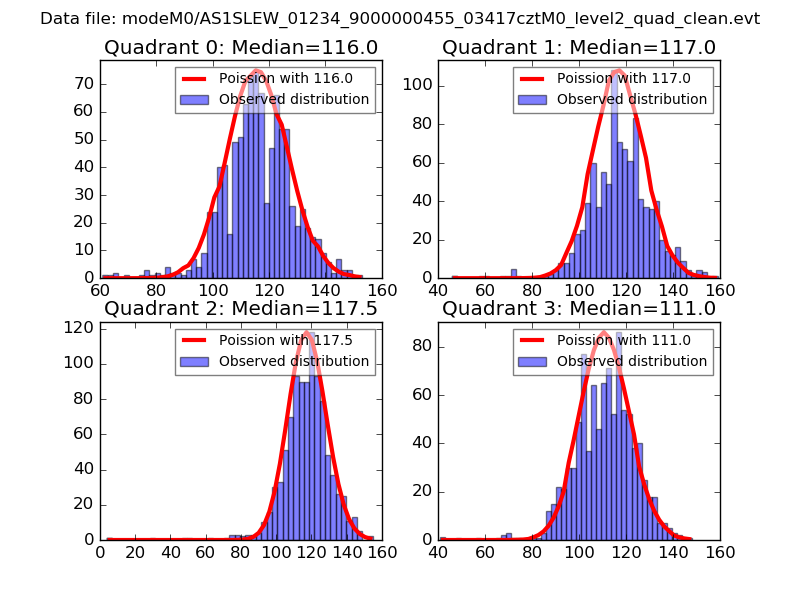 |
 |
| Quadrant-wise count rates Data is divided into 100 sec bins |
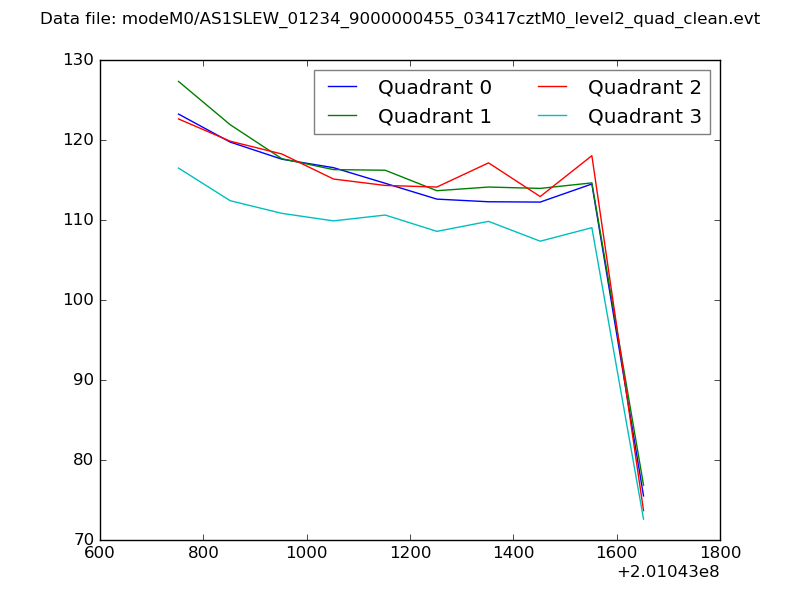 |
|
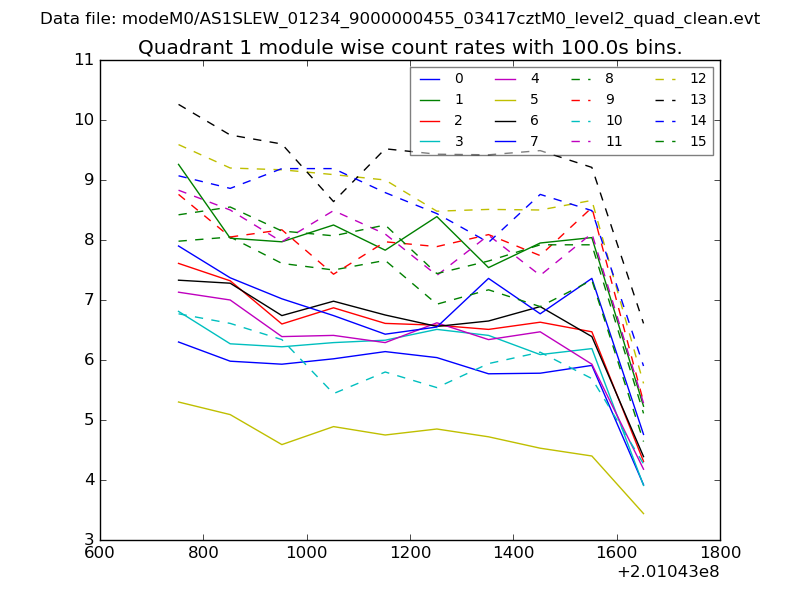
| Module-wise count rates for Quadrant A Data is divided into 100 sec bins |
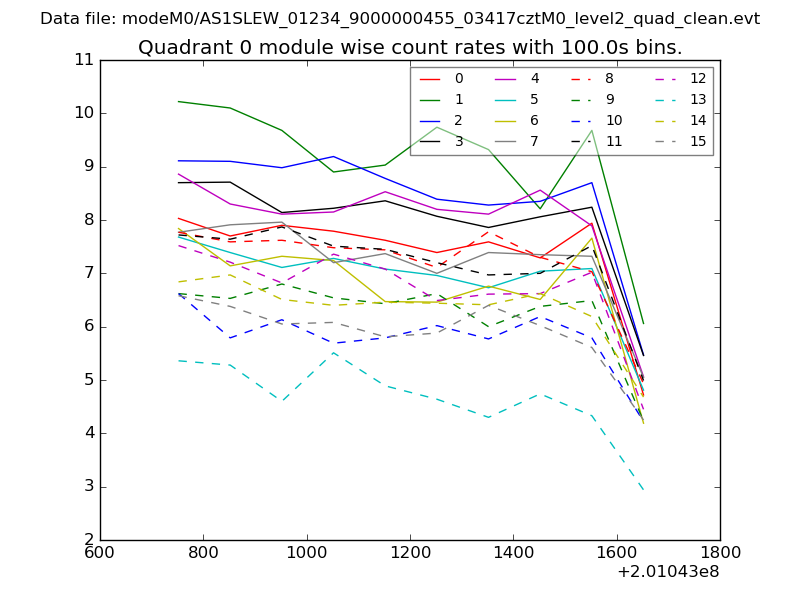 |
 |
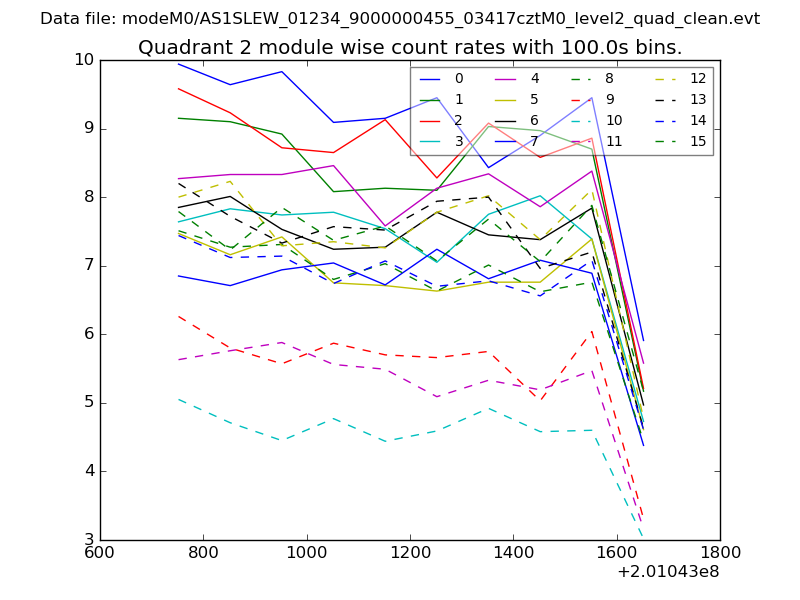
| Module-wise count rates for Quadrant B Data is divided into 100 sec bins |
 |
 |
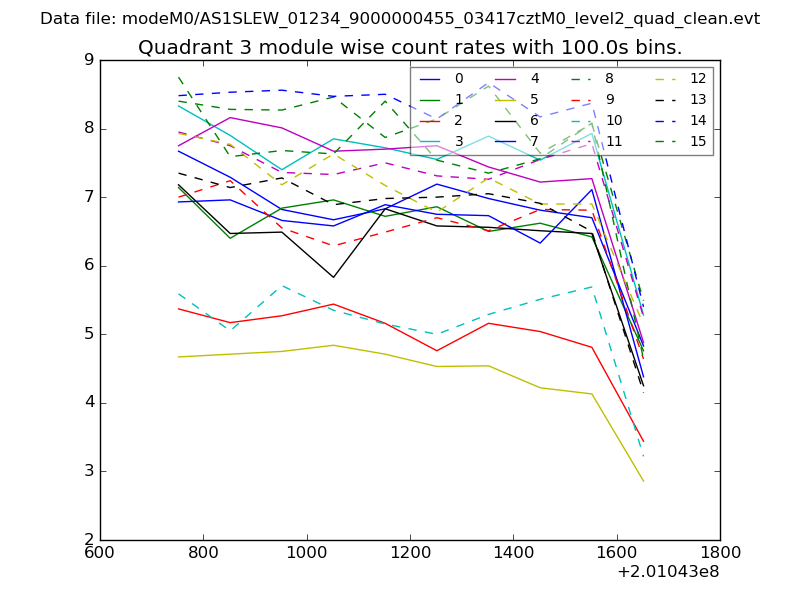
| Module-wise count rates for Quadrant C Data is divided into 100 sec bins |
 |
 |
| Module-wise count rates for Quadrant D Data is divided into 100 sec bins |
 |
 |
| Parameter | Plot |
|---|---|
| CZT HV Monitor | 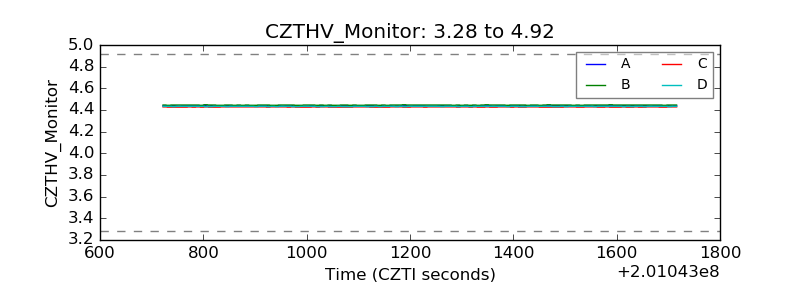 |
| D_VDD | 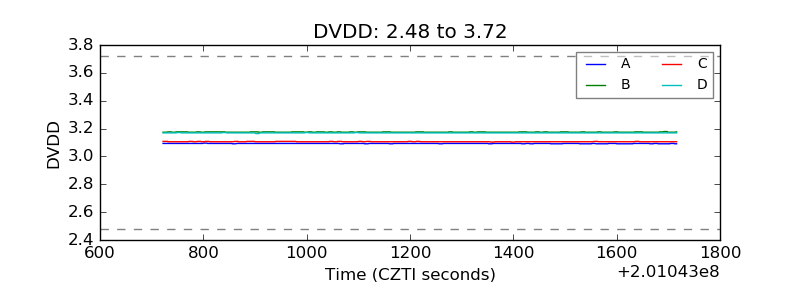 |
| Temperature 1 | 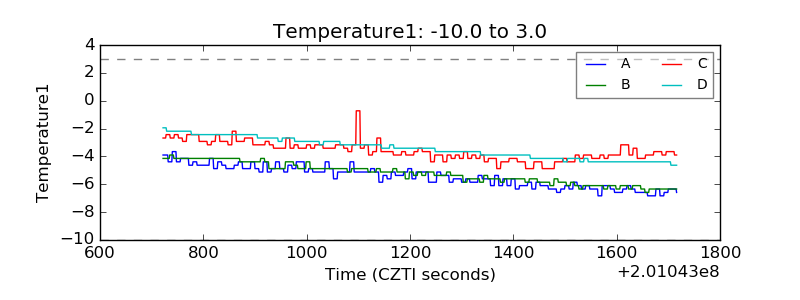 |
| Veto HV Monitor | 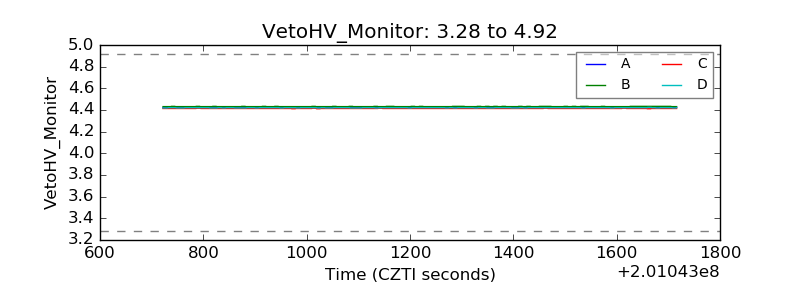 |
| Veto LLD | 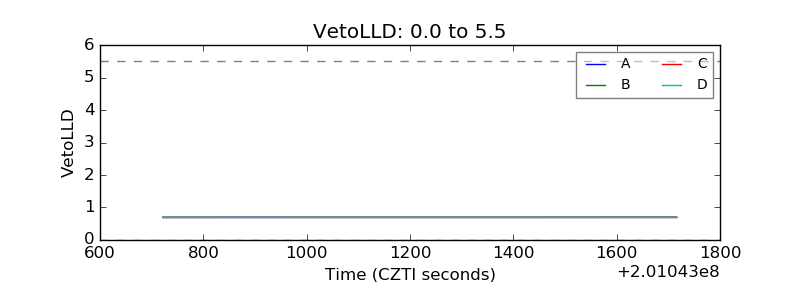 |
| Alpha Counter | 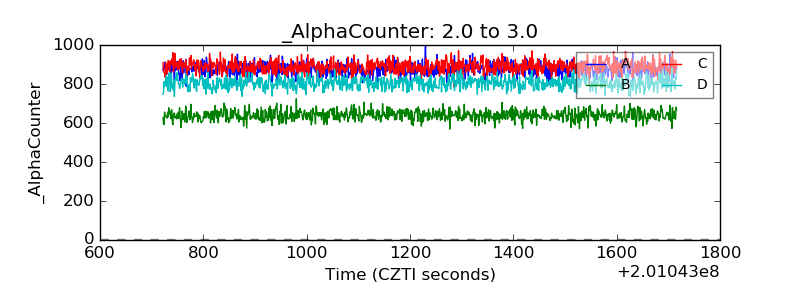 |
| _CPM_Rate | 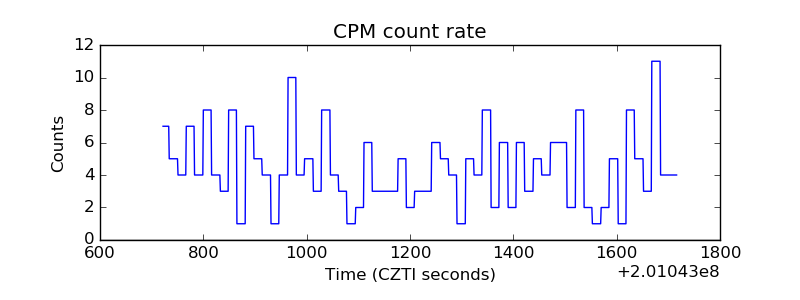 |
| CZT Counter | 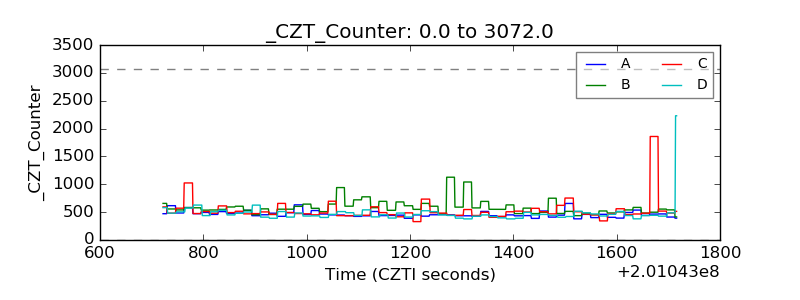 |
| +2.5 Volts monitor |  |
| +5 Volts monitor |  |
| Veto Counter | 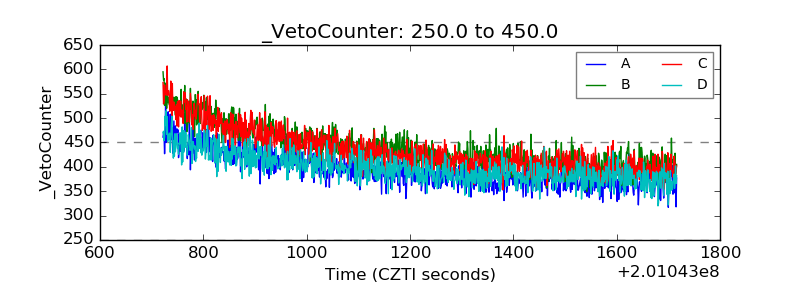 |