| Param | Original file | Final file |
|---|---|---|
| Filename | modeM0/AS1G05_209T01_9000000458cztM0_level2.fits | modeM0/AS1G05_209T01_9000000458cztM0_level2_quad_clean.evt |
| Size (bytes) | 447,168,960 | 626,215,680 |
| Size | 426.5 MB | 597.2 MB |
| Events in quadrant A | 2,606,814 | 3,972,677 |
| Events in quadrant B | 2,548,272 | 3,981,664 |
| Events in quadrant C | 2,609,672 | 3,863,026 |
| Events in quadrant D | 2,253,538 | 3,626,738 |
| Mode M9 | |||
|---|---|---|---|
| Quadrant | BADHDUFLAG | Total packets | Discarded packets |
| A | 0 | 60 | 0 |
| B | 0 | 60 | 0 |
| C | 0 | 60 | 0 |
| D | 0 | 60 | 0 |
| Mode SS | |||
|---|---|---|---|
| Quadrant | BADHDUFLAG | Total packets | Discarded packets |
| A | 0 | 1044 | 0 |
| B | 0 | 1044 | 0 |
| C | 0 | 1044 | 0 |
| D | 0 | 1044 | 0 |
| Mode M0 | |||
|---|---|---|---|
| Quadrant | BADHDUFLAG | Total packets | Discarded packets |
| A | 0 | 113916 | 0 |
| B | 0 | 118162 | 0 |
| C | 0 | 116396 | 0 |
| D | 0 | 107802 | 0 |
| Quadrant | Total seconds | Saturated seconds | Saturation percentage |
|---|---|---|---|
| A | 51356 | 1211 | 2.358050% |
| B | 51357 | 738 | 1.437000% |
| C | 51357 | 1273 | 2.478727% |
| D | 51357 | 421 | 0.819752% |
Noise dominated data is calculated using 1-second bins in cleaned event files. If a bin has >2000 counts, and if more than 50% of those come from <1% of pixels, then it is considered to be noise-dominated and hence unusable.
| Quadrant | # 1 sec bins | Bins with >0 counts | Bins with >2000 counts | High rate bins dominated by noise | Noise dominated (total time) | Noise dominated (detector-on time) | Marked lightcurve |
|---|---|---|---|---|---|---|---|
| A | 57227 | 51343 | 0 | 0 | 0.00% | 0.00% |  |
| B | 57227 | 51356 | 0 | 0 | 0.00% | 0.00% |  |
| C | 57227 | 51351 | 0 | 0 | 0.00% | 0.00% |  |
| D | 57227 | 51354 | 0 | 0 | 0.00% | 0.00% |  |
Top three noisy pixels from each quadrant. If the there are fewer than three noisy pixels in the level2.evt file, extra rows are filled as -1
| Pixel properties | Quadrant properties | ||||||
|---|---|---|---|---|---|---|---|
| Quadrant | DetID | PixID | Counts | Sigma | Mean | Median | Sigma |
| A | 0 | 29 | 2643 | 11.17 | 680 | 635 | 179.7 |
| A | 7 | 110 | 2257 | 9.03 | 680 | 635 | 179.7 |
| A | 0 | 30 | 2021 | 7.71 | 680 | 635 | 179.7 |
| B | 2 | 9 | 2184 | 11.44 | 674 | 642 | 134.7 |
| B | 12 | 226 | 1839 | 8.88 | 674 | 642 | 134.7 |
| B | 14 | 254 | 1802 | 8.61 | 674 | 642 | 134.7 |
| C | 1 | 81 | 1916 | 7.03 | 690 | 642 | 181.3 |
| C | 1 | 80 | 1905 | 6.96 | 690 | 642 | 181.3 |
| C | 12 | 241 | 1837 | 6.59 | 690 | 642 | 181.3 |
| D | 6 | 231 | 1695 | 6.39 | 645 | 585 | 173.8 |
| D | 7 | 5 | 1677 | 6.28 | 645 | 585 | 173.8 |
| D | 6 | 44 | 1625 | 5.98 | 645 | 585 | 173.8 |
Histogram calculated using DETX and DETY for each event in the final _common_clean file
| Quadrant A |  |
 |
Quadrant B |
|---|---|---|---|
| Quadrant D | 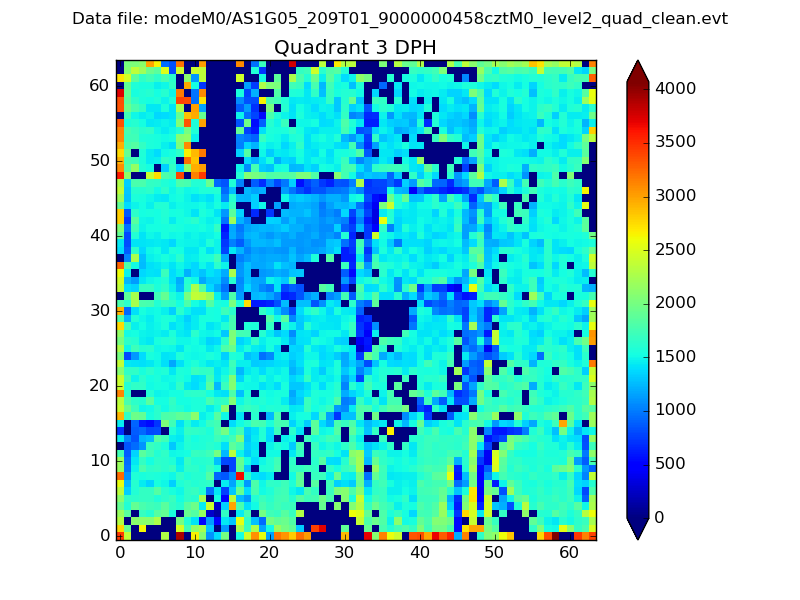 |
 |
Quadrant C |
| Plot type | Count rate plots | Images |
|---|---|---|
| Comparison with Poisson distribution Blue bars denote a histogram of data divided into 1 sec bins. Red curve is a Poisson curve with rate = median count rate of data. |
 |
 |
| Quadrant-wise count rates Data is divided into 100 sec bins |
 |
|
| Module-wise count rates for Quadrant A Data is divided into 100 sec bins |
 |
 |
| Module-wise count rates for Quadrant B Data is divided into 100 sec bins |
 |
 |
| Module-wise count rates for Quadrant C Data is divided into 100 sec bins |
 |
 |
| Module-wise count rates for Quadrant D Data is divided into 100 sec bins |
 |
 |
| Parameter | Plot |
|---|---|
| CZT HV Monitor |  |
| D_VDD | 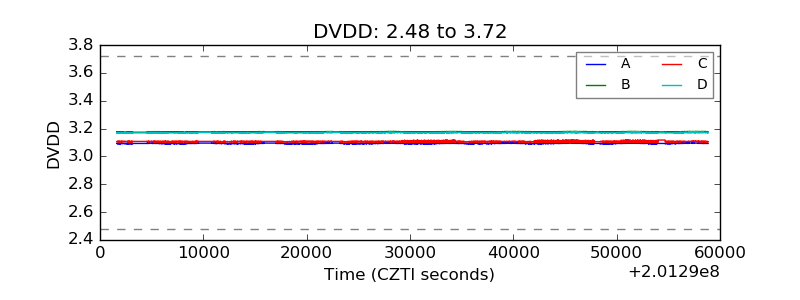 |
| Temperature 1 |  |
| Veto HV Monitor |  |
| Veto LLD |  |
| Alpha Counter |  |
| _CPM_Rate |  |
| CZT Counter |  |
| +2.5 Volts monitor |  |
| +5 Volts monitor |  |
| _ROLL_ROT |  |
| _Roll_DEC |  |
| _Roll_RA |  |
| Veto Counter |  |