| Param | Original file | Final file |
|---|---|---|
| Filename | modeM0/AS1G05_209T01_9000000458_03459cztM0_level2.evt | modeM0/AS1G05_209T01_9000000458_03459cztM0_level2_quad_clean.evt |
| Size (bytes) | 202,345,920 | 55,471,680 |
| Size | 193.0 MB | 52.9 MB |
| Events in quadrant A | 1,403,767 | 364,954 |
| Events in quadrant B | 1,556,452 | 374,087 |
| Events in quadrant C | 1,586,496 | 373,513 |
| Events in quadrant D | 1,379,934 | 357,978 |
| Mode M9 | |||
|---|---|---|---|
| Quadrant | BADHDUFLAG | Total packets | Discarded packets |
| A | 0 | 14 | 0 |
| B | 0 | 14 | 0 |
| C | 0 | 14 | 0 |
| D | 0 | 14 | 0 |
| Mode SS | |||
|---|---|---|---|
| Quadrant | BADHDUFLAG | Total packets | Discarded packets |
| A | 0 | 60 | 0 |
| B | 0 | 60 | 0 |
| C | 0 | 60 | 0 |
| D | 0 | 60 | 0 |
| Mode M0 | |||
|---|---|---|---|
| Quadrant | BADHDUFLAG | Total packets | Discarded packets |
| A | 0 | 6158 | 2 |
| B | 0 | 6603 | 1 |
| C | 0 | 6669 | 1 |
| D | 0 | 6218 | 1 |
| Quadrant | Total seconds | Saturated seconds | Saturation percentage |
|---|---|---|---|
| A | 2935 | 40 | 1.362862% |
| B | 2935 | 28 | 0.954003% |
| C | 2935 | 64 | 2.180579% |
| D | 2935 | 17 | 0.579216% |
Noise dominated data is calculated using 1-second bins in cleaned event files. If a bin has >2000 counts, and if more than 50% of those come from <1% of pixels, then it is considered to be noise-dominated and hence unusable.
| Quadrant | # 1 sec bins | Bins with >0 counts | Bins with >2000 counts | High rate bins dominated by noise | Noise dominated (total time) | Noise dominated (detector-on time) | Marked lightcurve |
|---|---|---|---|---|---|---|---|
| A | 4290 | 2936 | 12 | 12 | 0.28% | 0.41% | 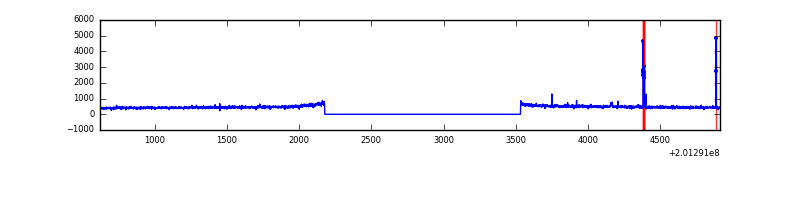 |
| B | 4290 | 2936 | 3 | 3 | 0.07% | 0.10% | 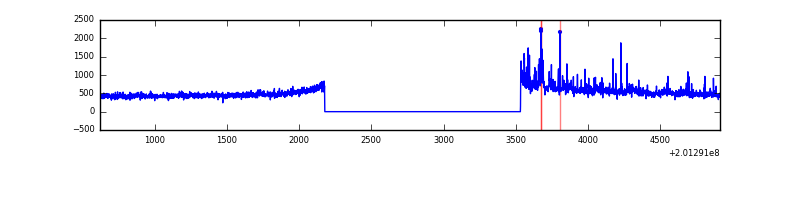 |
| C | 4290 | 2936 | 43 | 43 | 1.00% | 1.46% | 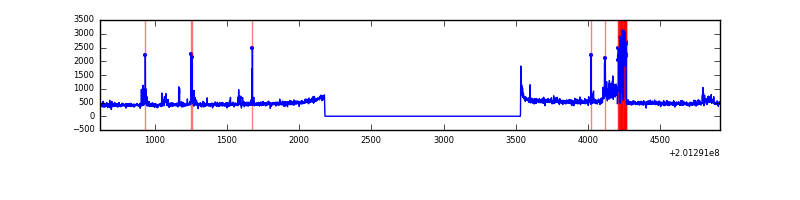 |
| D | 4290 | 2936 | 3 | 3 | 0.07% | 0.10% |  |
Top three noisy pixels from each quadrant. If the there are fewer than three noisy pixels in the level2.evt file, extra rows are filled as -1
| Pixel properties | Quadrant properties | ||||||
|---|---|---|---|---|---|---|---|
| Quadrant | DetID | PixID | Counts | Sigma | Mean | Median | Sigma |
| A | 0 | 118 | 41443 | 562.97 | 351 | 343 | 73.0 |
| A | 0 | 226 | 7501 | 98.05 | 351 | 343 | 73.0 |
| A | 12 | 194 | 3774 | 47.0 | 351 | 343 | 73.0 |
| B | 15 | 204 | 112640 | 1624.04 | 360 | 351 | 69.1 |
| B | 0 | 229 | 21960 | 312.53 | 360 | 351 | 69.1 |
| B | 4 | 81 | 21683 | 308.53 | 360 | 351 | 69.1 |
| C | 1 | 192 | 165812 | 2082.39 | 346 | 347 | 79.5 |
| C | 14 | 234 | 27277 | 338.91 | 346 | 347 | 79.5 |
| C | 9 | 144 | 18969 | 234.35 | 346 | 347 | 79.5 |
| D | 10 | 172 | 53180 | 636.11 | 345 | 335 | 83.1 |
| D | 2 | 37 | 8802 | 101.92 | 345 | 335 | 83.1 |
| D | 10 | 34 | 4769 | 53.37 | 345 | 335 | 83.1 |
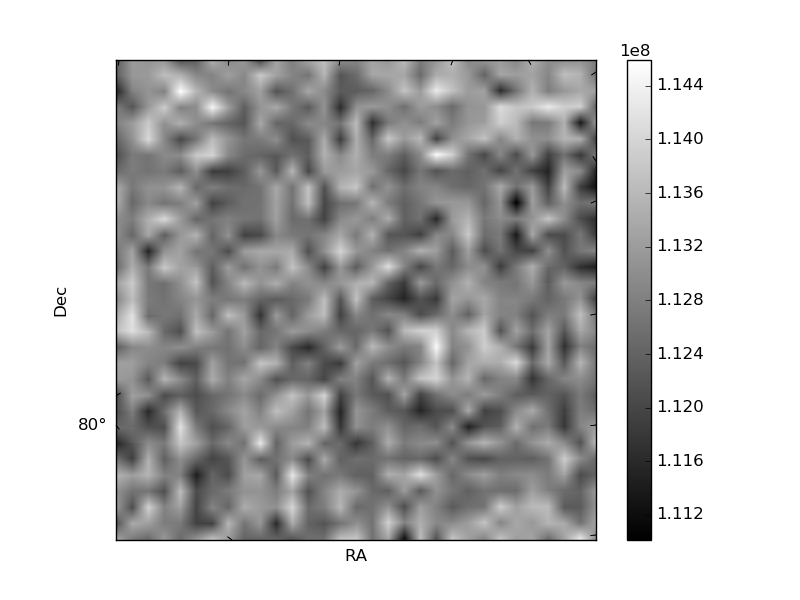
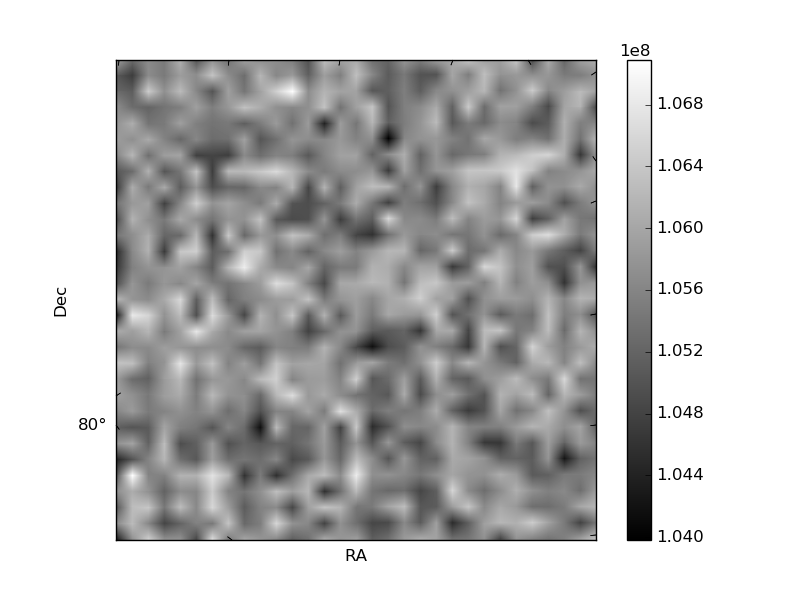
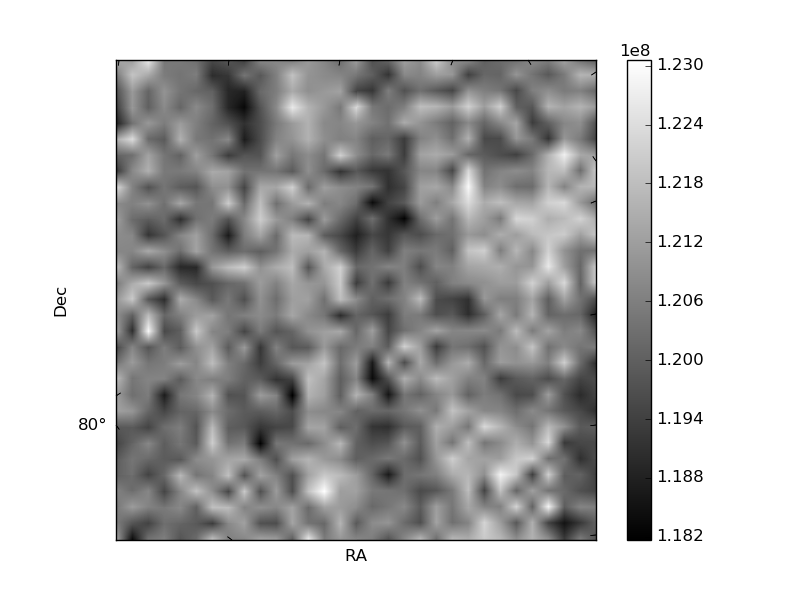
Histogram calculated using DETX and DETY for each event in the final _common_clean file
| Quadrant A | 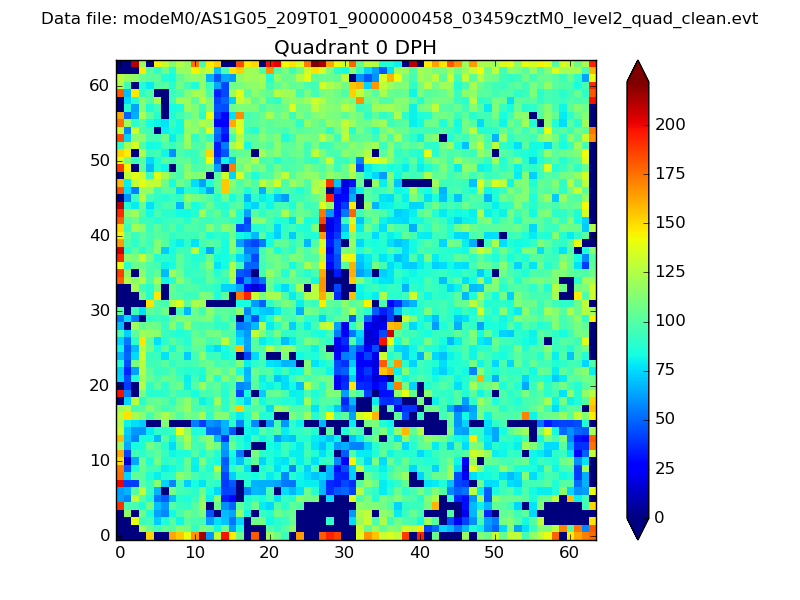 |
 |
Quadrant B |
|---|---|---|---|
| Quadrant D |  |
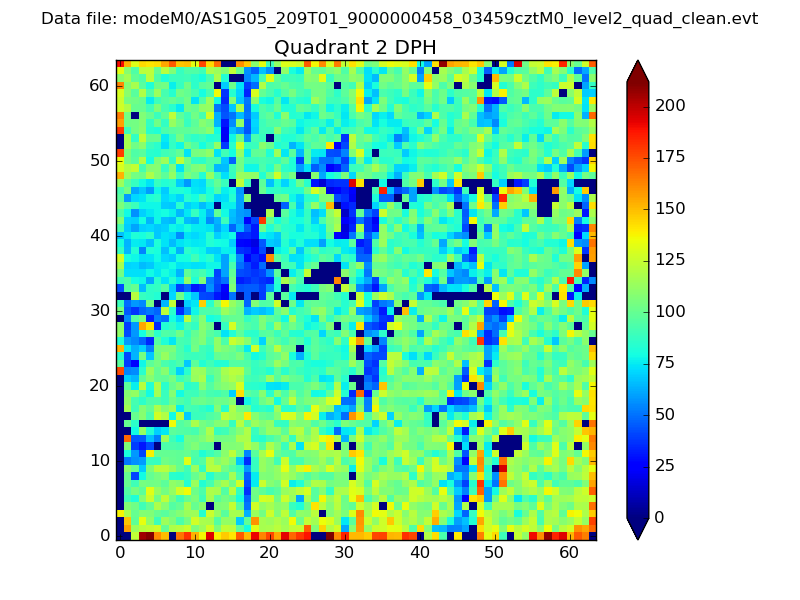 |
Quadrant C |
| Plot type | Count rate plots | Images |
|---|---|---|
| Comparison with Poisson distribution Blue bars denote a histogram of data divided into 1 sec bins. Red curve is a Poisson curve with rate = median count rate of data. |
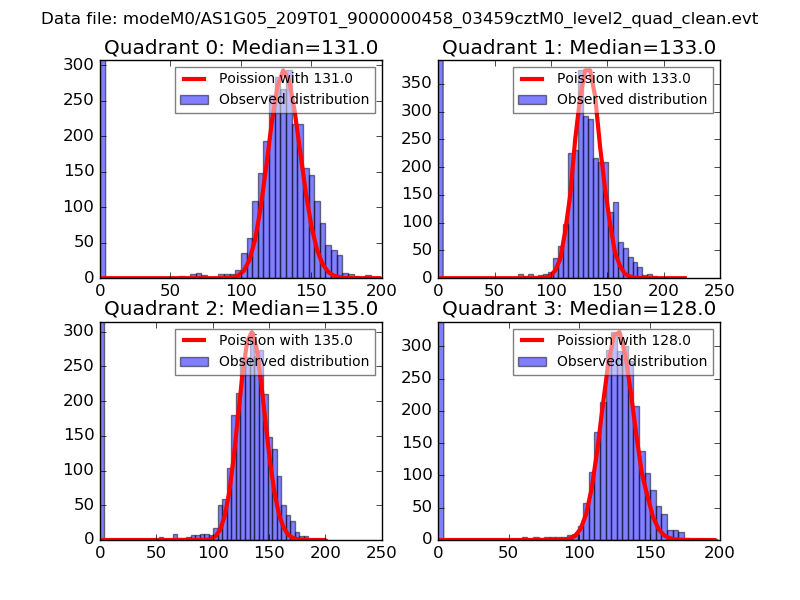 |
 |
| Quadrant-wise count rates Data is divided into 100 sec bins |
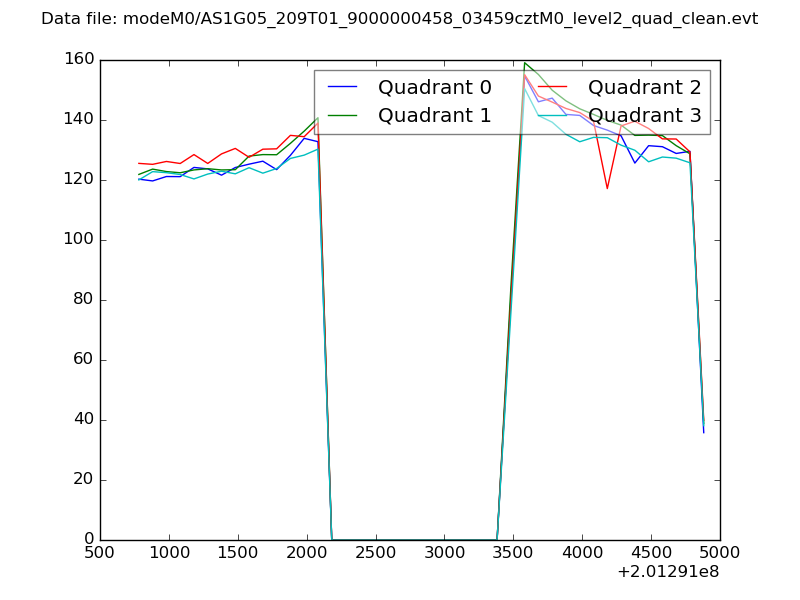 |
|
| Module-wise count rates for Quadrant A Data is divided into 100 sec bins |
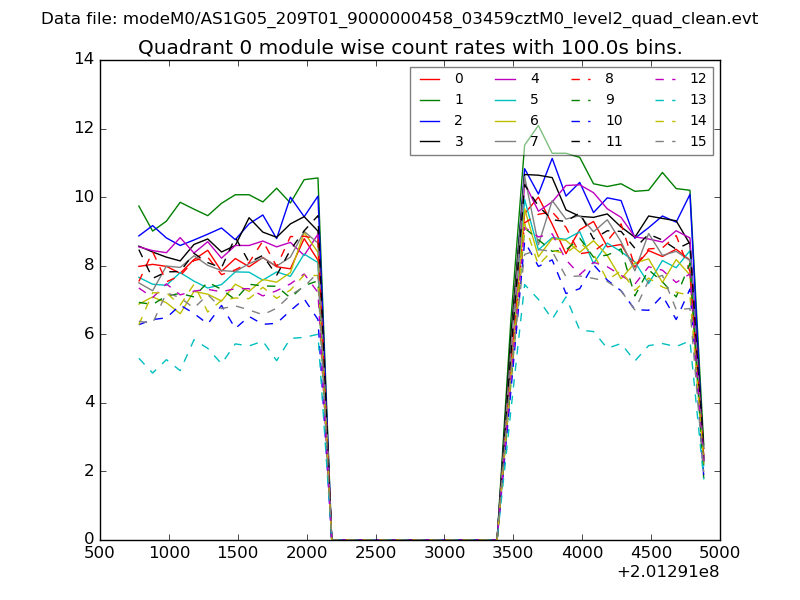 |
 |
| Module-wise count rates for Quadrant B Data is divided into 100 sec bins |
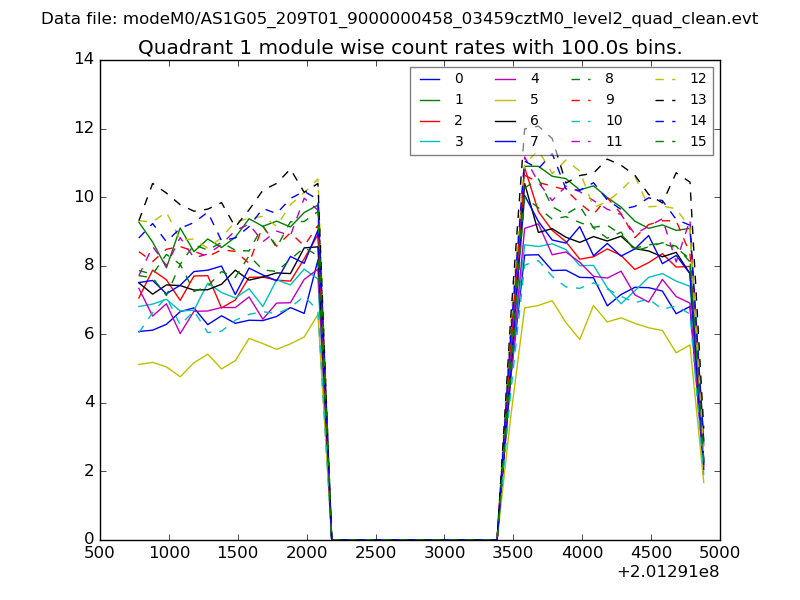 |
 |
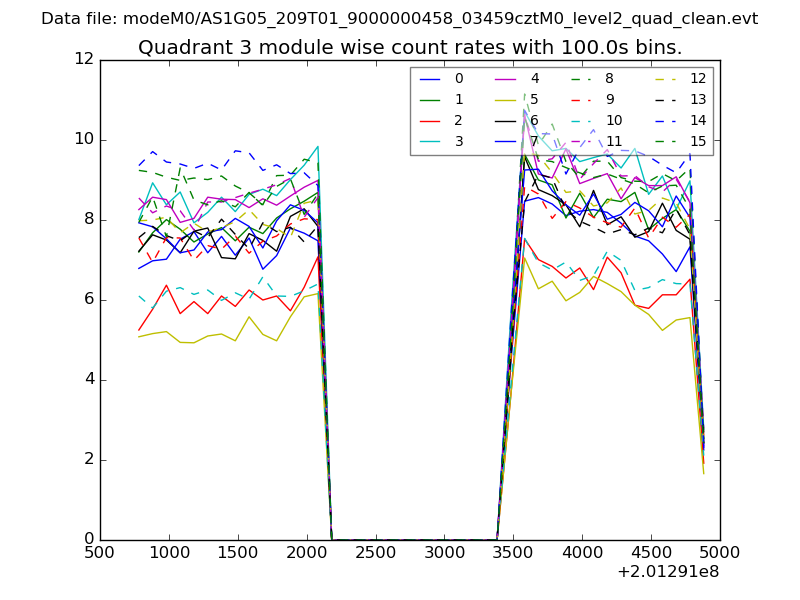
| Module-wise count rates for Quadrant C Data is divided into 100 sec bins |
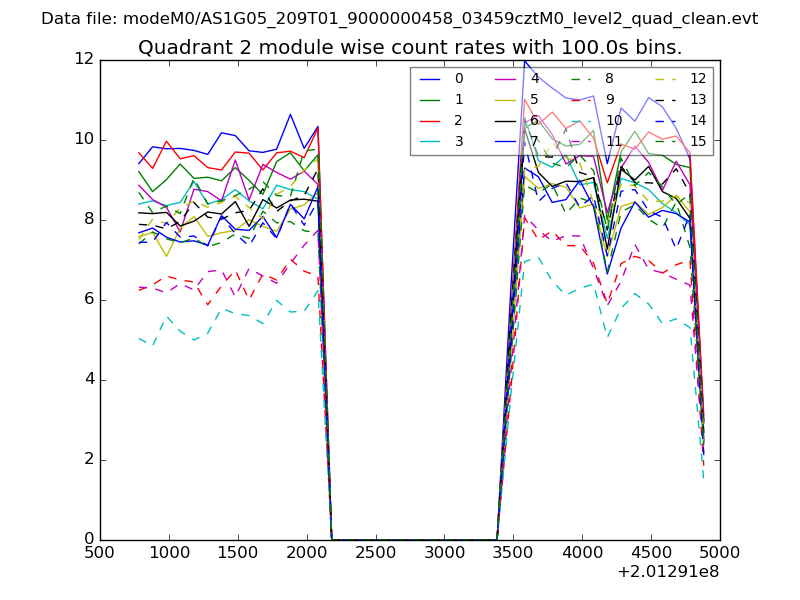 |
 |
| Module-wise count rates for Quadrant D Data is divided into 100 sec bins |
 |
 |
| Parameter | Plot |
|---|---|
| CZT HV Monitor | 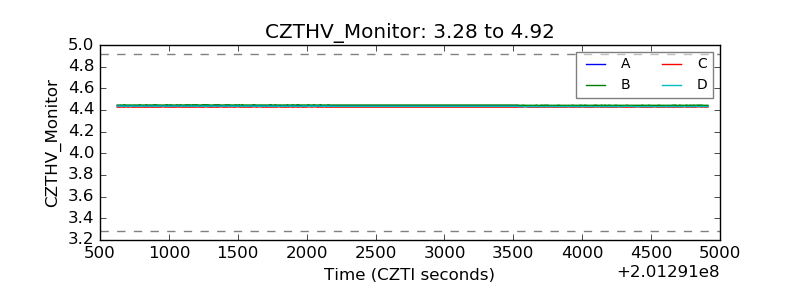 |
| D_VDD | 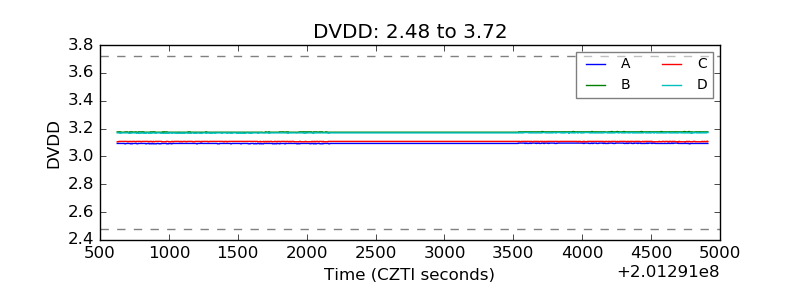 |
| Temperature 1 | 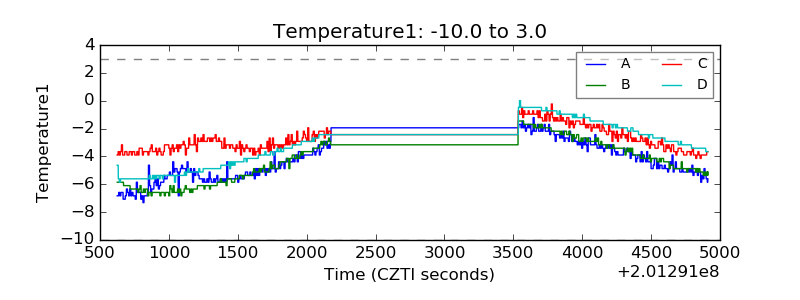 |
| Veto HV Monitor | 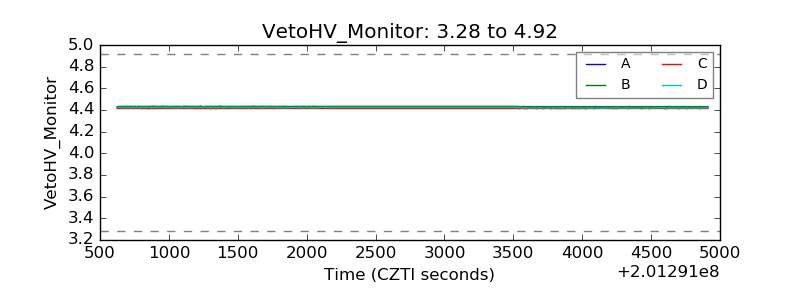 |
| Veto LLD | 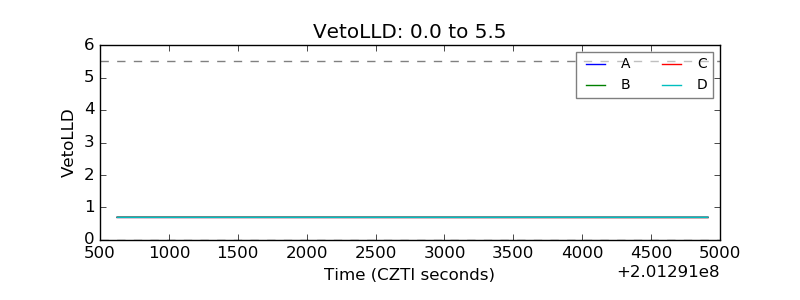 |
| Alpha Counter | 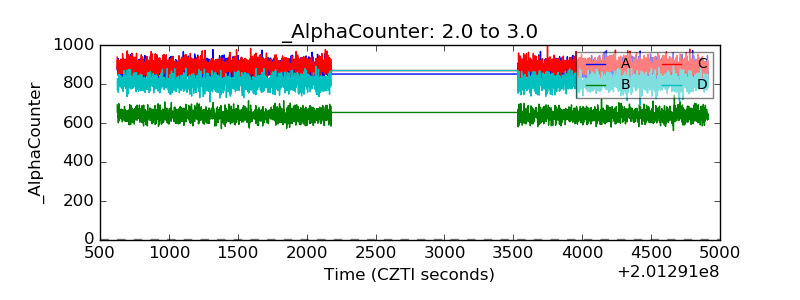 |
| _CPM_Rate | 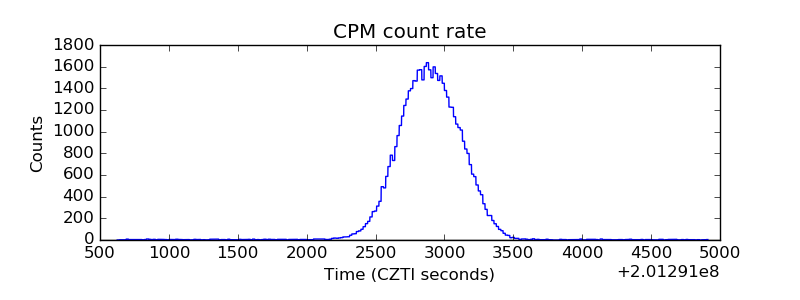 |
| CZT Counter | 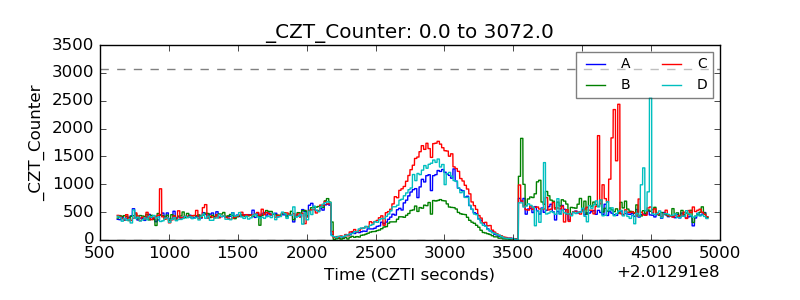 |
| +2.5 Volts monitor |  |
| +5 Volts monitor |  |
| _ROLL_ROT | 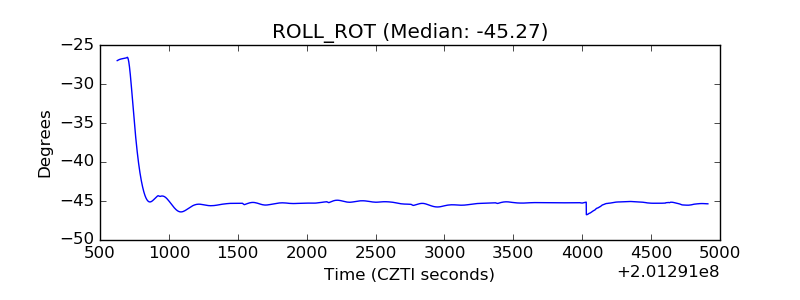 |
| _Roll_DEC | 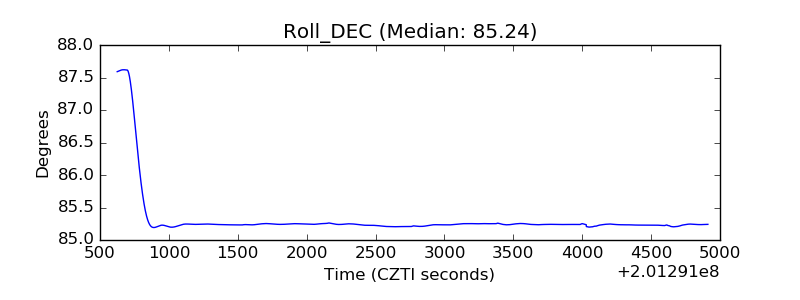 |
| _Roll_RA | 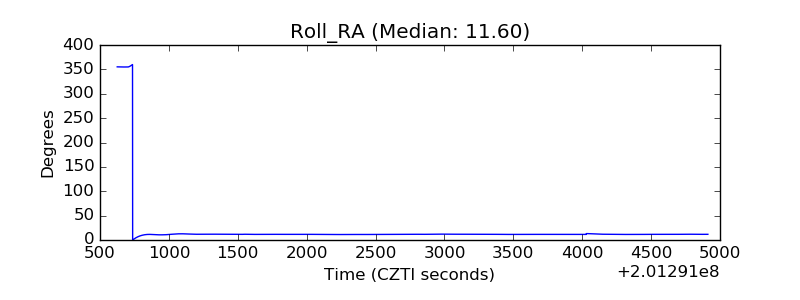 |
| Veto Counter | 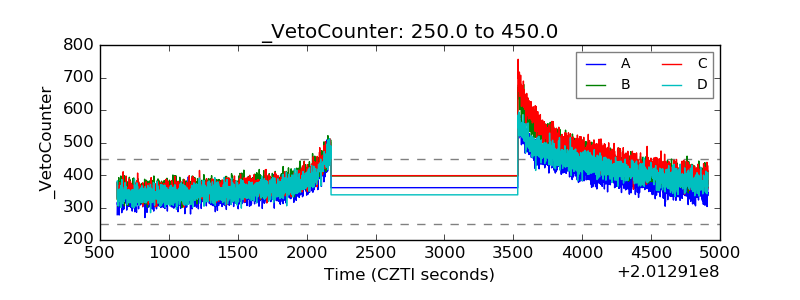 |