| Param | Original file | Final file |
|---|---|---|
| Filename | modeM0/AS1G05_209T01_9000000458_03461cztM0_level2.evt | modeM0/AS1G05_209T01_9000000458_03461cztM0_level2_quad_clean.evt |
| Size (bytes) | 435,792,960 | 104,160,960 |
| Size | 415.6 MB | 99.3 MB |
| Events in quadrant A | 2,981,138 | 669,738 |
| Events in quadrant B | 3,644,294 | 672,077 |
| Events in quadrant C | 3,169,120 | 696,167 |
| Events in quadrant D | 2,964,868 | 666,595 |
| Mode M9 | |||
|---|---|---|---|
| Quadrant | BADHDUFLAG | Total packets | Discarded packets |
| A | 0 | 15 | 0 |
| B | 0 | 15 | 0 |
| C | 0 | 15 | 0 |
| D | 0 | 16 | 0 |
| Mode SS | |||
|---|---|---|---|
| Quadrant | BADHDUFLAG | Total packets | Discarded packets |
| A | 0 | 132 | 0 |
| B | 0 | 132 | 0 |
| C | 0 | 132 | 0 |
| D | 0 | 132 | 0 |
| Mode M0 | |||
|---|---|---|---|
| Quadrant | BADHDUFLAG | Total packets | Discarded packets |
| A | 0 | 13679 | 3 |
| B | 0 | 15370 | 2 |
| C | 0 | 14250 | 2 |
| D | 0 | 13672 | 2 |
| Quadrant | Total seconds | Saturated seconds | Saturation percentage |
|---|---|---|---|
| A | 6446 | 57 | 0.884269% |
| B | 6446 | 118 | 1.830593% |
| C | 6446 | 47 | 0.729134% |
| D | 6446 | 33 | 0.511945% |
Noise dominated data is calculated using 1-second bins in cleaned event files. If a bin has >2000 counts, and if more than 50% of those come from <1% of pixels, then it is considered to be noise-dominated and hence unusable.
| Quadrant | # 1 sec bins | Bins with >0 counts | Bins with >2000 counts | High rate bins dominated by noise | Noise dominated (total time) | Noise dominated (detector-on time) | Marked lightcurve |
|---|---|---|---|---|---|---|---|
| A | 7556 | 6447 | 25 | 25 | 0.33% | 0.39% | 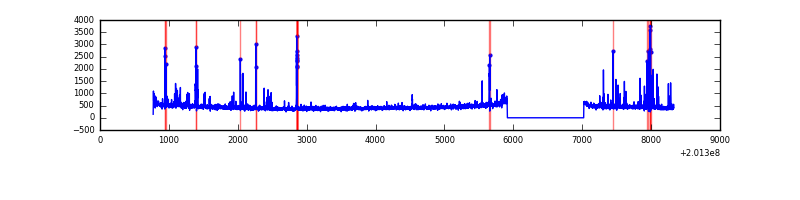 |
| B | 7556 | 6447 | 53 | 53 | 0.70% | 0.82% | 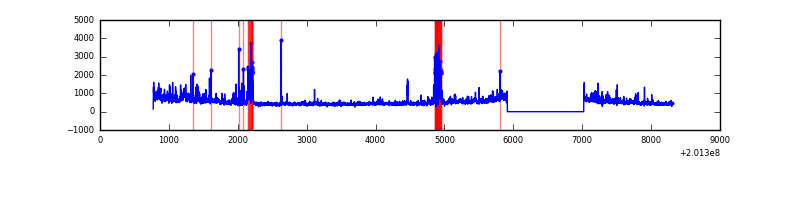 |
| C | 7556 | 6447 | 28 | 28 | 0.37% | 0.43% | 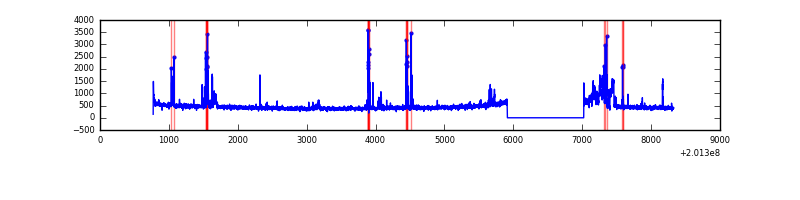 |
| D | 7556 | 6447 | 21 | 21 | 0.28% | 0.33% |  |
Top three noisy pixels from each quadrant. If the there are fewer than three noisy pixels in the level2.evt file, extra rows are filled as -1
| Pixel properties | Quadrant properties | ||||||
|---|---|---|---|---|---|---|---|
| Quadrant | DetID | PixID | Counts | Sigma | Mean | Median | Sigma |
| A | 0 | 118 | 113911 | 797.88 | 702 | 687 | 141.9 |
| A | 0 | 149 | 61360 | 427.56 | 702 | 687 | 141.9 |
| A | 0 | 50 | 40275 | 278.97 | 702 | 687 | 141.9 |
| B | 15 | 204 | 492555 | 3658.38 | 715 | 698 | 134.4 |
| B | 0 | 219 | 201523 | 1493.71 | 715 | 698 | 134.4 |
| B | 4 | 239 | 84139 | 620.62 | 715 | 698 | 134.4 |
| C | 6 | 80 | 164809 | 1017.27 | 701 | 708 | 161.3 |
| C | 14 | 223 | 159767 | 986.02 | 701 | 708 | 161.3 |
| C | 1 | 192 | 71921 | 441.45 | 701 | 708 | 161.3 |
| D | 13 | 223 | 76238 | 450.8 | 692 | 672 | 167.6 |
| D | 5 | 233 | 71611 | 423.19 | 692 | 672 | 167.6 |
| D | 13 | 25 | 55845 | 329.14 | 692 | 672 | 167.6 |
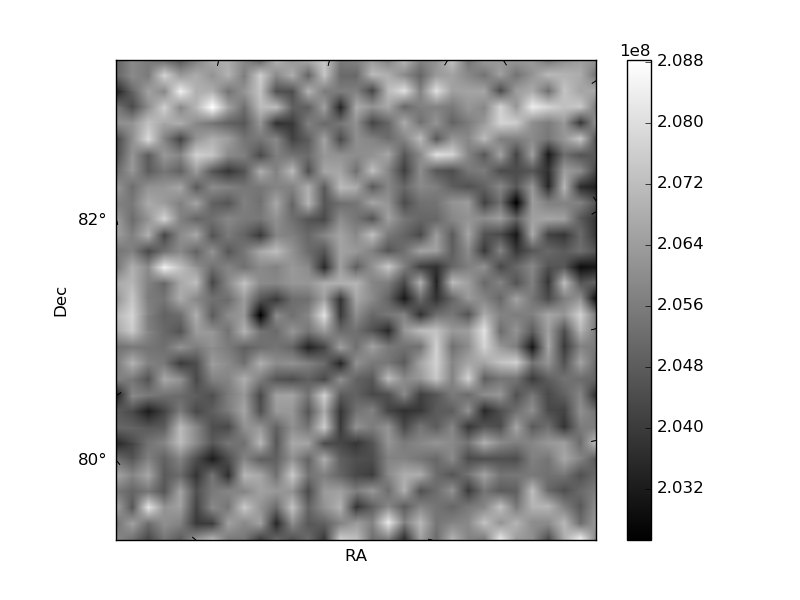
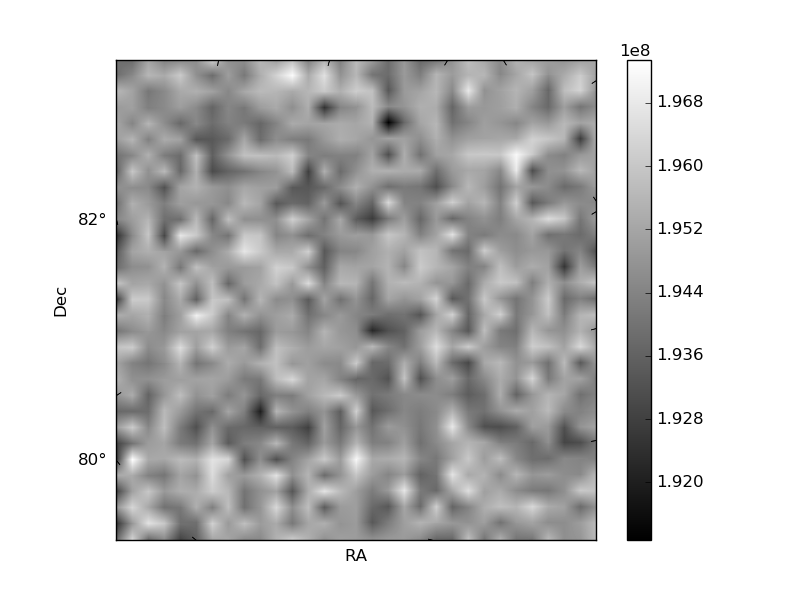
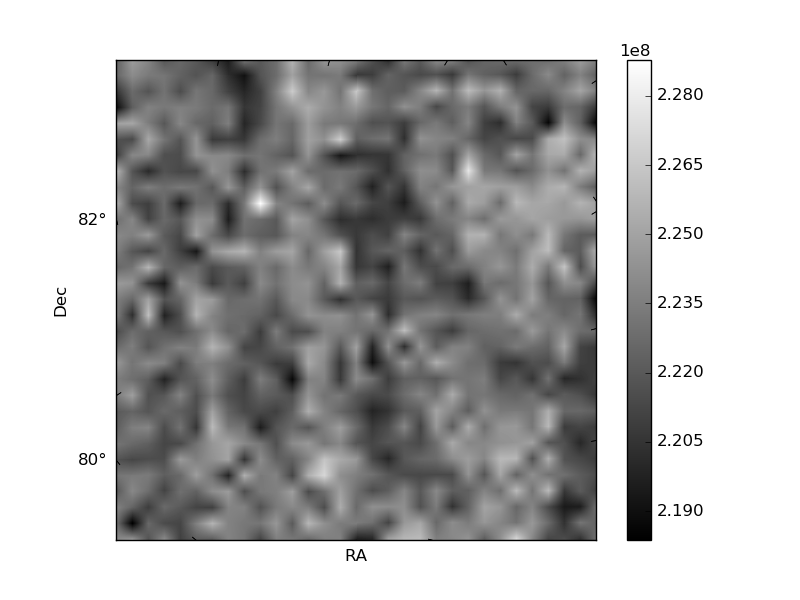
Histogram calculated using DETX and DETY for each event in the final _common_clean file
| Quadrant A | 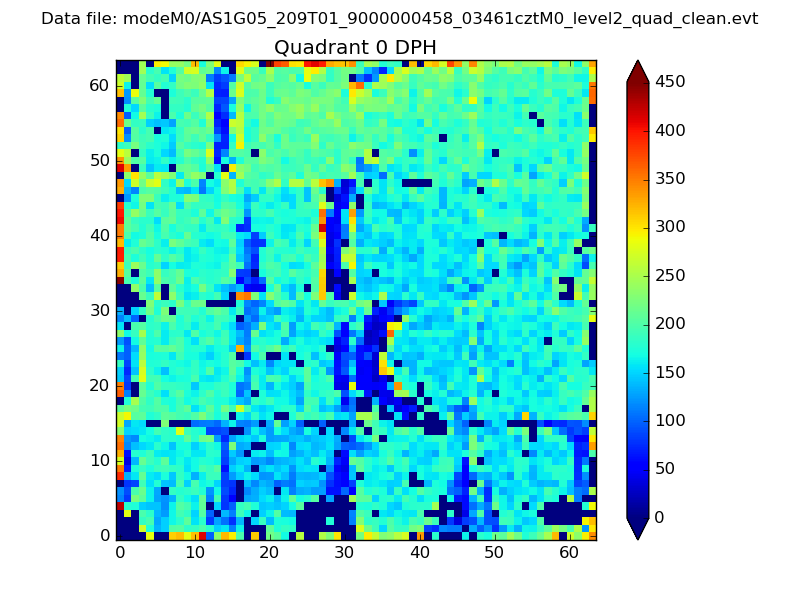 |
 |
Quadrant B |
|---|---|---|---|
| Quadrant D |  |
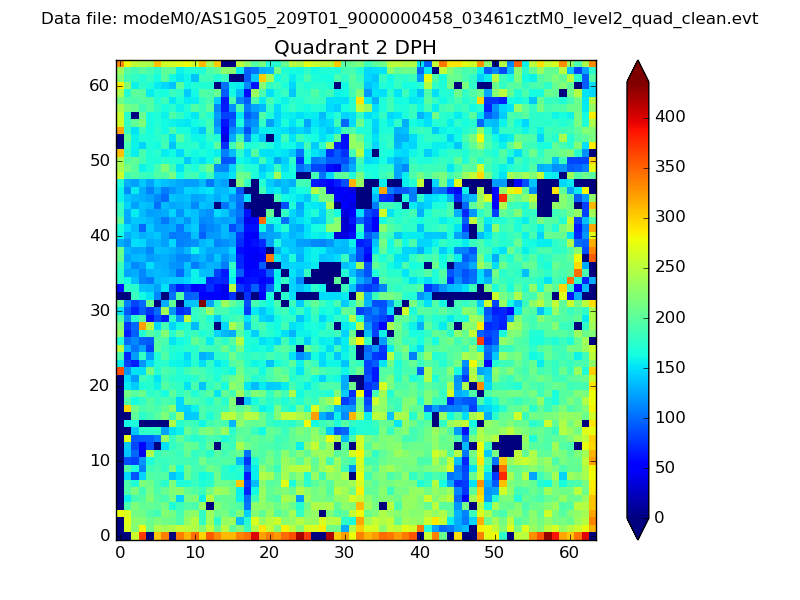 |
Quadrant C |
| Plot type | Count rate plots | Images |
|---|---|---|
| Comparison with Poisson distribution Blue bars denote a histogram of data divided into 1 sec bins. Red curve is a Poisson curve with rate = median count rate of data. |
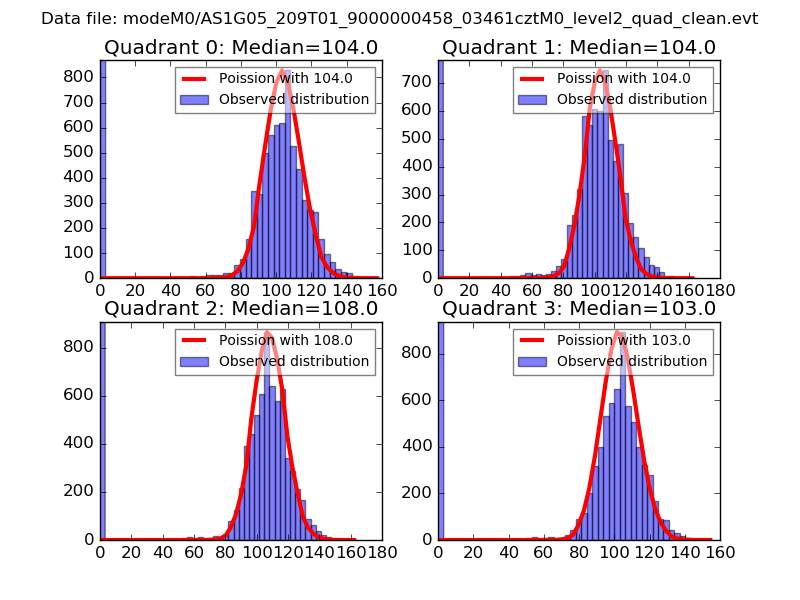 |
 |
| Quadrant-wise count rates Data is divided into 100 sec bins |
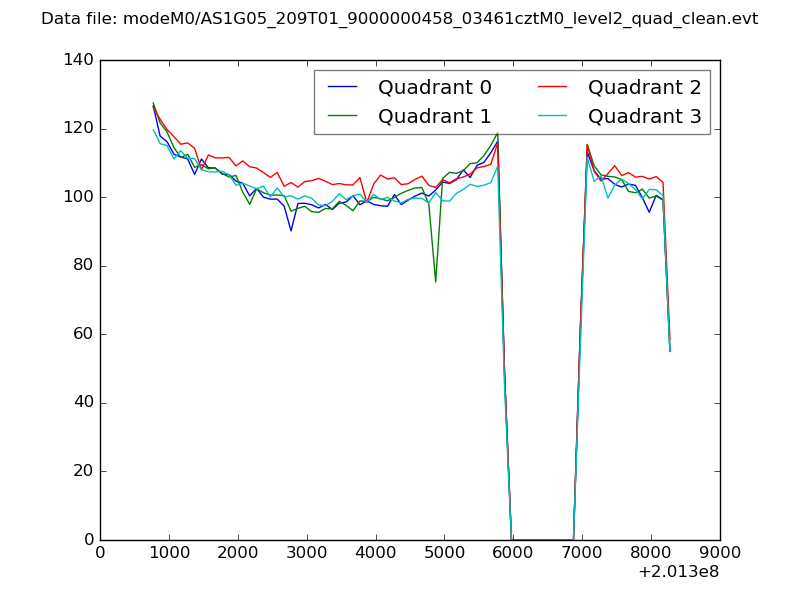 |
|
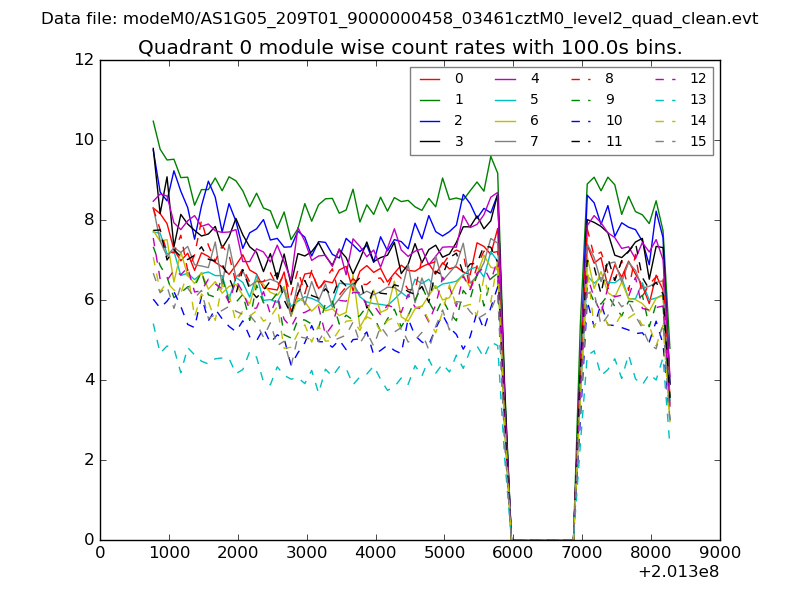
| Module-wise count rates for Quadrant A Data is divided into 100 sec bins |
 |
 |
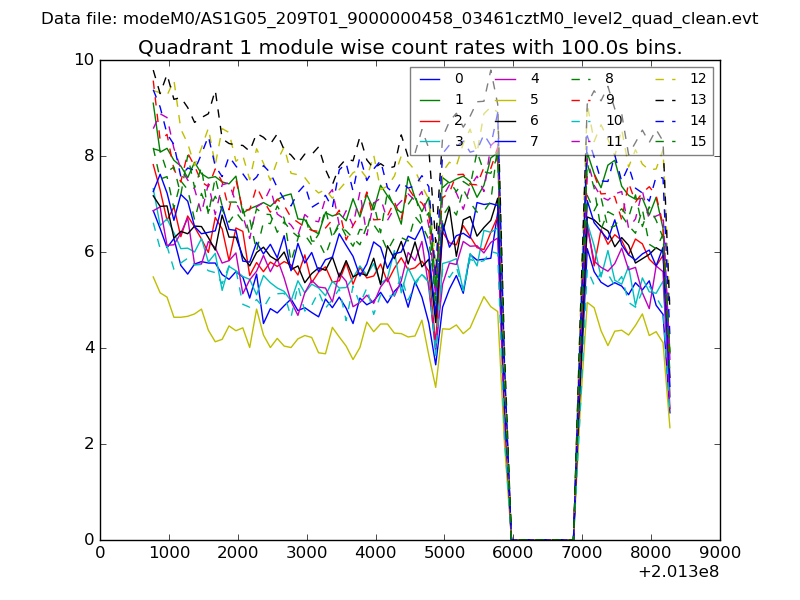
| Module-wise count rates for Quadrant B Data is divided into 100 sec bins |
 |
 |
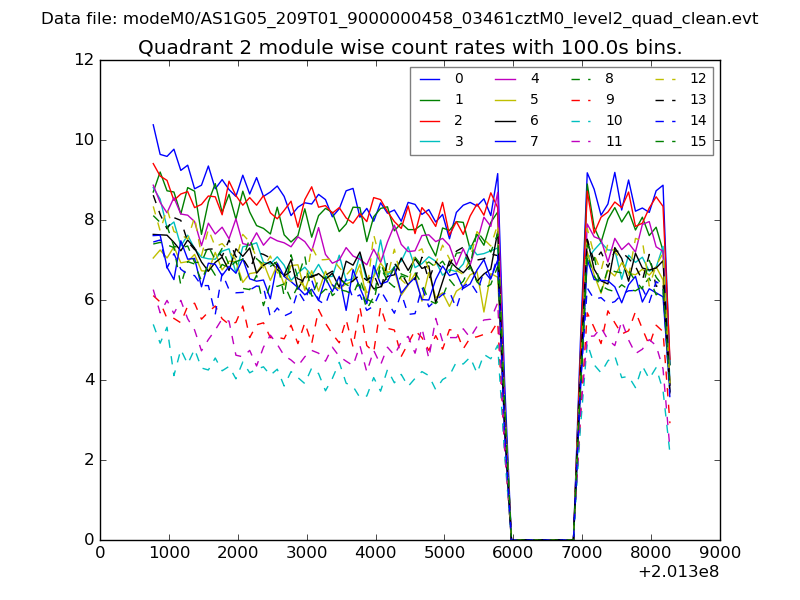
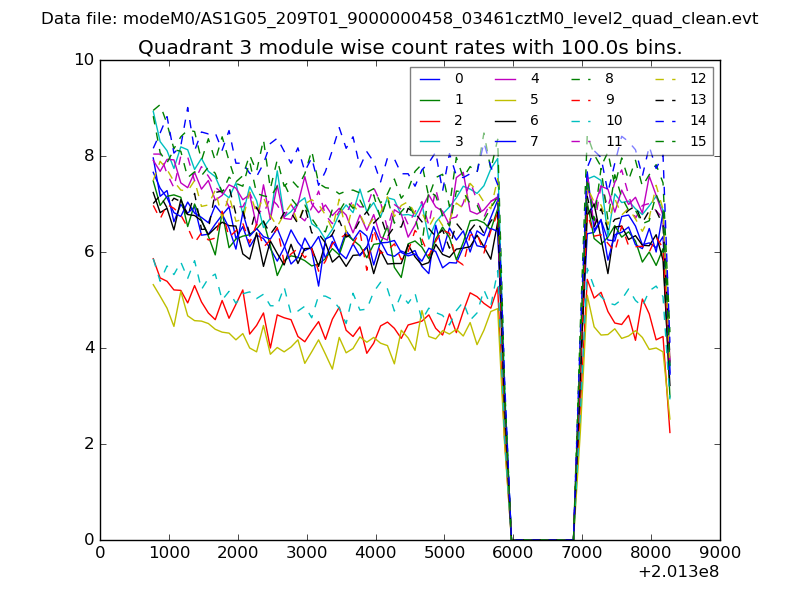
| Module-wise count rates for Quadrant C Data is divided into 100 sec bins |
 |
 |
| Module-wise count rates for Quadrant D Data is divided into 100 sec bins |
 |
 |
| Parameter | Plot |
|---|---|
| CZT HV Monitor | 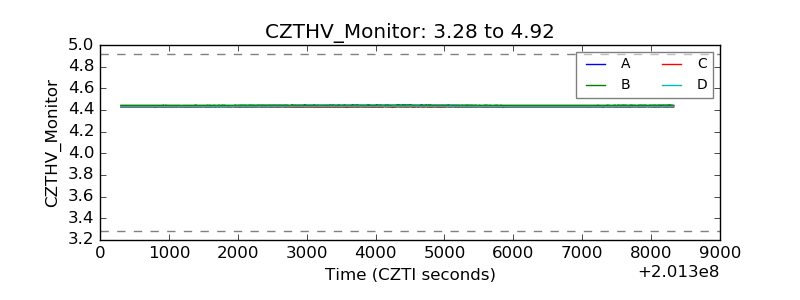 |
| D_VDD | 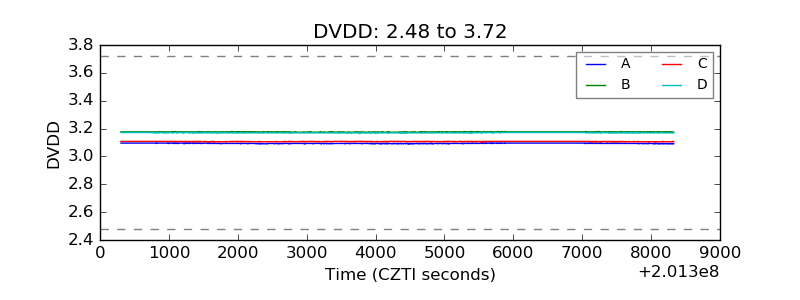 |
| Temperature 1 | 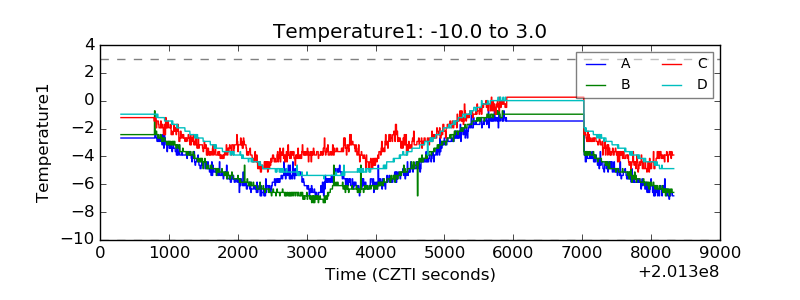 |
| Veto HV Monitor | 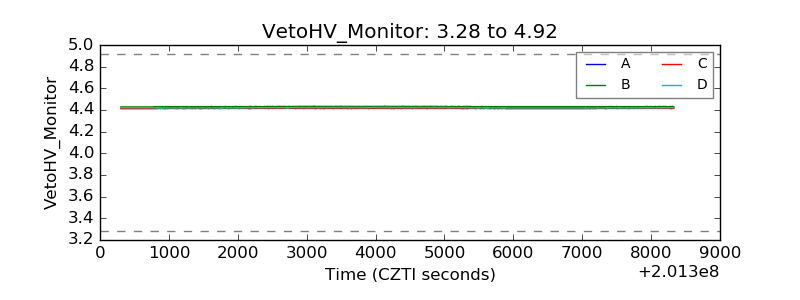 |
| Veto LLD | 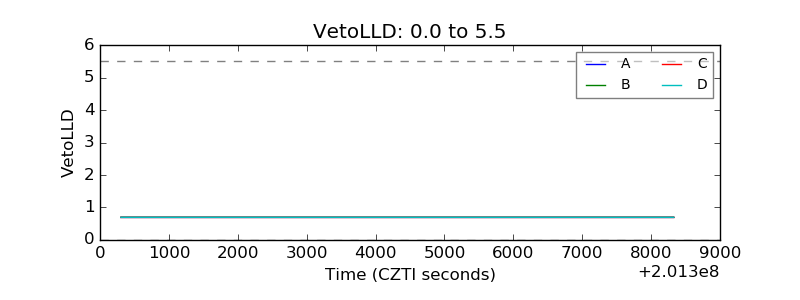 |
| Alpha Counter | 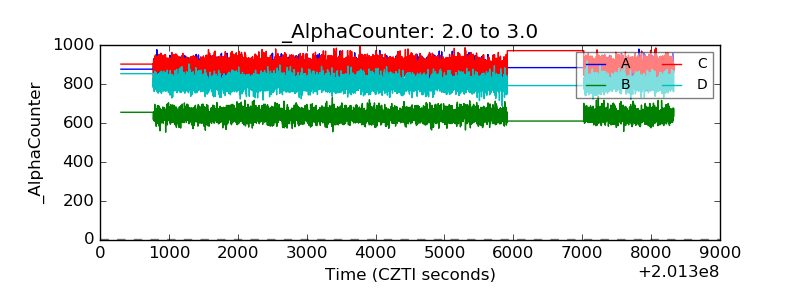 |
| _CPM_Rate | 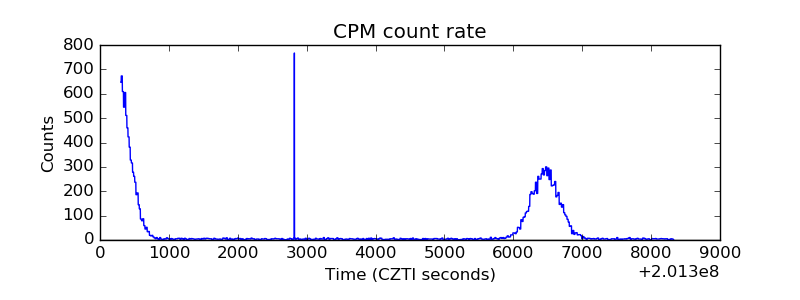 |
| CZT Counter | 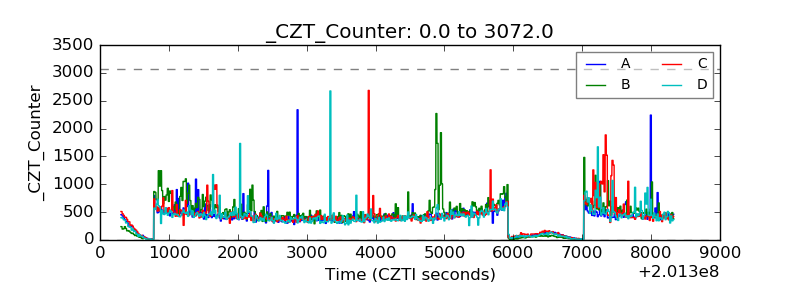 |
| +2.5 Volts monitor |  |
| +5 Volts monitor |  |
| _ROLL_ROT | 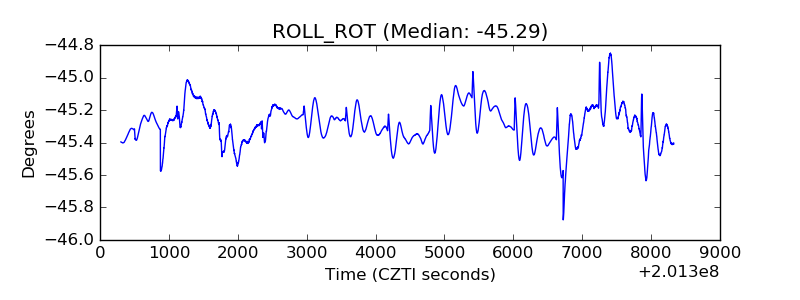 |
| _Roll_DEC | 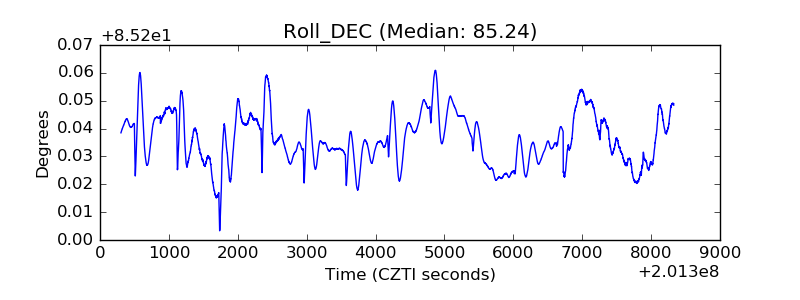 |
| _Roll_RA | 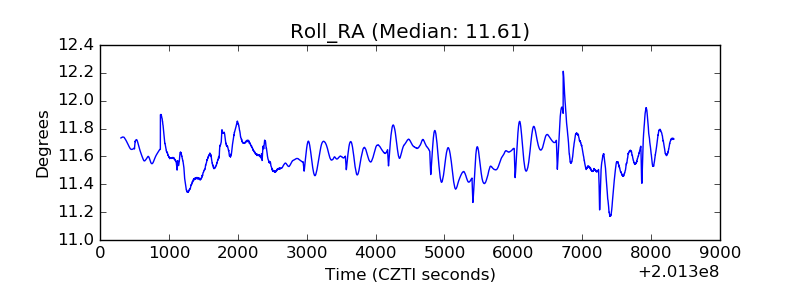 |
| Veto Counter | 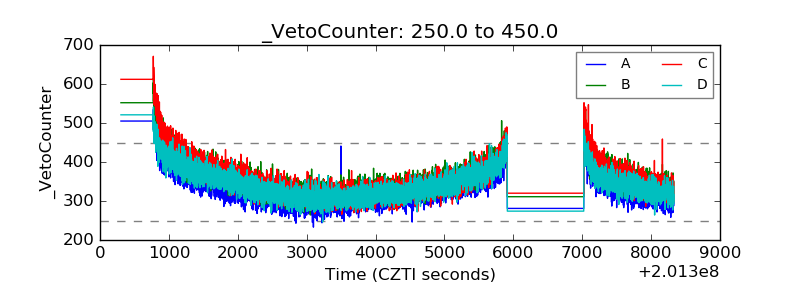 |