| Param | Original file | Final file |
|---|---|---|
| Filename | modeM0/AS1G05_209T01_9000000458_03462cztM0_level2.evt | modeM0/AS1G05_209T01_9000000458_03462cztM0_level2_quad_clean.evt |
| Size (bytes) | 469,166,400 | 110,269,440 |
| Size | 447.4 MB | 105.2 MB |
| Events in quadrant A | 3,235,221 | 711,066 |
| Events in quadrant B | 3,647,800 | 710,215 |
| Events in quadrant C | 3,594,249 | 728,314 |
| Events in quadrant D | 3,254,803 | 701,525 |
| Mode M9 | |||
|---|---|---|---|
| Quadrant | BADHDUFLAG | Total packets | Discarded packets |
| A | 0 | 14 | 0 |
| B | 0 | 14 | 0 |
| C | 0 | 14 | 0 |
| D | 0 | 15 | 0 |
| Mode SS | |||
|---|---|---|---|
| Quadrant | BADHDUFLAG | Total packets | Discarded packets |
| A | 0 | 142 | 0 |
| B | 0 | 142 | 0 |
| C | 0 | 142 | 0 |
| D | 0 | 142 | 0 |
| Mode M0 | |||
|---|---|---|---|
| Quadrant | BADHDUFLAG | Total packets | Discarded packets |
| A | 0 | 14850 | 3 |
| B | 0 | 15876 | 2 |
| C | 0 | 16089 | 2 |
| D | 0 | 14953 | 2 |
| Quadrant | Total seconds | Saturated seconds | Saturation percentage |
|---|---|---|---|
| A | 7016 | 54 | 0.769669% |
| B | 7016 | 48 | 0.684151% |
| C | 7016 | 87 | 1.240023% |
| D | 7016 | 45 | 0.641391% |
Noise dominated data is calculated using 1-second bins in cleaned event files. If a bin has >2000 counts, and if more than 50% of those come from <1% of pixels, then it is considered to be noise-dominated and hence unusable.
| Quadrant | # 1 sec bins | Bins with >0 counts | Bins with >2000 counts | High rate bins dominated by noise | Noise dominated (total time) | Noise dominated (detector-on time) | Marked lightcurve |
|---|---|---|---|---|---|---|---|
| A | 7711 | 7017 | 30 | 30 | 0.39% | 0.43% | 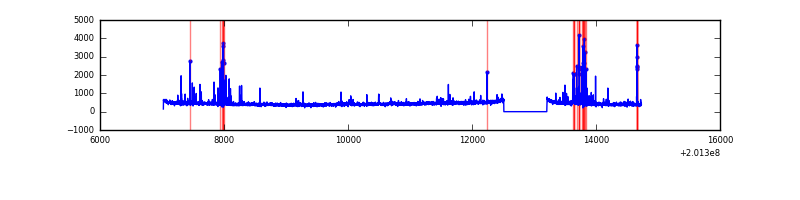 |
| B | 7711 | 7017 | 9 | 9 | 0.12% | 0.13% | 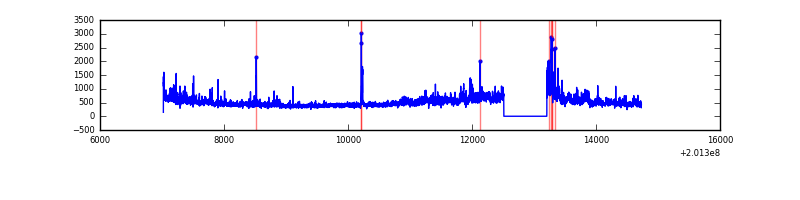 |
| C | 7711 | 7017 | 127 | 127 | 1.65% | 1.81% | 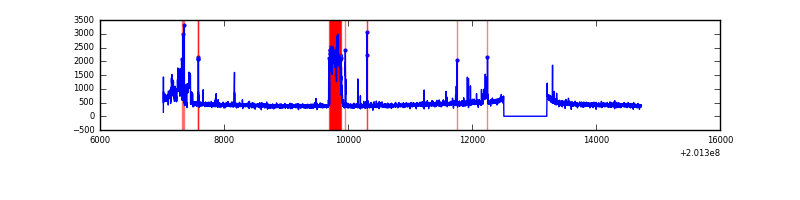 |
| D | 7711 | 7017 | 32 | 32 | 0.41% | 0.46% | 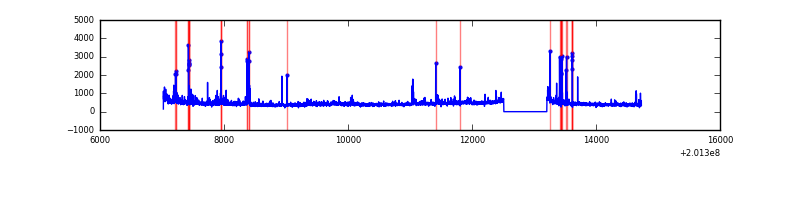 |
Top three noisy pixels from each quadrant. If the there are fewer than three noisy pixels in the level2.evt file, extra rows are filled as -1
| Pixel properties | Quadrant properties | ||||||
|---|---|---|---|---|---|---|---|
| Quadrant | DetID | PixID | Counts | Sigma | Mean | Median | Sigma |
| A | 0 | 118 | 185212 | 1190.35 | 757 | 739 | 155.0 |
| A | 0 | 50 | 65107 | 415.35 | 757 | 739 | 155.0 |
| A | 8 | 15 | 43058 | 273.07 | 757 | 739 | 155.0 |
| B | 15 | 204 | 515168 | 3493.67 | 772 | 753 | 147.2 |
| B | 4 | 81 | 38856 | 258.78 | 772 | 753 | 147.2 |
| B | 0 | 219 | 37947 | 252.6 | 772 | 753 | 147.2 |
| C | 10 | 19 | 344813 | 1997.27 | 750 | 751 | 172.3 |
| C | 14 | 223 | 162121 | 936.75 | 750 | 751 | 172.3 |
| C | 1 | 192 | 115975 | 668.87 | 750 | 751 | 172.3 |
| D | 2 | 37 | 122764 | 688.59 | 740 | 716 | 177.2 |
| D | 5 | 233 | 91573 | 512.61 | 740 | 716 | 177.2 |
| D | 13 | 223 | 79522 | 444.62 | 740 | 716 | 177.2 |
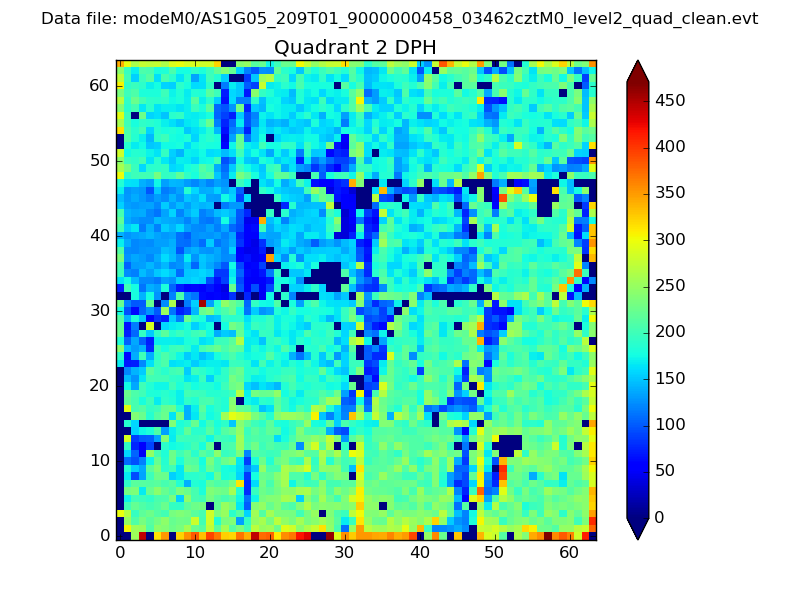
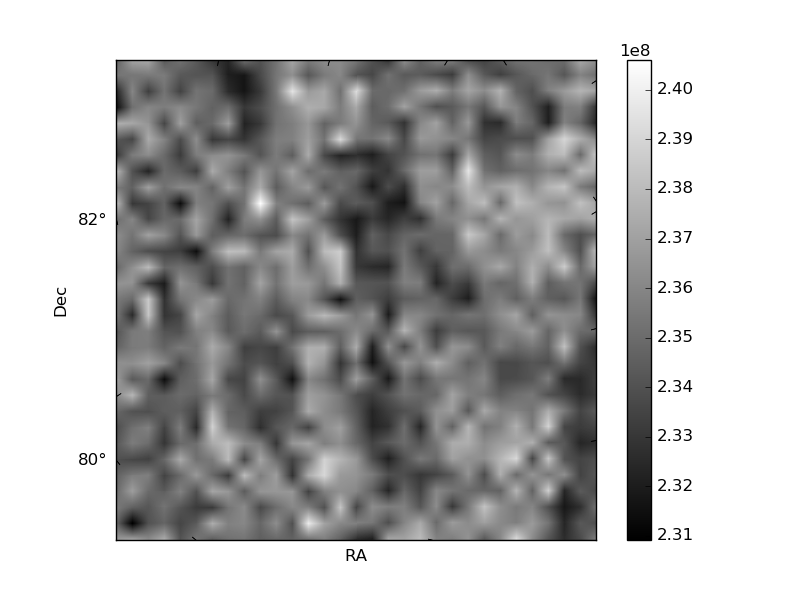
Histogram calculated using DETX and DETY for each event in the final _common_clean file
| Quadrant A |  |
 |
Quadrant B |
|---|---|---|---|
| Quadrant D | 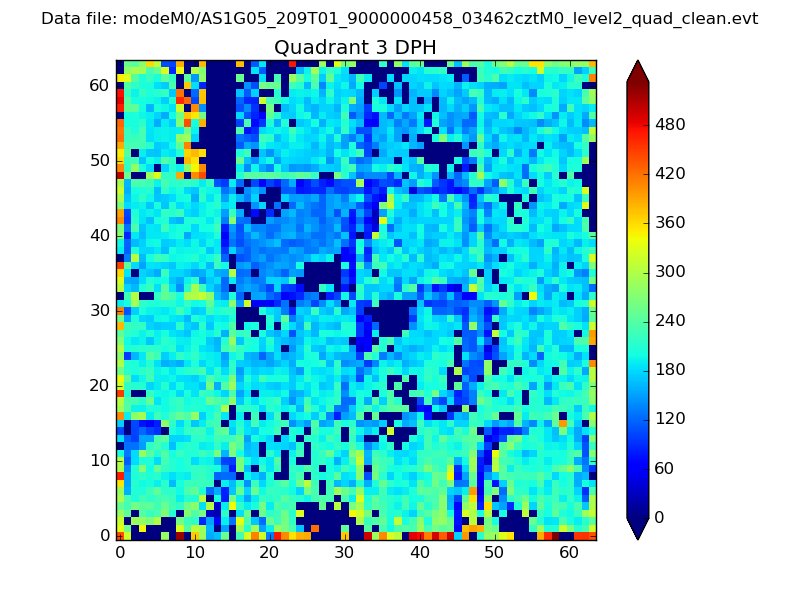 |
 |
Quadrant C |
| Plot type | Count rate plots | Images |
|---|---|---|
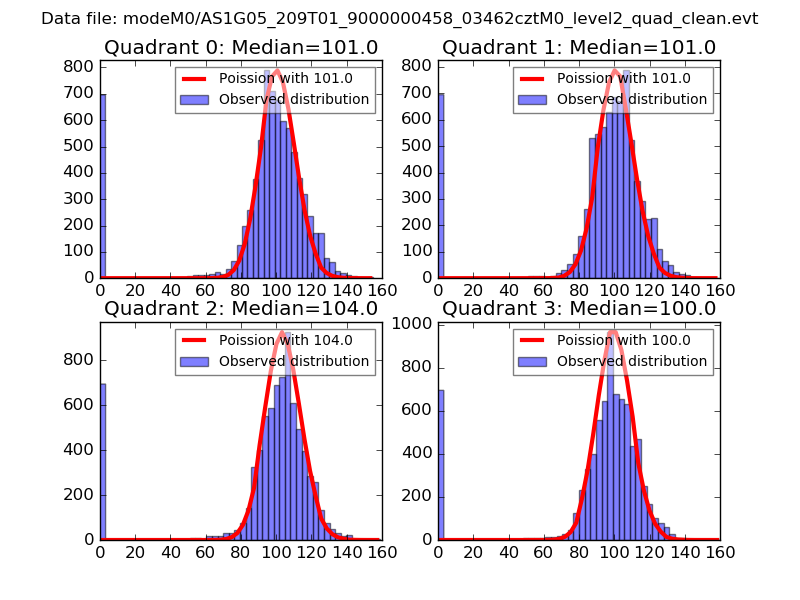
| Comparison with Poisson distribution Blue bars denote a histogram of data divided into 1 sec bins. Red curve is a Poisson curve with rate = median count rate of data. |
 |
 |
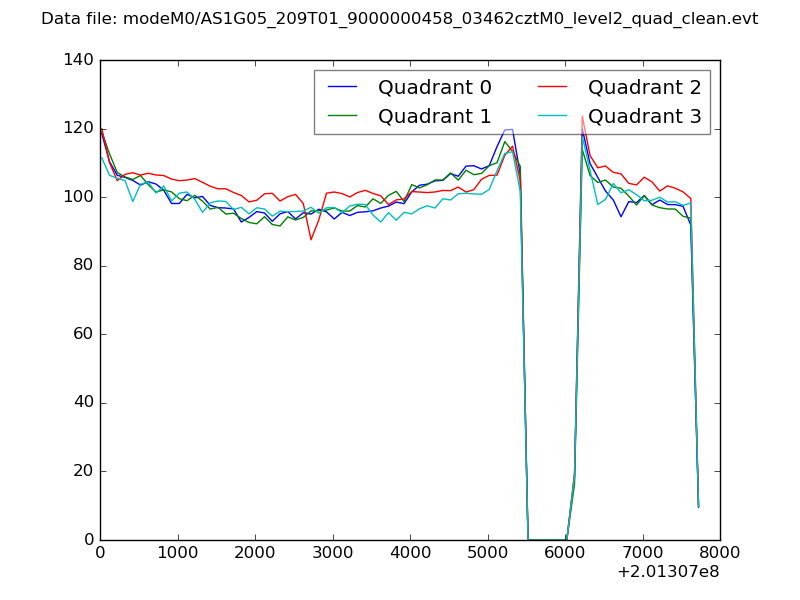
| Quadrant-wise count rates Data is divided into 100 sec bins |
 |
|
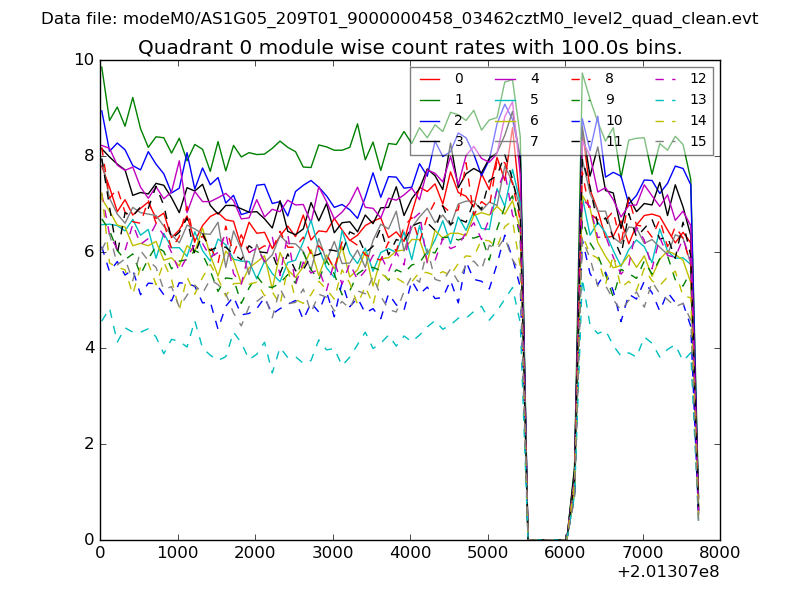
| Module-wise count rates for Quadrant A Data is divided into 100 sec bins |
 |
 |
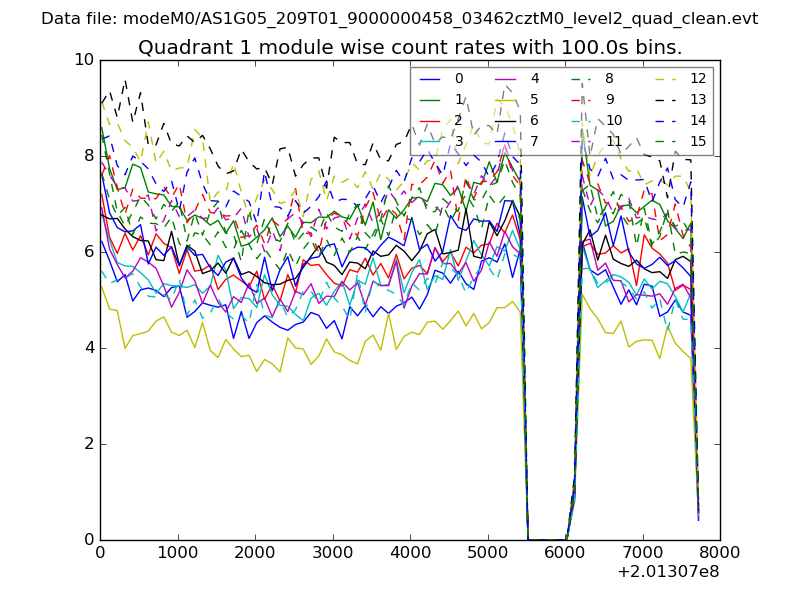
| Module-wise count rates for Quadrant B Data is divided into 100 sec bins |
 |
 |
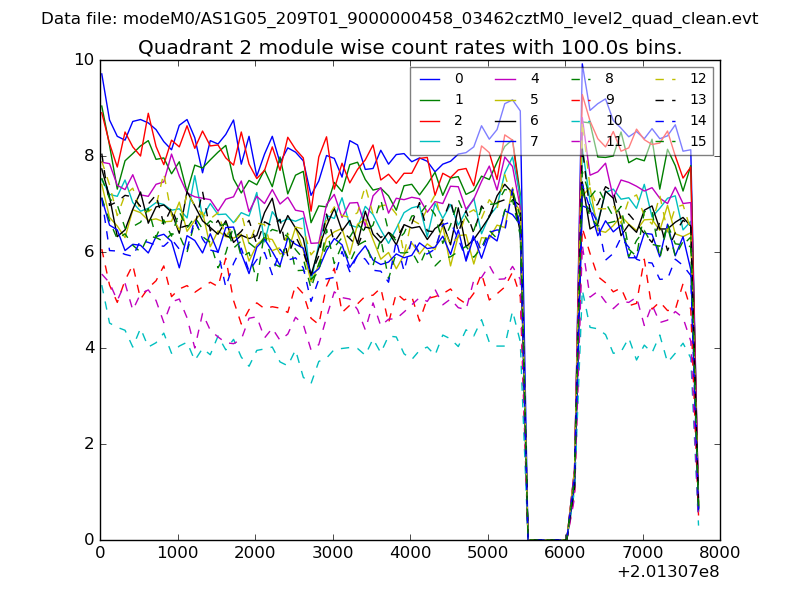
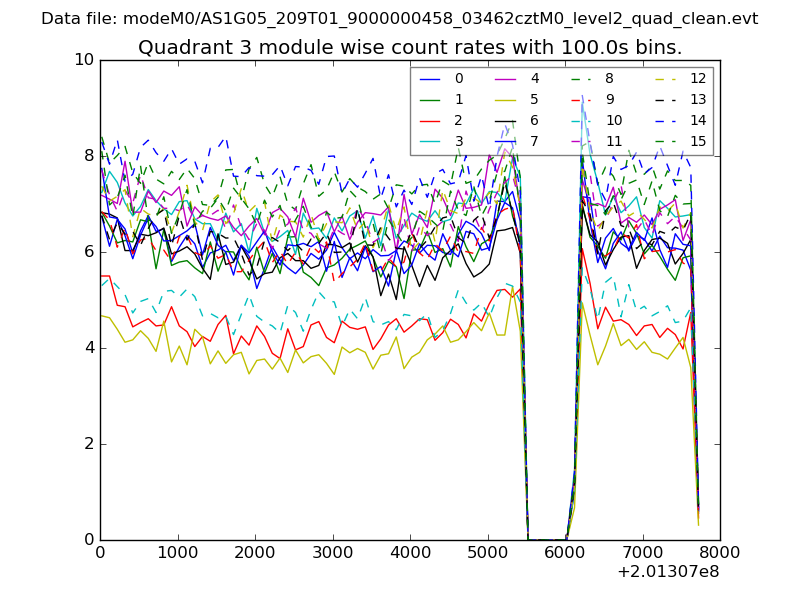
| Module-wise count rates for Quadrant C Data is divided into 100 sec bins |
 |
 |
| Module-wise count rates for Quadrant D Data is divided into 100 sec bins |
 |
 |
| Parameter | Plot |
|---|---|
| CZT HV Monitor | 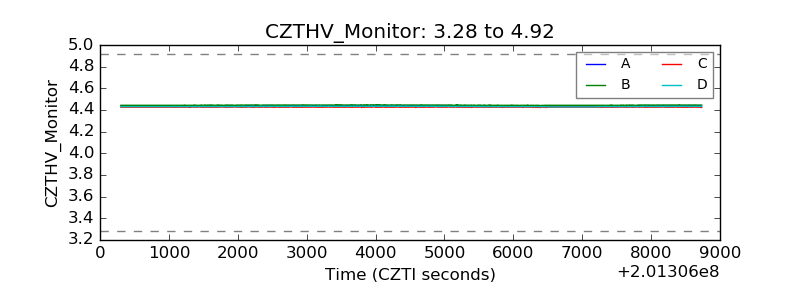 |
| D_VDD | 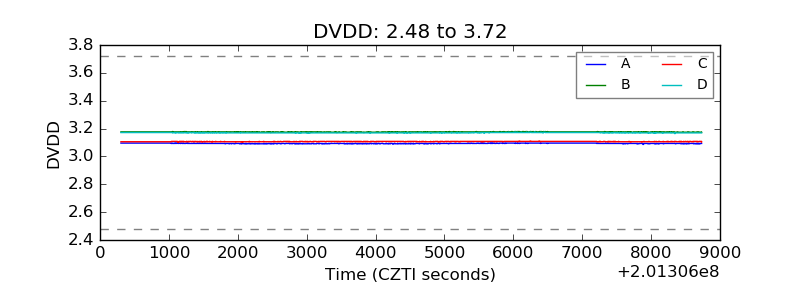 |
| Temperature 1 | 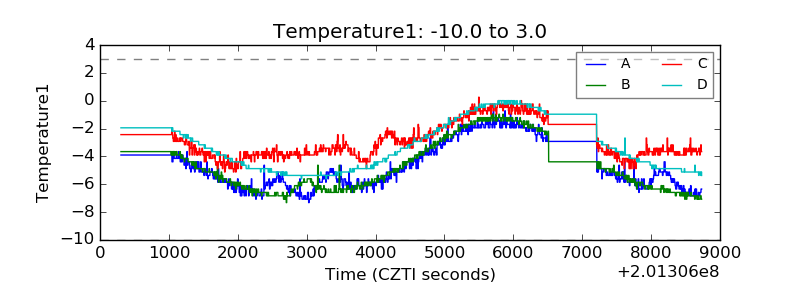 |
| Veto HV Monitor | 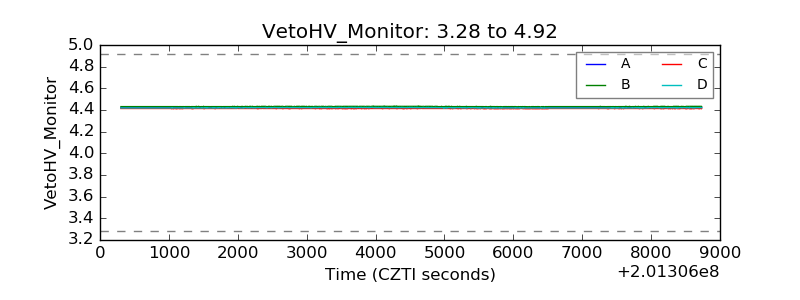 |
| Veto LLD | 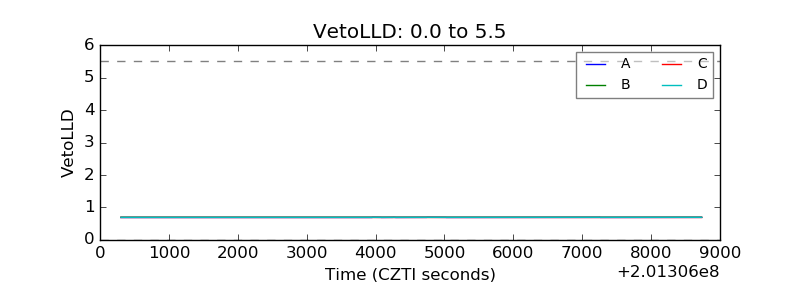 |
| Alpha Counter | 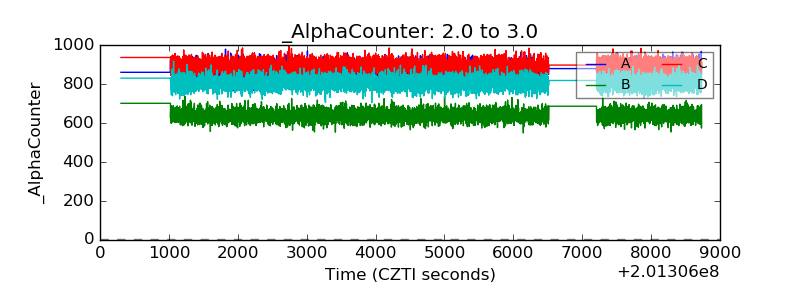 |
| _CPM_Rate | 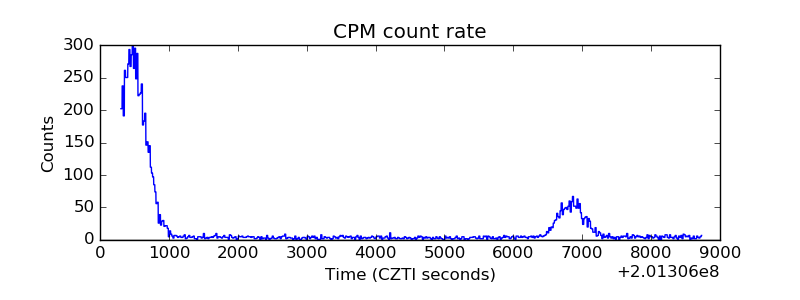 |
| CZT Counter | 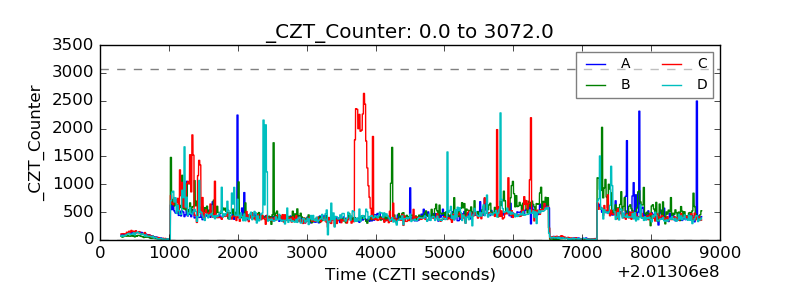 |
| +2.5 Volts monitor |  |
| +5 Volts monitor |  |
| _ROLL_ROT | 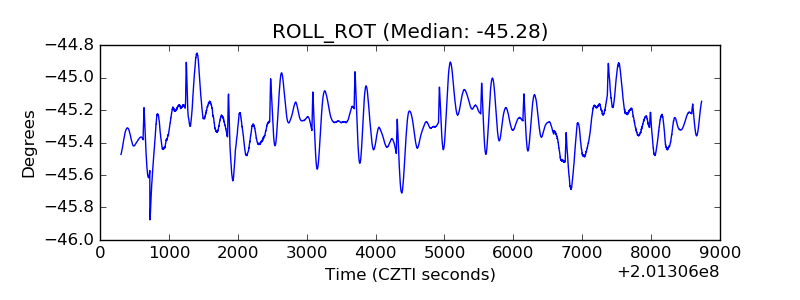 |
| _Roll_DEC | 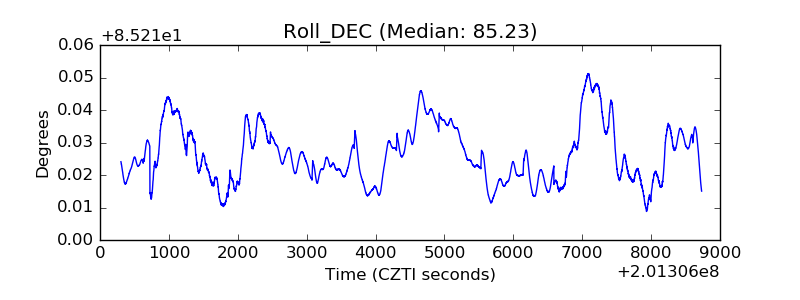 |
| _Roll_RA |  |
| Veto Counter | 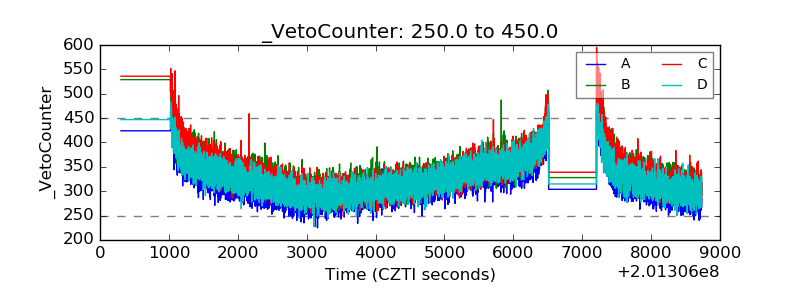 |