| Param | Original file | Final file |
|---|---|---|
| Filename | modeM0/AS1G05_209T01_9000000458_03463cztM0_level2.evt | modeM0/AS1G05_209T01_9000000458_03463cztM0_level2_quad_clean.evt |
| Size (bytes) | 533,805,120 | 127,339,200 |
| Size | 509.1 MB | 121.4 MB |
| Events in quadrant A | 3,777,294 | 819,840 |
| Events in quadrant B | 4,675,246 | 818,976 |
| Events in quadrant C | 3,589,830 | 841,807 |
| Events in quadrant D | 3,571,806 | 811,195 |
| Mode M9 | |||
|---|---|---|---|
| Quadrant | BADHDUFLAG | Total packets | Discarded packets |
| A | 0 | 8 | 0 |
| B | 0 | 8 | 0 |
| C | 0 | 8 | 0 |
| D | 0 | 8 | 0 |
| Mode SS | |||
|---|---|---|---|
| Quadrant | BADHDUFLAG | Total packets | Discarded packets |
| A | 0 | 166 | 0 |
| B | 0 | 166 | 0 |
| C | 0 | 166 | 0 |
| D | 0 | 166 | 0 |
| Mode M0 | |||
|---|---|---|---|
| Quadrant | BADHDUFLAG | Total packets | Discarded packets |
| A | 0 | 17371 | 4 |
| B | 0 | 19607 | 3 |
| C | 0 | 16879 | 3 |
| D | 0 | 17134 | 3 |
| Quadrant | Total seconds | Saturated seconds | Saturation percentage |
|---|---|---|---|
| A | 8130 | 101 | 1.242312% |
| B | 8130 | 147 | 1.808118% |
| C | 8130 | 39 | 0.479705% |
| D | 8130 | 44 | 0.541205% |
Noise dominated data is calculated using 1-second bins in cleaned event files. If a bin has >2000 counts, and if more than 50% of those come from <1% of pixels, then it is considered to be noise-dominated and hence unusable.
| Quadrant | # 1 sec bins | Bins with >0 counts | Bins with >2000 counts | High rate bins dominated by noise | Noise dominated (total time) | Noise dominated (detector-on time) | Marked lightcurve |
|---|---|---|---|---|---|---|---|
| A | 8930 | 8133 | 41 | 41 | 0.46% | 0.50% | 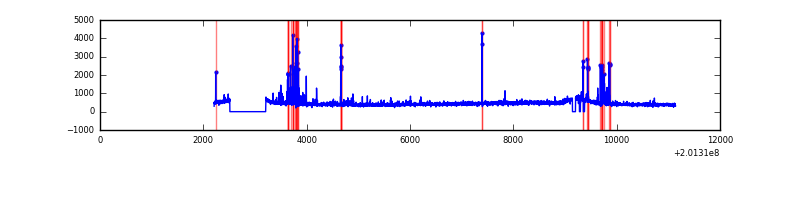 |
| B | 8930 | 8134 | 15 | 15 | 0.17% | 0.18% | 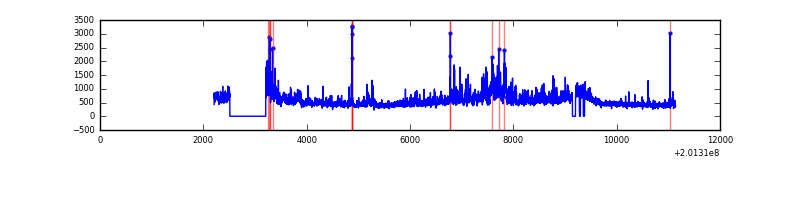 |
| C | 8930 | 8134 | 1 | 1 | 0.01% | 0.01% | 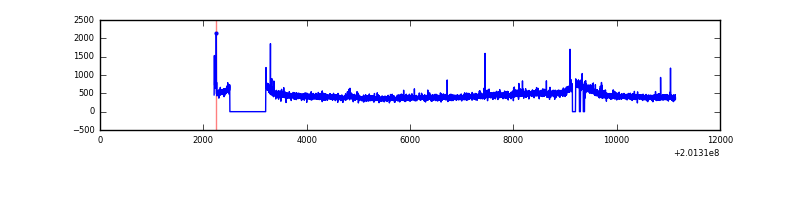 |
| D | 8930 | 8134 | 22 | 22 | 0.25% | 0.27% | 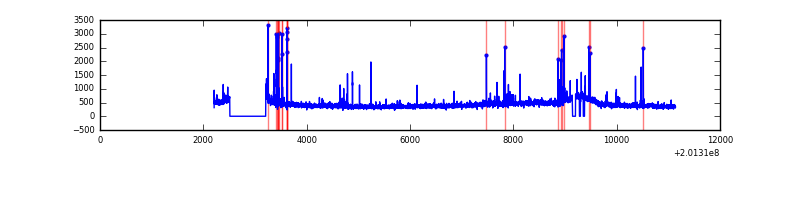 |
Top three noisy pixels from each quadrant. If the there are fewer than three noisy pixels in the level2.evt file, extra rows are filled as -1
| Pixel properties | Quadrant properties | ||||||
|---|---|---|---|---|---|---|---|
| Quadrant | DetID | PixID | Counts | Sigma | Mean | Median | Sigma |
| A | 0 | 118 | 170644 | 913.83 | 902 | 877 | 185.8 |
| A | 0 | 50 | 40842 | 215.13 | 902 | 877 | 185.8 |
| A | 8 | 15 | 39162 | 206.08 | 902 | 877 | 185.8 |
| B | 15 | 204 | 944680 | 5386.52 | 919 | 895 | 175.2 |
| B | 4 | 81 | 45742 | 255.96 | 919 | 895 | 175.2 |
| B | 0 | 219 | 20441 | 111.56 | 919 | 895 | 175.2 |
| C | 1 | 192 | 50439 | 240.33 | 892 | 896 | 206.1 |
| C | 14 | 223 | 10102 | 44.66 | 892 | 896 | 206.1 |
| C | 9 | 144 | 7832 | 33.65 | 892 | 896 | 206.1 |
| D | 5 | 233 | 81769 | 379.03 | 882 | 855 | 213.5 |
| D | 13 | 223 | 47742 | 219.63 | 882 | 855 | 213.5 |
| D | 2 | 37 | 42820 | 196.58 | 882 | 855 | 213.5 |
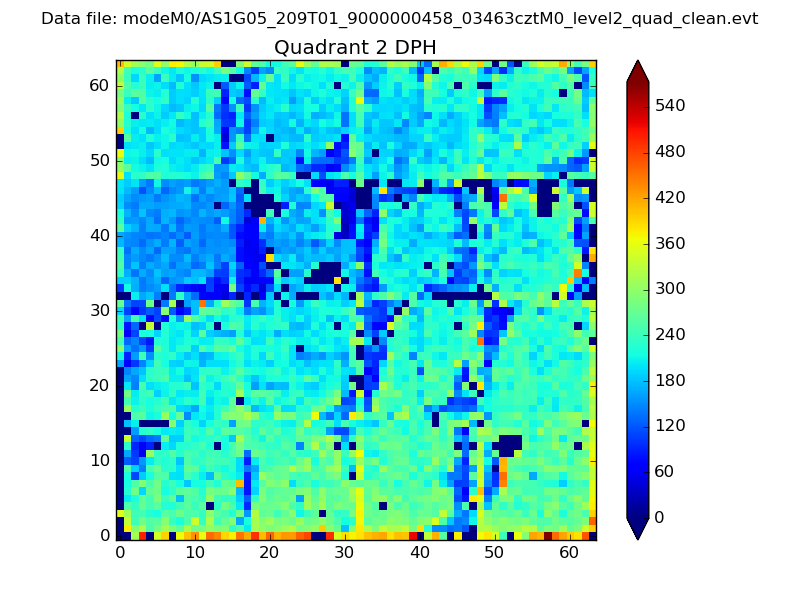
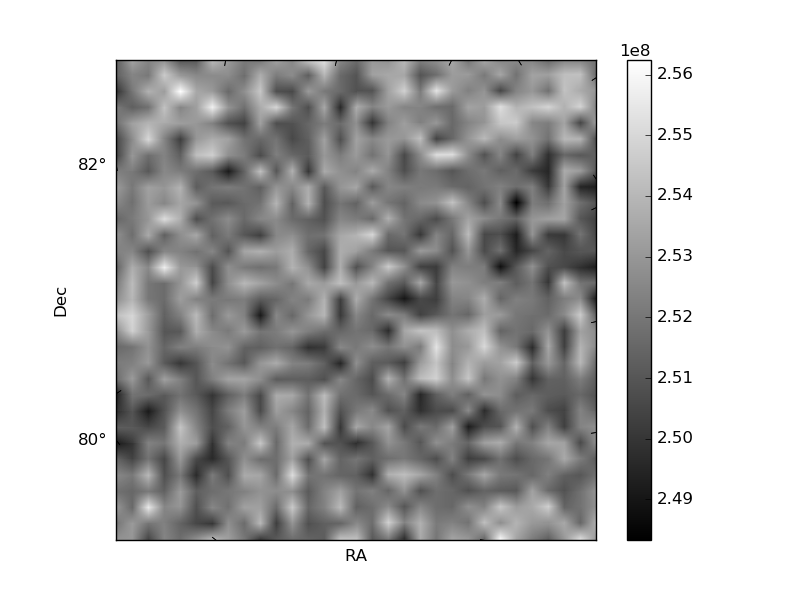
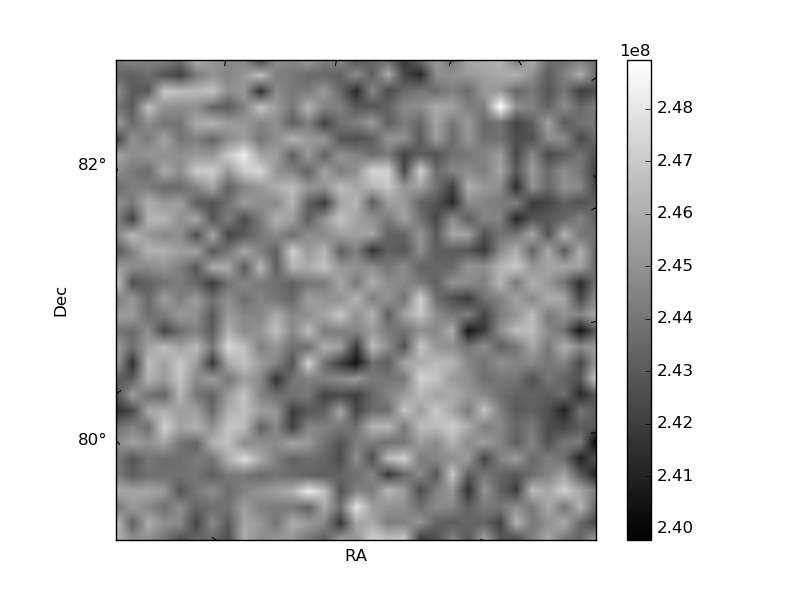
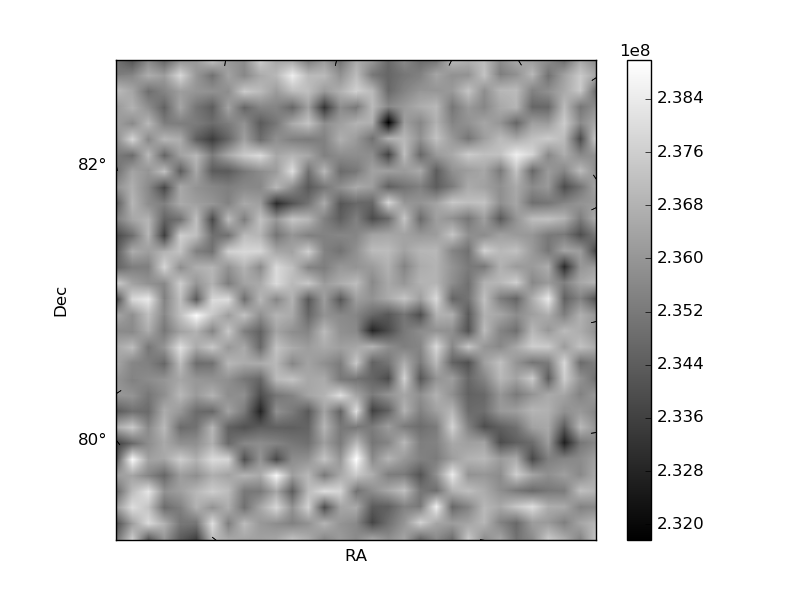
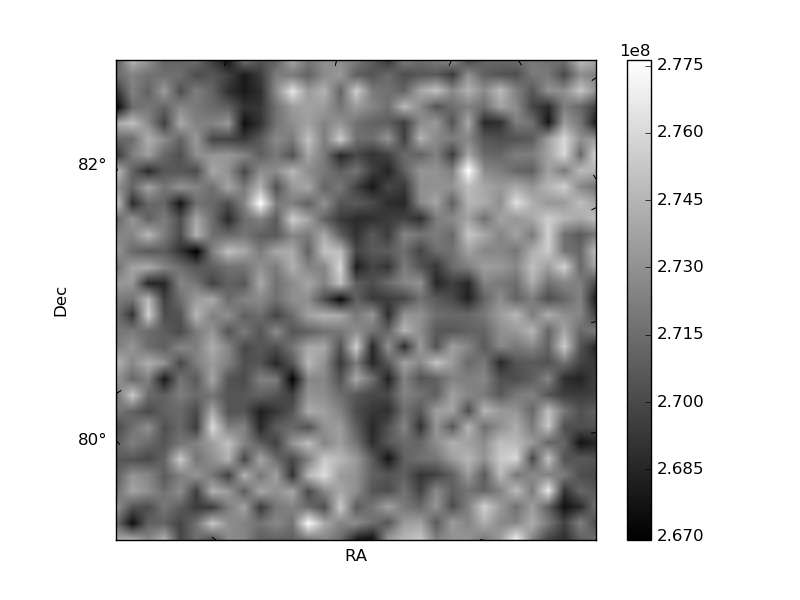
Histogram calculated using DETX and DETY for each event in the final _common_clean file
| Quadrant A | 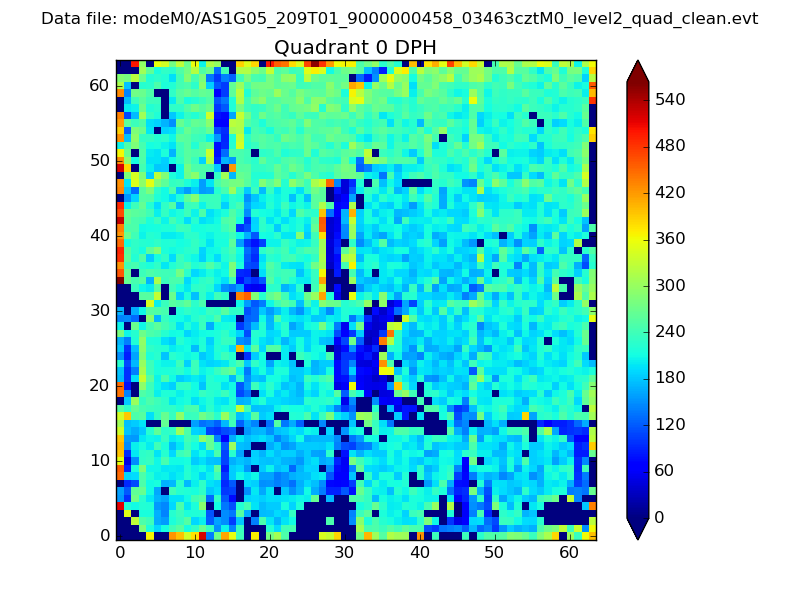 |
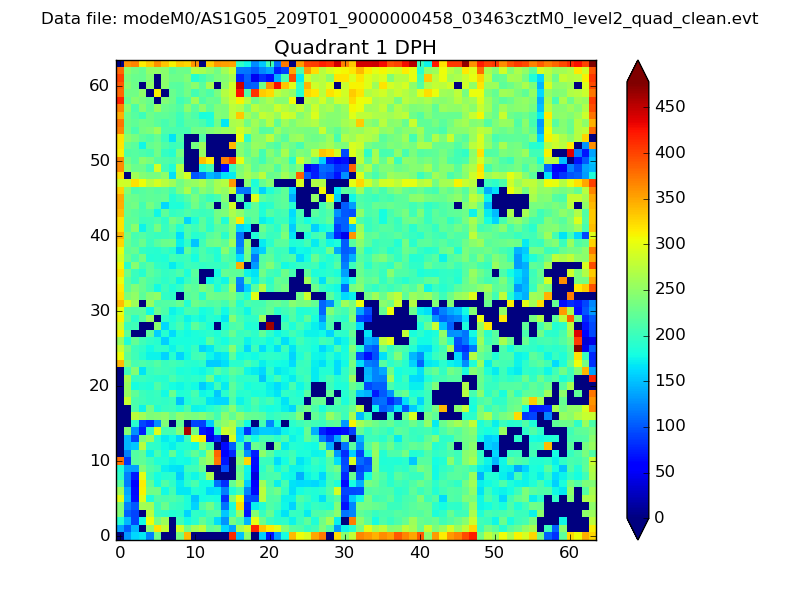 |
Quadrant B |
|---|---|---|---|
| Quadrant D | 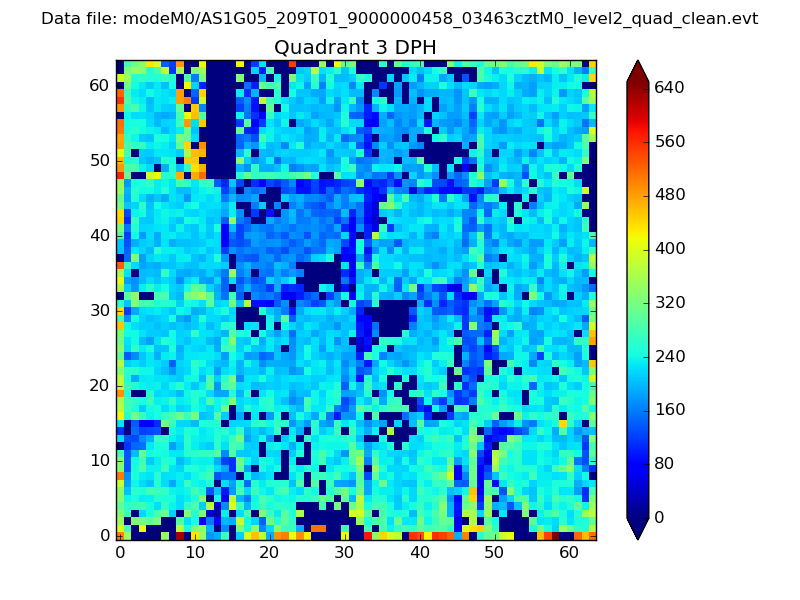 |
 |
Quadrant C |
| Plot type | Count rate plots | Images |
|---|---|---|
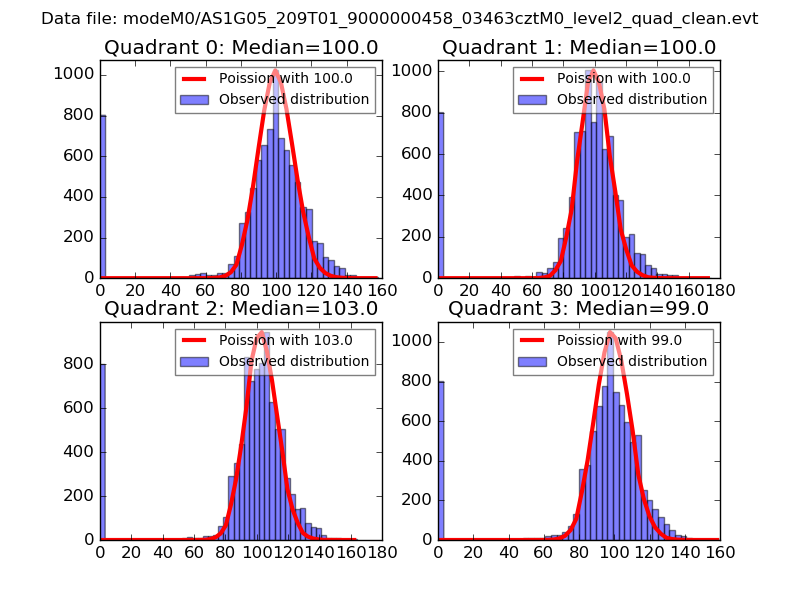
| Comparison with Poisson distribution Blue bars denote a histogram of data divided into 1 sec bins. Red curve is a Poisson curve with rate = median count rate of data. |
 |
 |
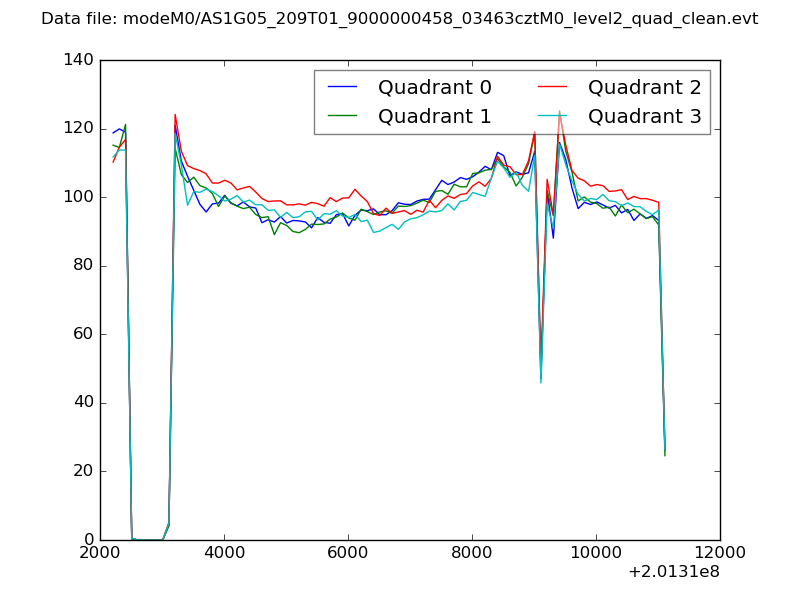
| Quadrant-wise count rates Data is divided into 100 sec bins |
 |
|
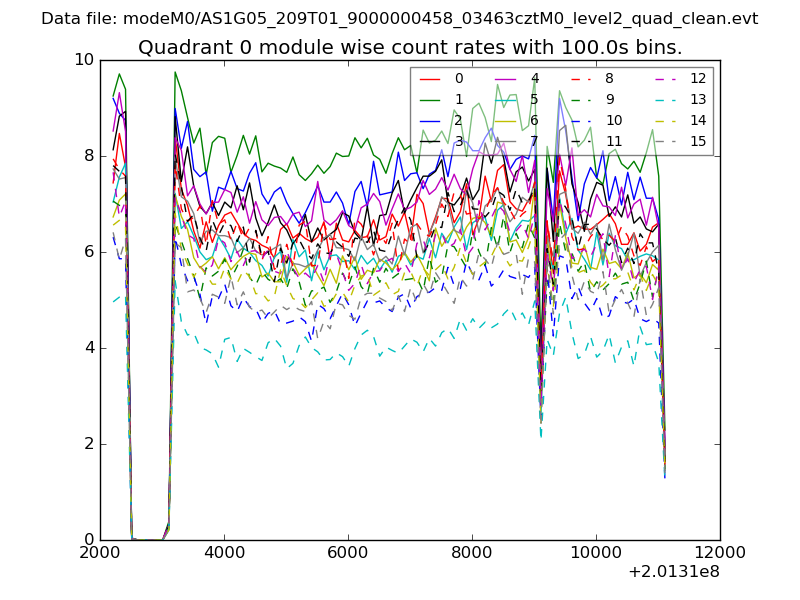
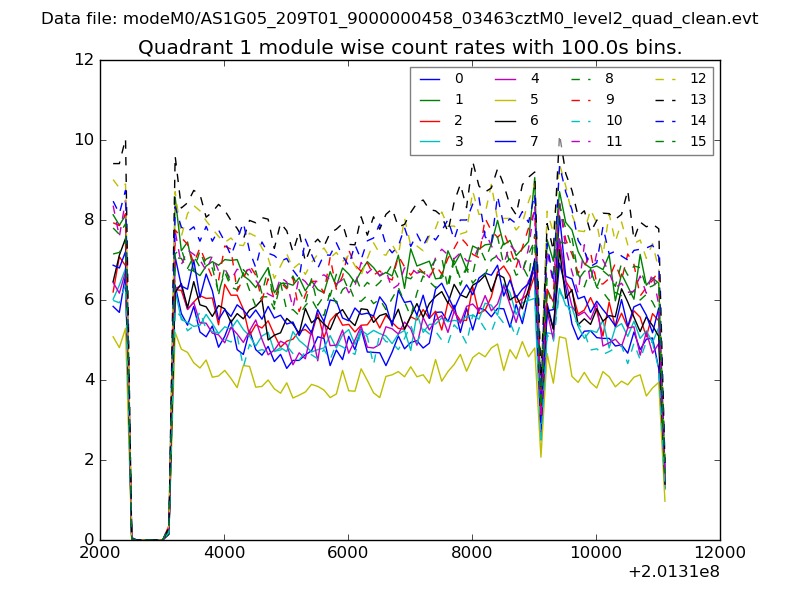
| Module-wise count rates for Quadrant A Data is divided into 100 sec bins |
 |
 |
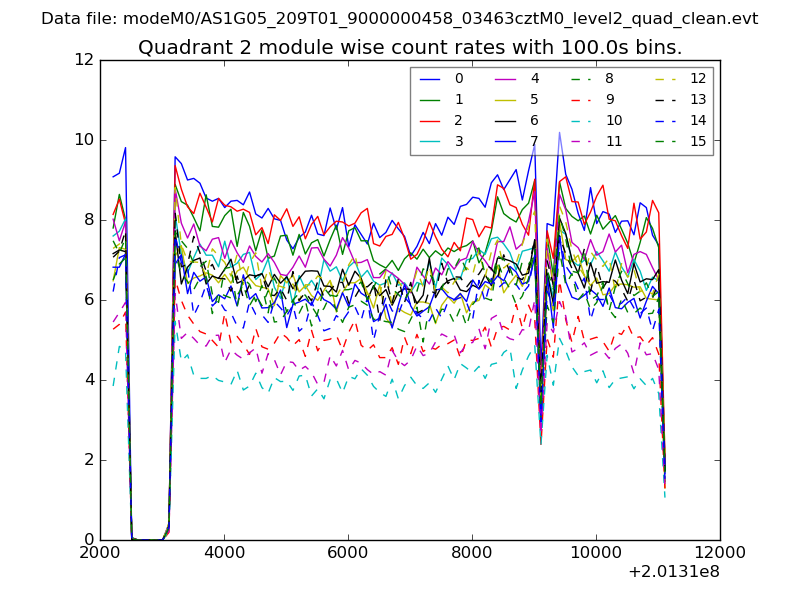
| Module-wise count rates for Quadrant B Data is divided into 100 sec bins |
 |
 |
| Module-wise count rates for Quadrant C Data is divided into 100 sec bins |
 |
 |
| Module-wise count rates for Quadrant D Data is divided into 100 sec bins |
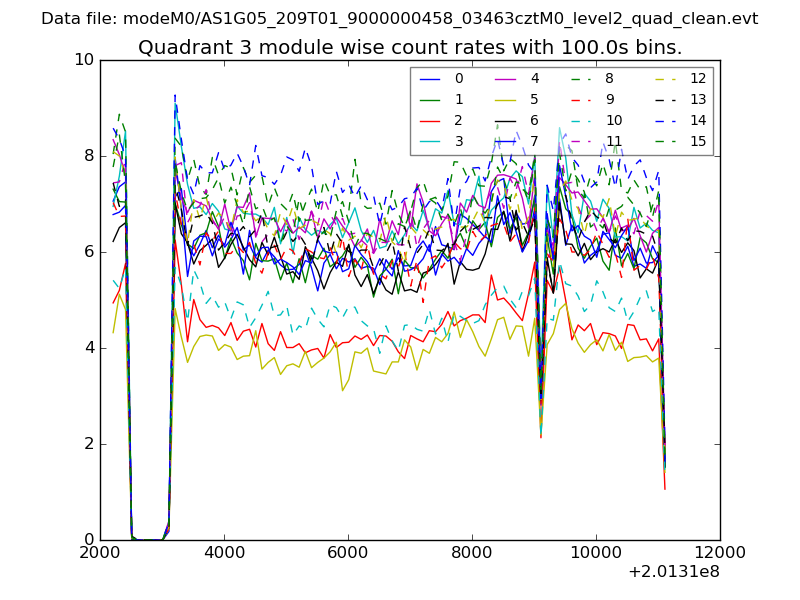 |
 |
| Parameter | Plot |
|---|---|
| CZT HV Monitor | 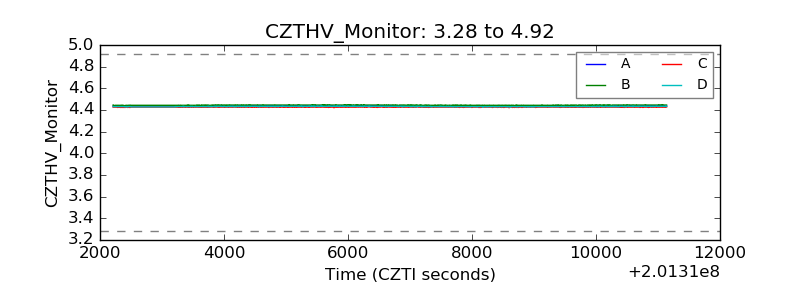 |
| D_VDD | 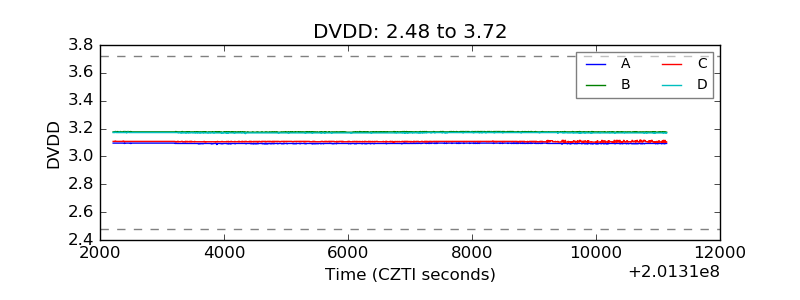 |
| Temperature 1 | 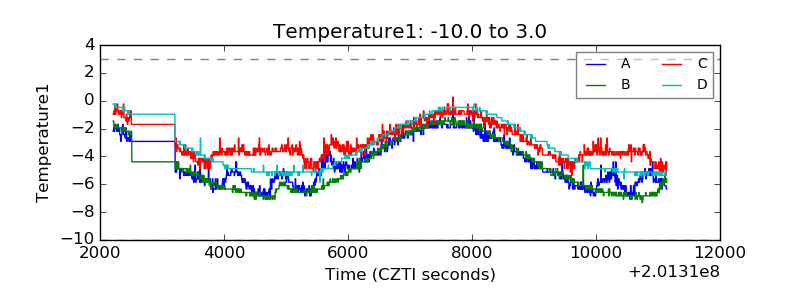 |
| Veto HV Monitor | 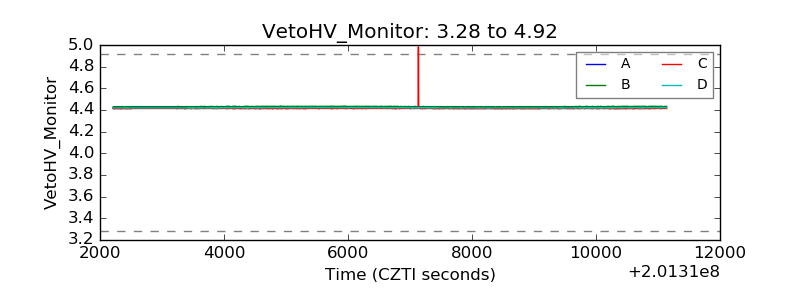 |
| Veto LLD | 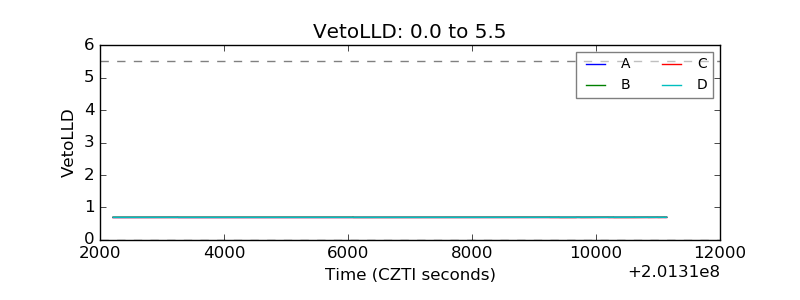 |
| Alpha Counter | 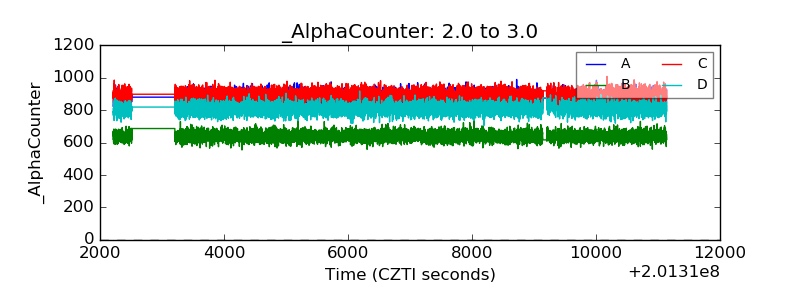 |
| _CPM_Rate | 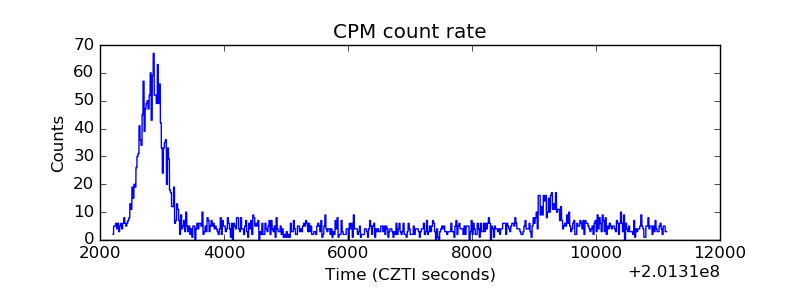 |
| CZT Counter | 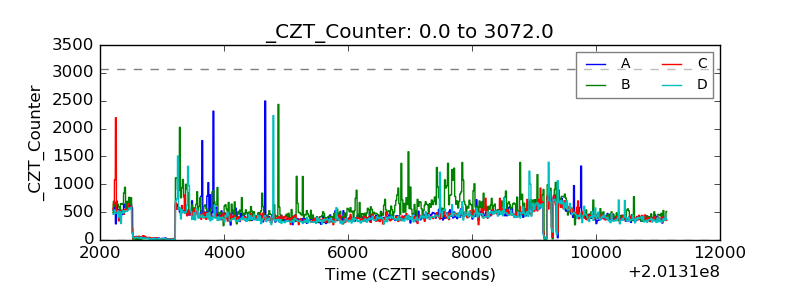 |
| +2.5 Volts monitor |  |
| +5 Volts monitor |  |
| _ROLL_ROT | 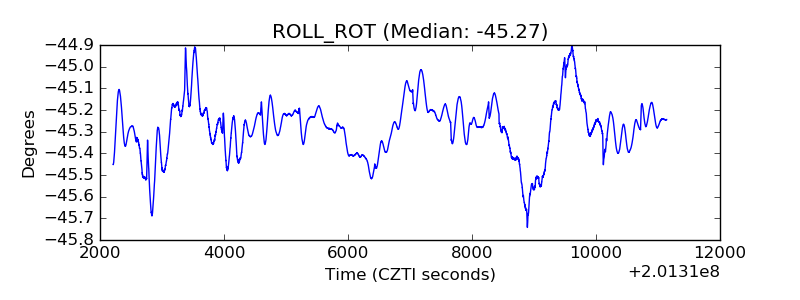 |
| _Roll_DEC | 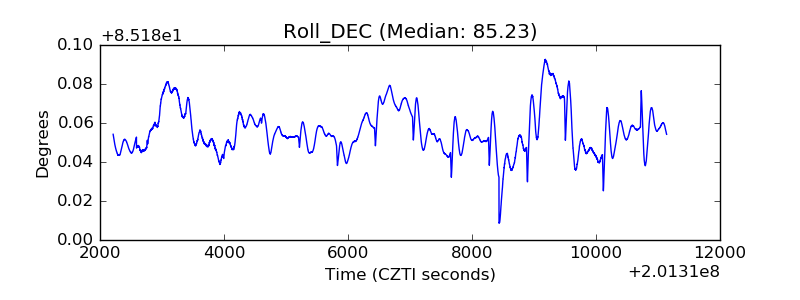 |
| _Roll_RA | 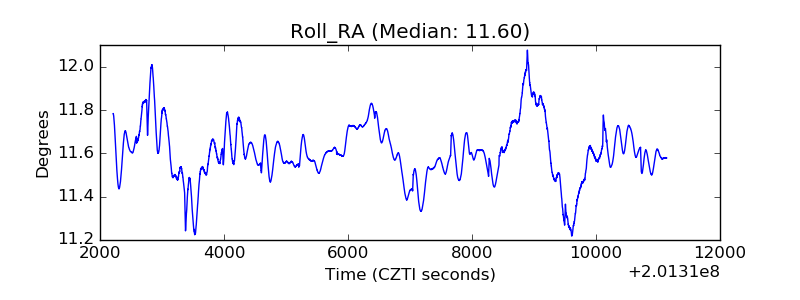 |
| Veto Counter | 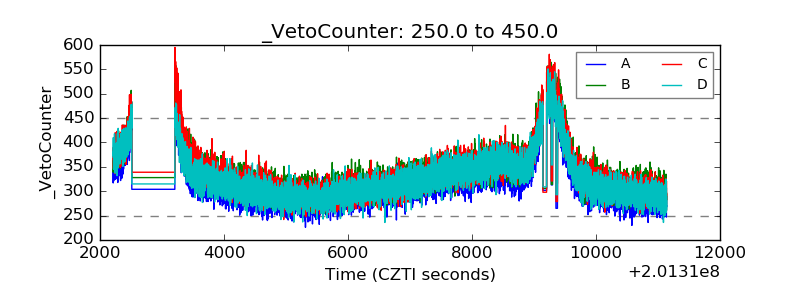 |