| Param | Original file | Final file |
|---|---|---|
| Filename | modeM0/AS1G05_209T01_9000000458_03464cztM0_level2.evt | modeM0/AS1G05_209T01_9000000458_03464cztM0_level2_quad_clean.evt |
| Size (bytes) | 507,461,760 | 117,342,720 |
| Size | 484.0 MB | 111.9 MB |
| Events in quadrant A | 4,457,910 | 735,494 |
| Events in quadrant B | 3,775,018 | 760,253 |
| Events in quadrant C | 3,354,855 | 776,631 |
| Events in quadrant D | 3,260,330 | 748,718 |
| Mode SS | |||
|---|---|---|---|
| Quadrant | BADHDUFLAG | Total packets | Discarded packets |
| A | 0 | 152 | 0 |
| B | 0 | 152 | 0 |
| C | 0 | 152 | 0 |
| D | 0 | 152 | 0 |
| Mode M0 | |||
|---|---|---|---|
| Quadrant | BADHDUFLAG | Total packets | Discarded packets |
| A | 0 | 19070 | 1 |
| B | 0 | 16648 | 0 |
| C | 0 | 15759 | 0 |
| D | 0 | 15922 | 0 |
| Quadrant | Total seconds | Saturated seconds | Saturation percentage |
|---|---|---|---|
| A | 7662 | 418 | 5.455495% |
| B | 7662 | 48 | 0.626468% |
| C | 7662 | 7 | 0.091360% |
| D | 7662 | 17 | 0.221874% |
Noise dominated data is calculated using 1-second bins in cleaned event files. If a bin has >2000 counts, and if more than 50% of those come from <1% of pixels, then it is considered to be noise-dominated and hence unusable.
| Quadrant | # 1 sec bins | Bins with >0 counts | Bins with >2000 counts | High rate bins dominated by noise | Noise dominated (total time) | Noise dominated (detector-on time) | Marked lightcurve |
|---|---|---|---|---|---|---|---|
| A | 7662 | 7662 | 212 | 212 | 2.77% | 2.77% | 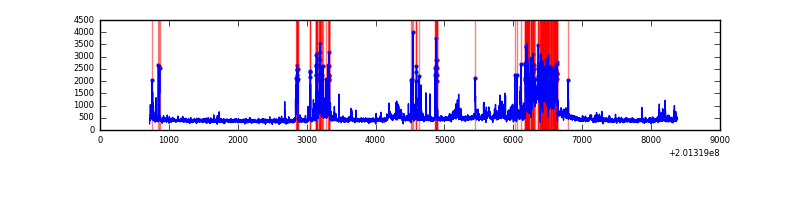 |
| B | 7662 | 7662 | 3 | 3 | 0.04% | 0.04% | 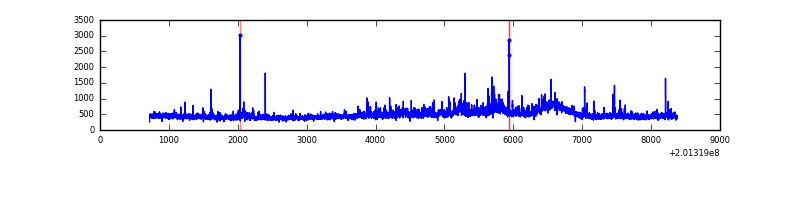 |
| C | 7662 | 7662 | 0 | 0 | 0.00% | 0.00% | 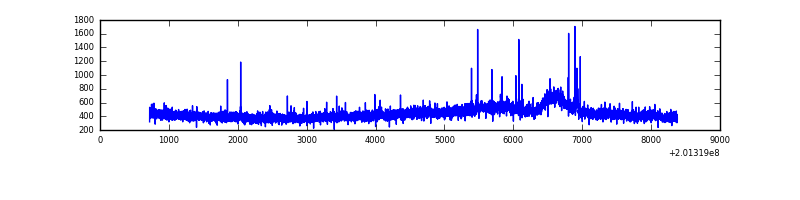 |
| D | 7662 | 7662 | 17 | 17 | 0.22% | 0.22% | 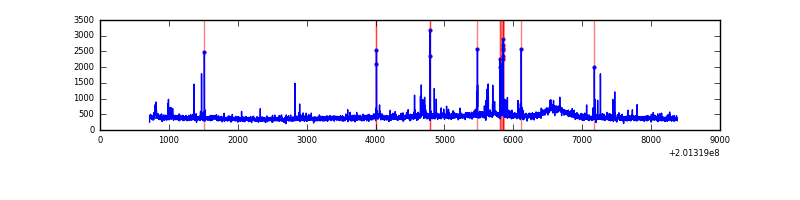 |
Top three noisy pixels from each quadrant. If the there are fewer than three noisy pixels in the level2.evt file, extra rows are filled as -1
| Pixel properties | Quadrant properties | ||||||
|---|---|---|---|---|---|---|---|
| Quadrant | DetID | PixID | Counts | Sigma | Mean | Median | Sigma |
| A | 14 | 249 | 523548 | 3128.48 | 814 | 794 | 167.1 |
| A | 8 | 15 | 288847 | 1723.88 | 814 | 794 | 167.1 |
| A | 0 | 50 | 249685 | 1489.51 | 814 | 794 | 167.1 |
| B | 15 | 204 | 298607 | 1810.85 | 852 | 831 | 164.4 |
| B | 14 | 167 | 79619 | 479.13 | 852 | 831 | 164.4 |
| B | 0 | 229 | 33646 | 199.56 | 852 | 831 | 164.4 |
| C | 9 | 144 | 46894 | 242.9 | 820 | 822 | 189.7 |
| C | 1 | 192 | 30419 | 156.04 | 820 | 822 | 189.7 |
| C | 14 | 223 | 28696 | 146.96 | 820 | 822 | 189.7 |
| D | 5 | 233 | 55622 | 277.85 | 812 | 787 | 197.4 |
| D | 7 | 39 | 29056 | 143.24 | 812 | 787 | 197.4 |
| D | 10 | 34 | 24249 | 118.88 | 812 | 787 | 197.4 |
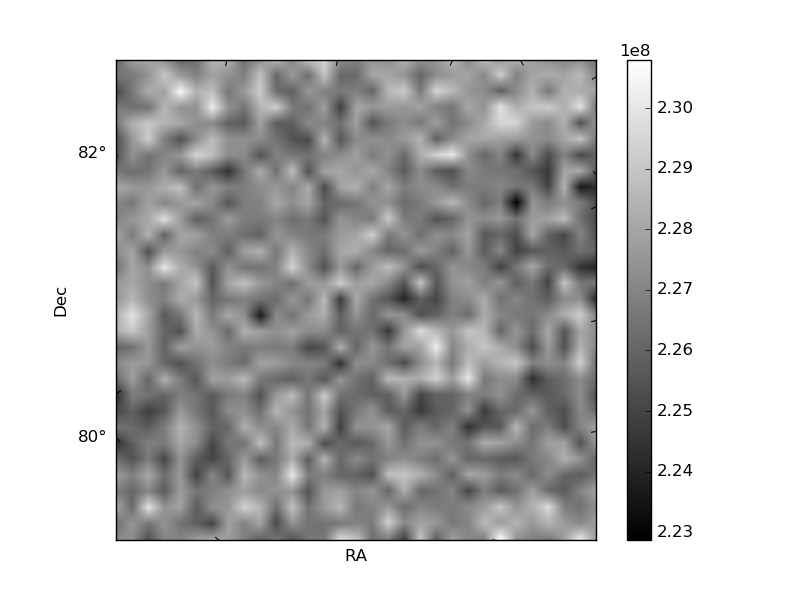
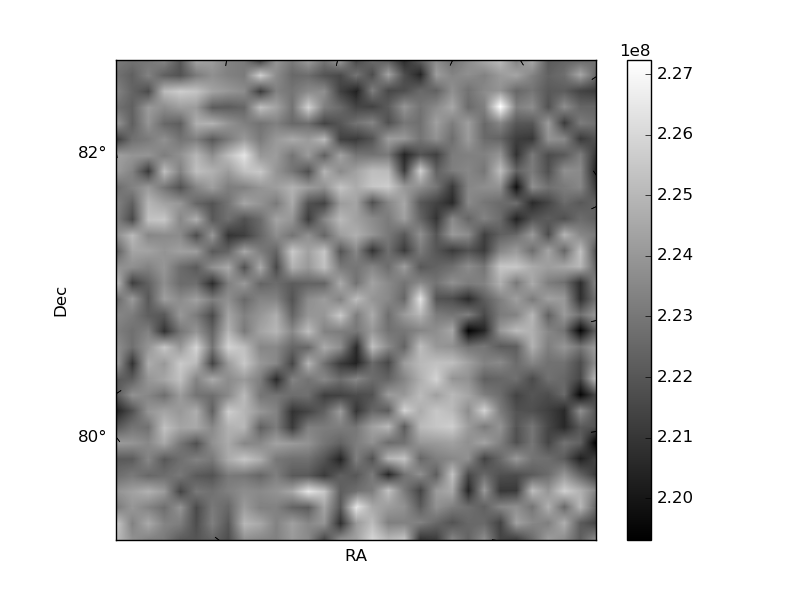
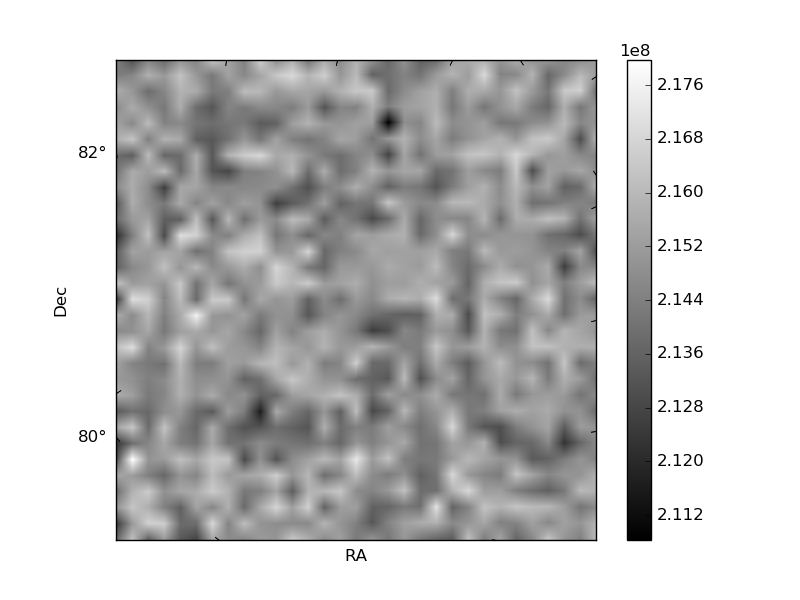
Histogram calculated using DETX and DETY for each event in the final _common_clean file
| Quadrant A | 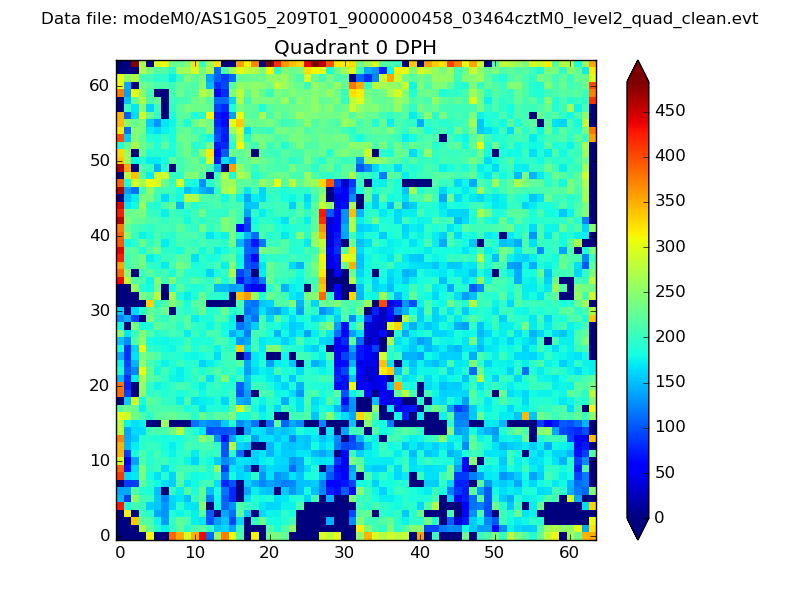 |
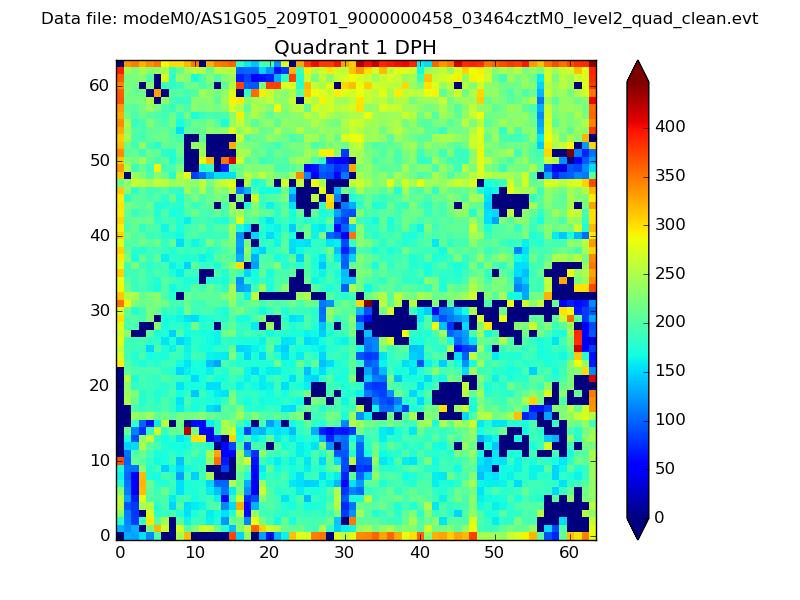 |
Quadrant B |
|---|---|---|---|
| Quadrant D | 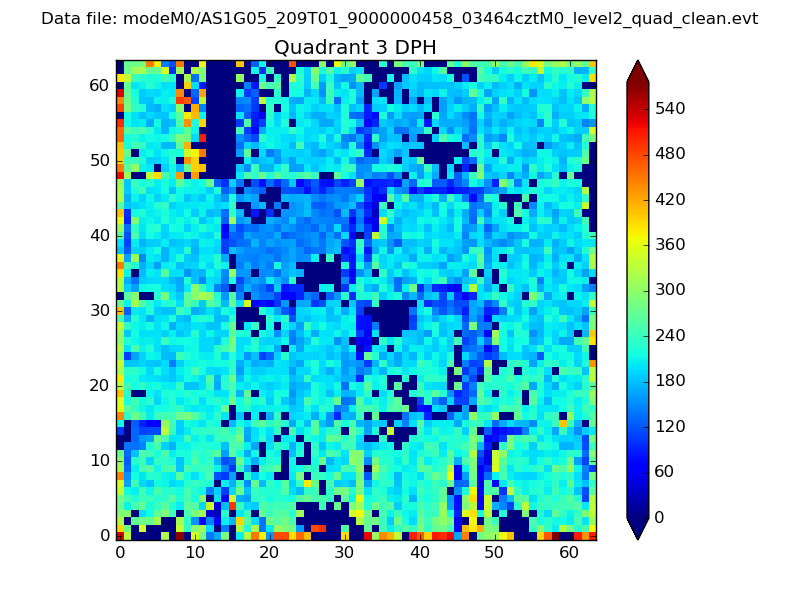 |
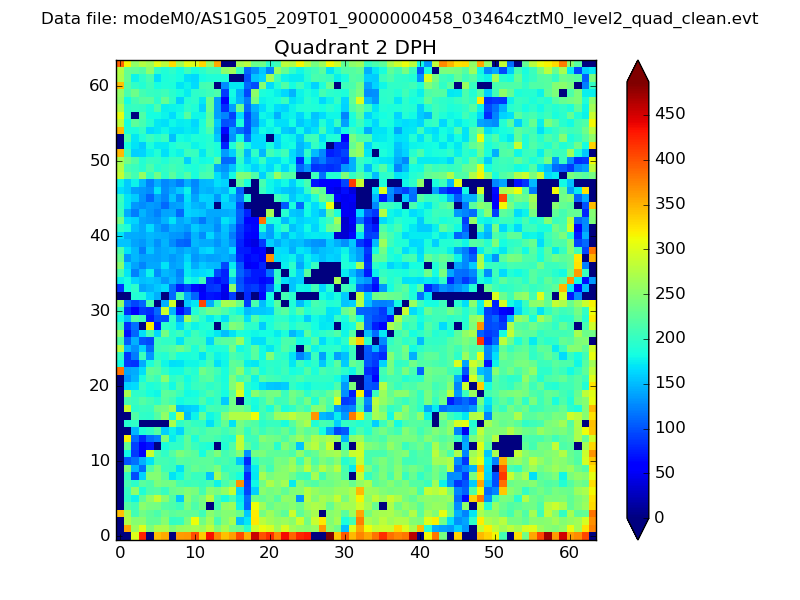 |
Quadrant C |
| Plot type | Count rate plots | Images |
|---|---|---|
| Comparison with Poisson distribution Blue bars denote a histogram of data divided into 1 sec bins. Red curve is a Poisson curve with rate = median count rate of data. |
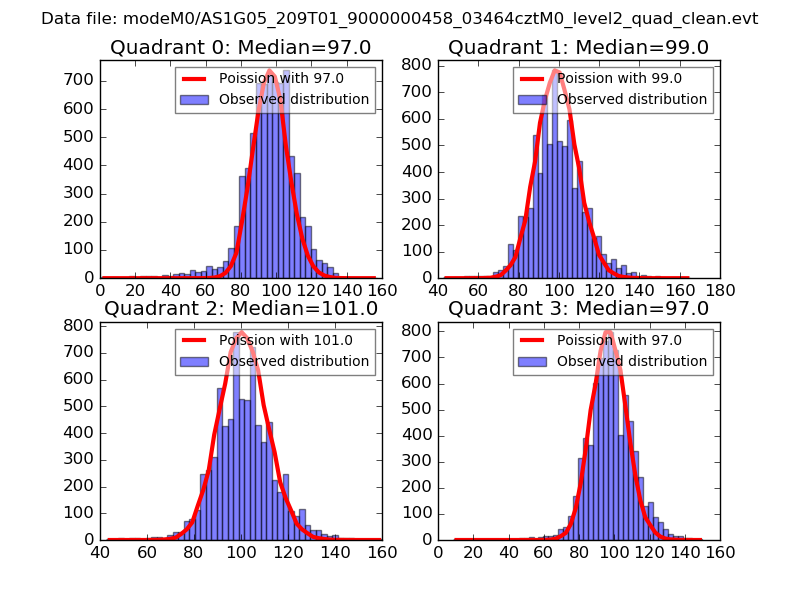 |
 |
| Quadrant-wise count rates Data is divided into 100 sec bins |
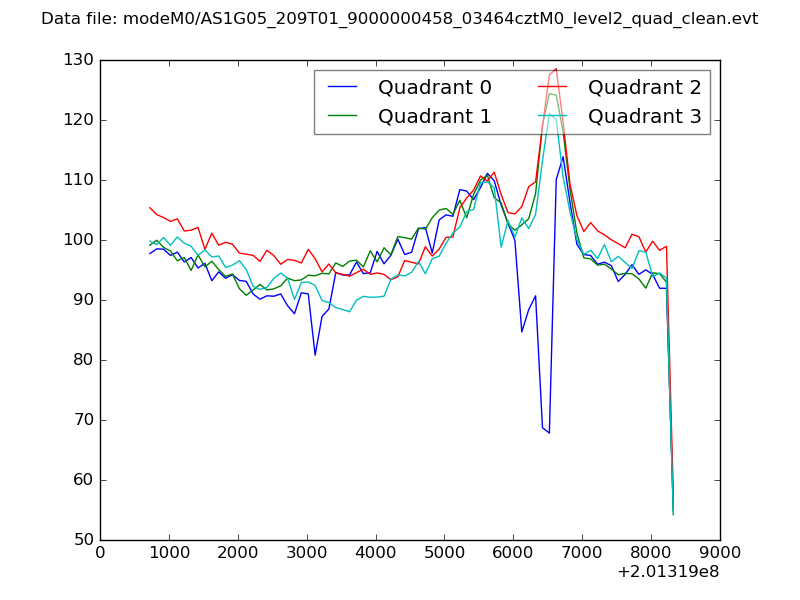 |
|
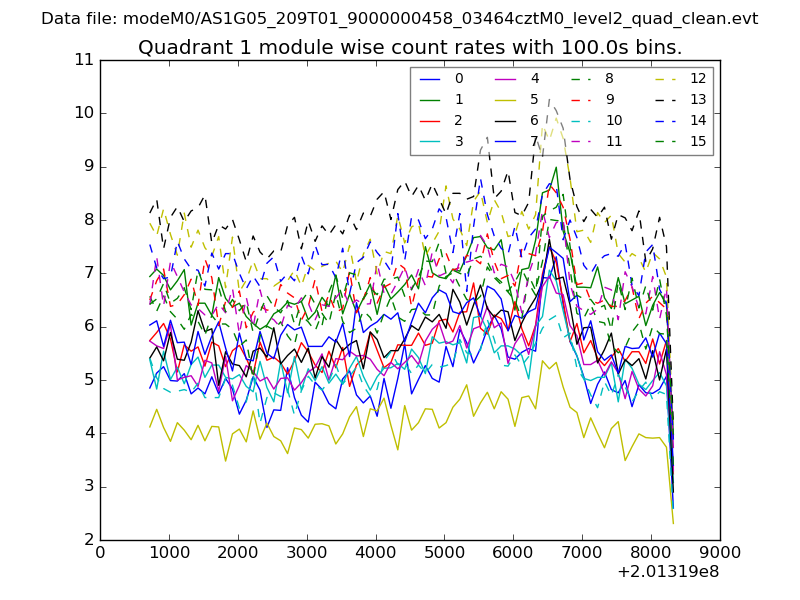
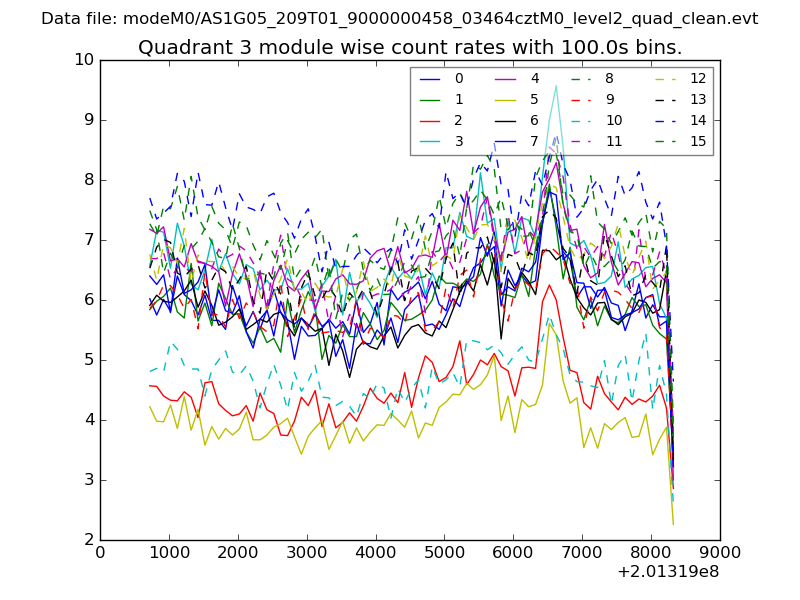
| Module-wise count rates for Quadrant A Data is divided into 100 sec bins |
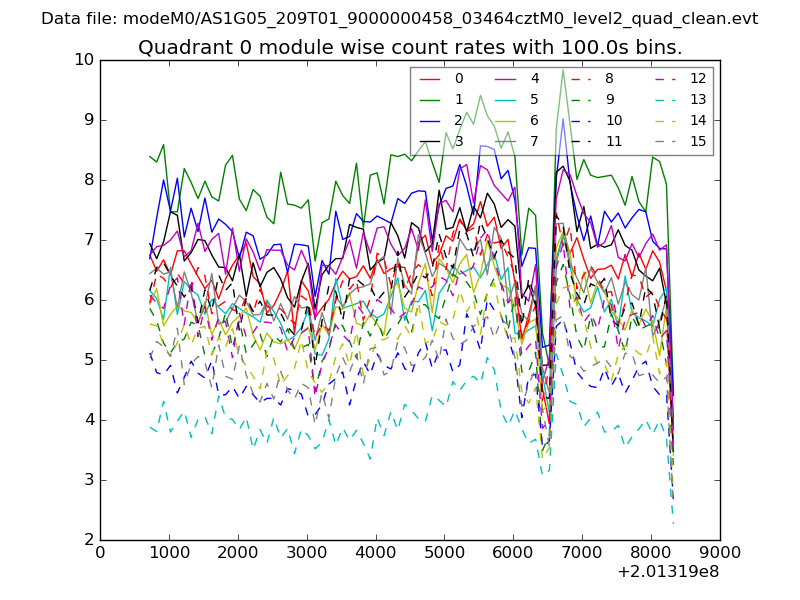 |
 |
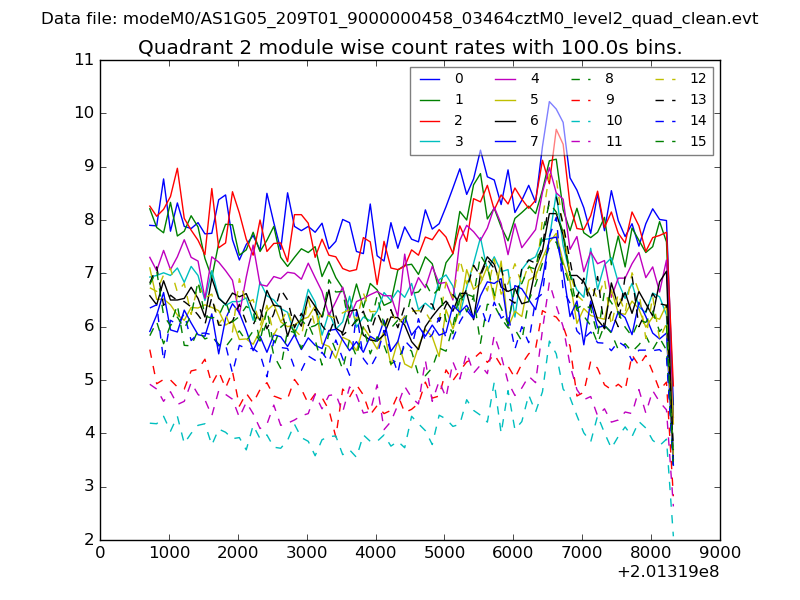
| Module-wise count rates for Quadrant B Data is divided into 100 sec bins |
 |
 |
| Module-wise count rates for Quadrant C Data is divided into 100 sec bins |
 |
 |
| Module-wise count rates for Quadrant D Data is divided into 100 sec bins |
 |
 |
| Parameter | Plot |
|---|---|
| CZT HV Monitor | 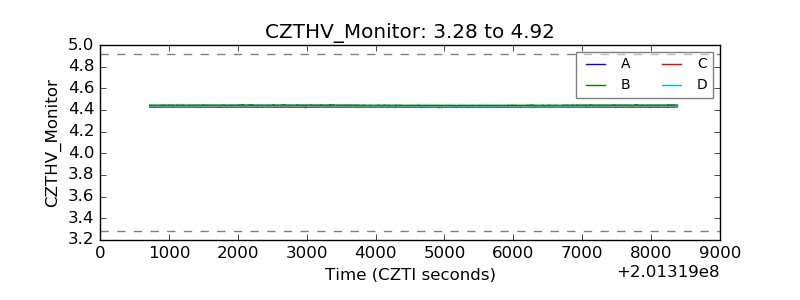 |
| D_VDD |  |
| Temperature 1 | 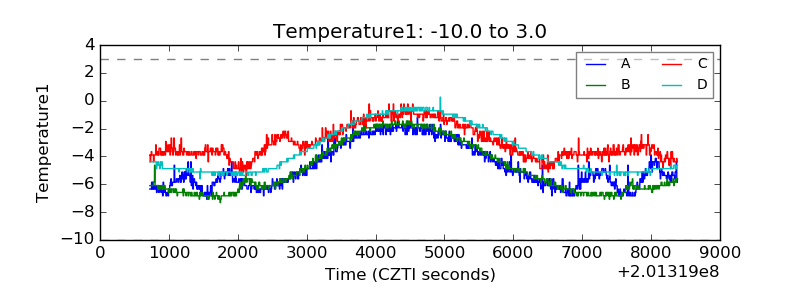 |
| Veto HV Monitor | 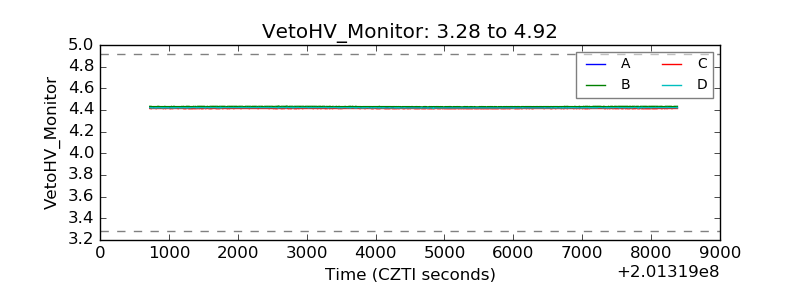 |
| Veto LLD | 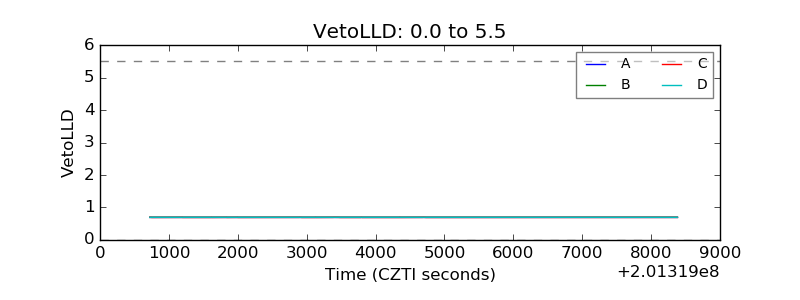 |
| Alpha Counter | 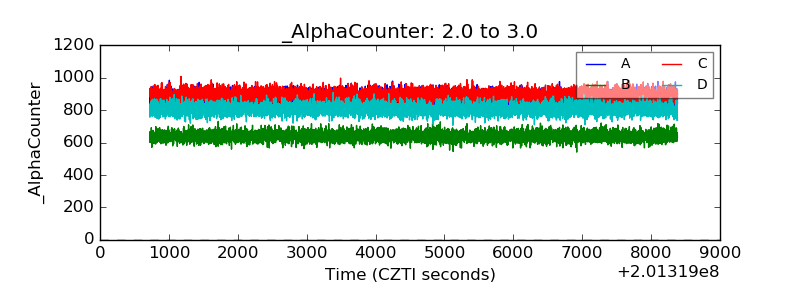 |
| _CPM_Rate | 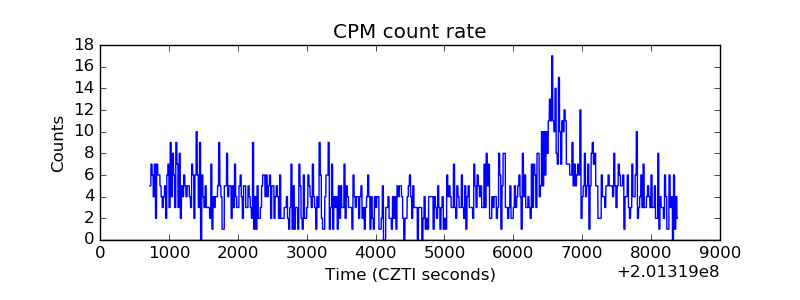 |
| CZT Counter | 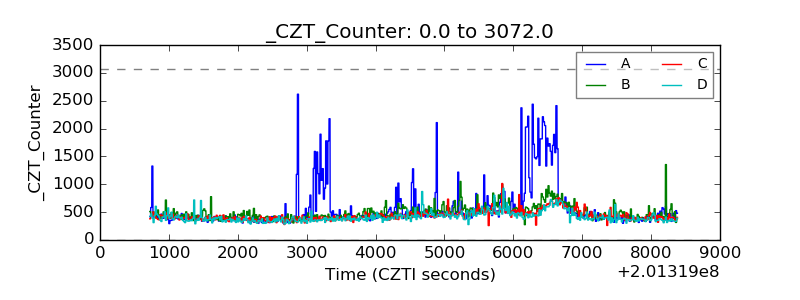 |
| +2.5 Volts monitor |  |
| +5 Volts monitor |  |
| _ROLL_ROT | 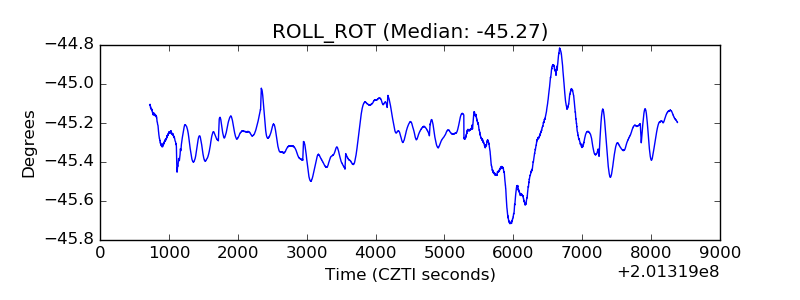 |
| _Roll_DEC | 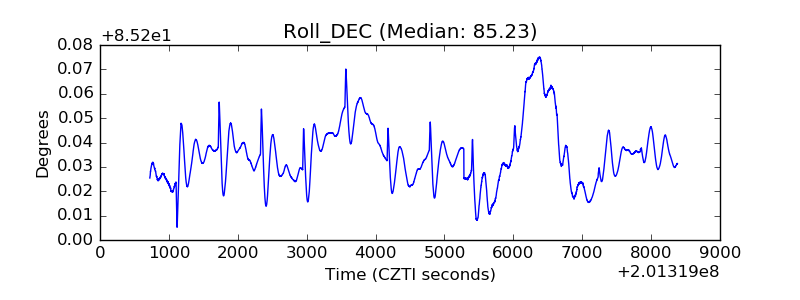 |
| _Roll_RA |  |
| Veto Counter | 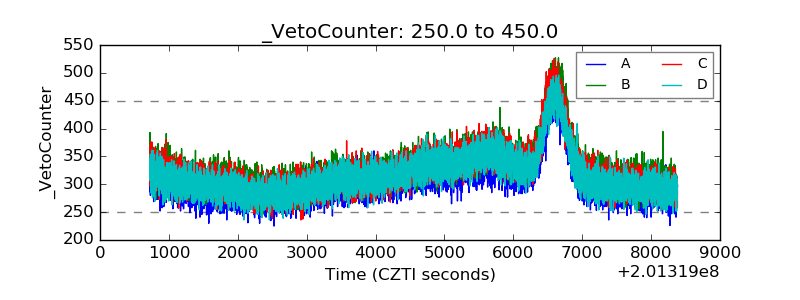 |