| Param | Original file | Final file |
|---|---|---|
| Filename | modeM0/AS1G05_209T01_9000000458_03467cztM0_level2.evt | modeM0/AS1G05_209T01_9000000458_03467cztM0_level2_quad_clean.evt |
| Size (bytes) | 780,860,160 | 172,647,360 |
| Size | 744.7 MB | 164.6 MB |
| Events in quadrant A | 5,895,200 | 1,111,100 |
| Events in quadrant B | 6,369,617 | 1,110,156 |
| Events in quadrant C | 5,517,092 | 1,124,055 |
| Events in quadrant D | 5,092,479 | 1,093,298 |
| Mode M9 | |||
|---|---|---|---|
| Quadrant | BADHDUFLAG | Total packets | Discarded packets |
| A | 0 | 11 | 0 |
| B | 0 | 11 | 0 |
| C | 0 | 11 | 0 |
| D | 0 | 11 | 0 |
| Mode SS | |||
|---|---|---|---|
| Quadrant | BADHDUFLAG | Total packets | Discarded packets |
| A | 0 | 232 | 0 |
| B | 0 | 232 | 0 |
| C | 0 | 232 | 0 |
| D | 0 | 232 | 0 |
| Mode M0 | |||
|---|---|---|---|
| Quadrant | BADHDUFLAG | Total packets | Discarded packets |
| A | 0 | 25914 | 7 |
| B | 0 | 26535 | 2 |
| C | 0 | 24817 | 2 |
| D | 0 | 23971 | 2 |
| Quadrant | Total seconds | Saturated seconds | Saturation percentage |
|---|---|---|---|
| A | 11423 | 275 | 2.407424% |
| B | 11424 | 177 | 1.549370% |
| C | 11424 | 189 | 1.654412% |
| D | 11424 | 161 | 1.409314% |
Noise dominated data is calculated using 1-second bins in cleaned event files. If a bin has >2000 counts, and if more than 50% of those come from <1% of pixels, then it is considered to be noise-dominated and hence unusable.
| Quadrant | # 1 sec bins | Bins with >0 counts | Bins with >2000 counts | High rate bins dominated by noise | Noise dominated (total time) | Noise dominated (detector-on time) | Marked lightcurve |
|---|---|---|---|---|---|---|---|
| A | 12569 | 11424 | 95 | 95 | 0.76% | 0.83% | 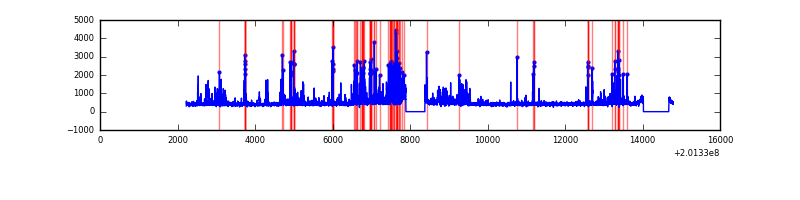 |
| B | 12569 | 11426 | 47 | 47 | 0.37% | 0.41% | 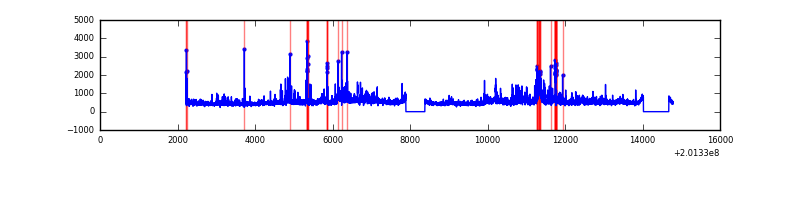 |
| C | 12569 | 11426 | 143 | 143 | 1.14% | 1.25% | 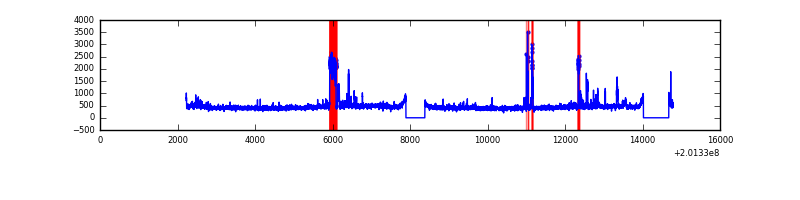 |
| D | 12569 | 11425 | 50 | 50 | 0.40% | 0.44% | 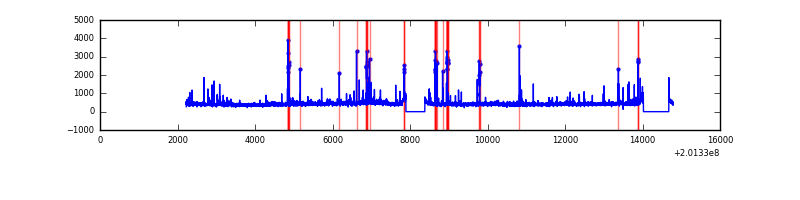 |
Top three noisy pixels from each quadrant. If the there are fewer than three noisy pixels in the level2.evt file, extra rows are filled as -1
| Pixel properties | Quadrant properties | ||||||
|---|---|---|---|---|---|---|---|
| Quadrant | DetID | PixID | Counts | Sigma | Mean | Median | Sigma |
| A | 8 | 15 | 660208 | 2583.98 | 1239 | 1206 | 255.0 |
| A | 0 | 31 | 209583 | 817.06 | 1239 | 1206 | 255.0 |
| A | 0 | 118 | 183013 | 712.88 | 1239 | 1206 | 255.0 |
| B | 15 | 204 | 807817 | 3343.55 | 1257 | 1225 | 241.2 |
| B | 4 | 170 | 192943 | 794.73 | 1257 | 1225 | 241.2 |
| B | 14 | 167 | 90135 | 368.56 | 1257 | 1225 | 241.2 |
| C | 1 | 192 | 646687 | 2285.53 | 1214 | 1217 | 282.4 |
| C | 9 | 144 | 41741 | 143.49 | 1214 | 1217 | 282.4 |
| C | 8 | 128 | 20579 | 68.56 | 1214 | 1217 | 282.4 |
| D | 13 | 223 | 152635 | 518.5 | 1206 | 1165 | 292.1 |
| D | 2 | 37 | 72406 | 243.87 | 1206 | 1165 | 292.1 |
| D | 8 | 195 | 67106 | 225.72 | 1206 | 1165 | 292.1 |
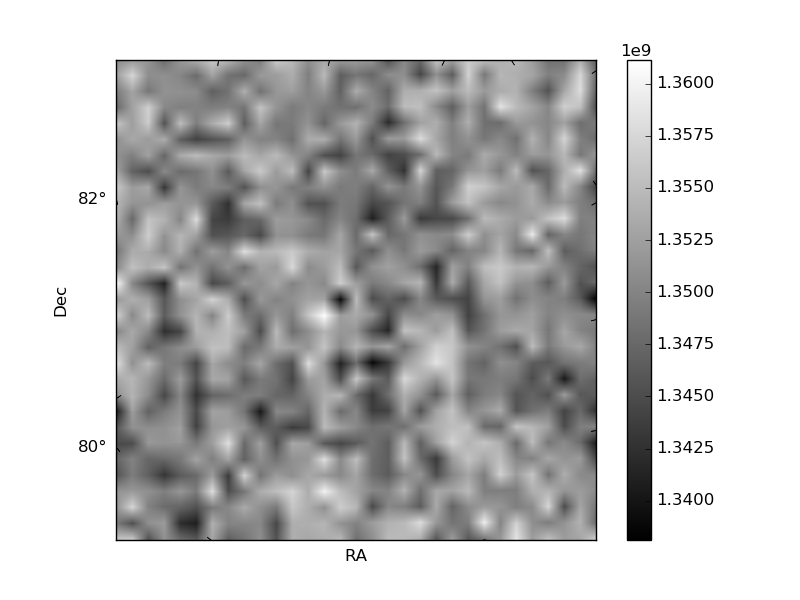
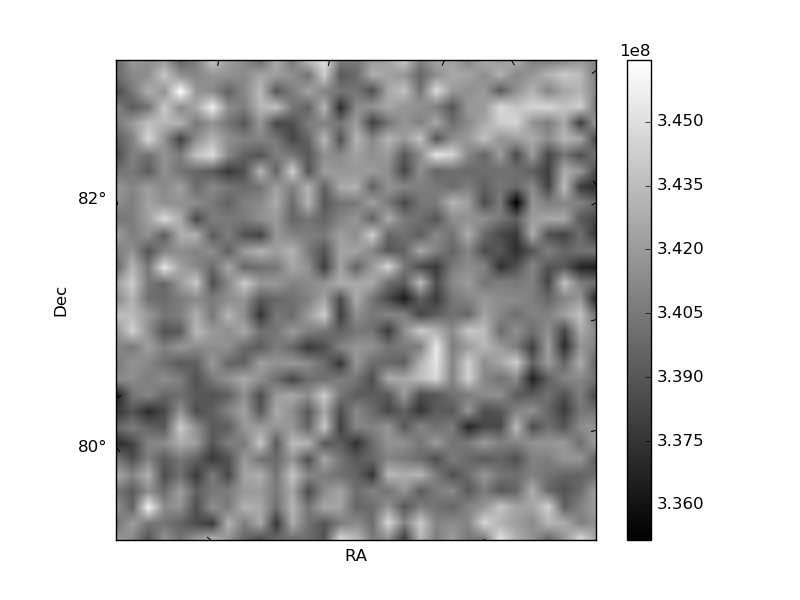
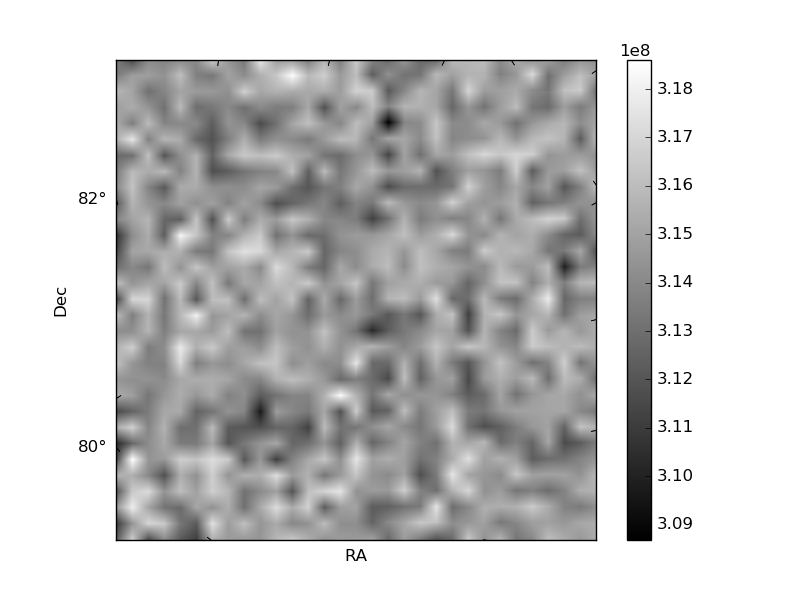
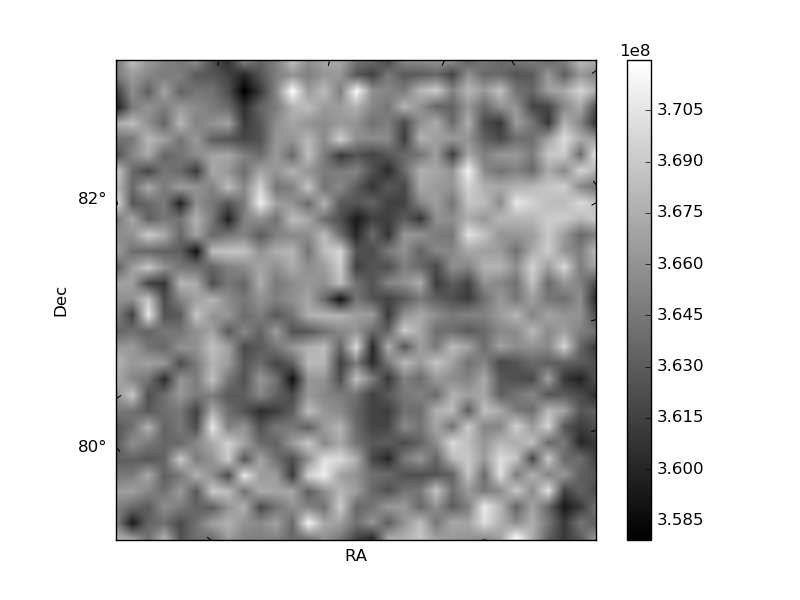
Histogram calculated using DETX and DETY for each event in the final _common_clean file
| Quadrant A | 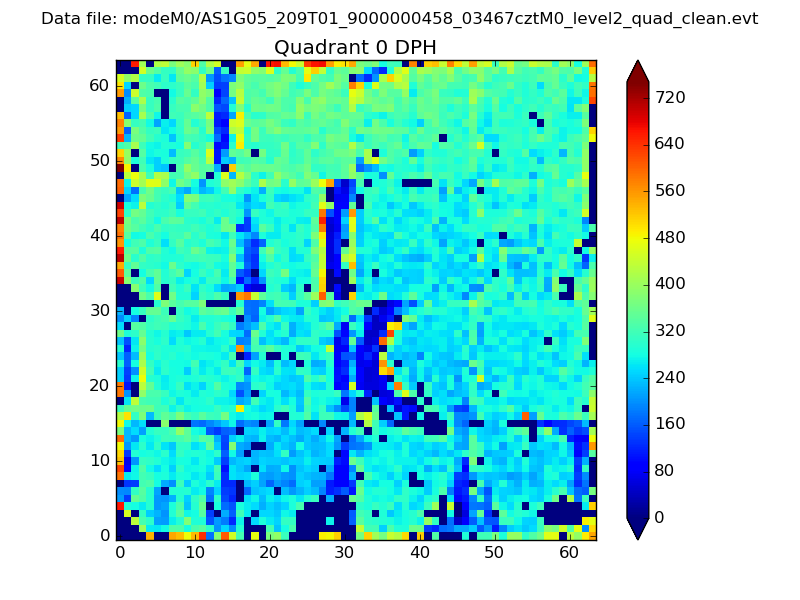 |
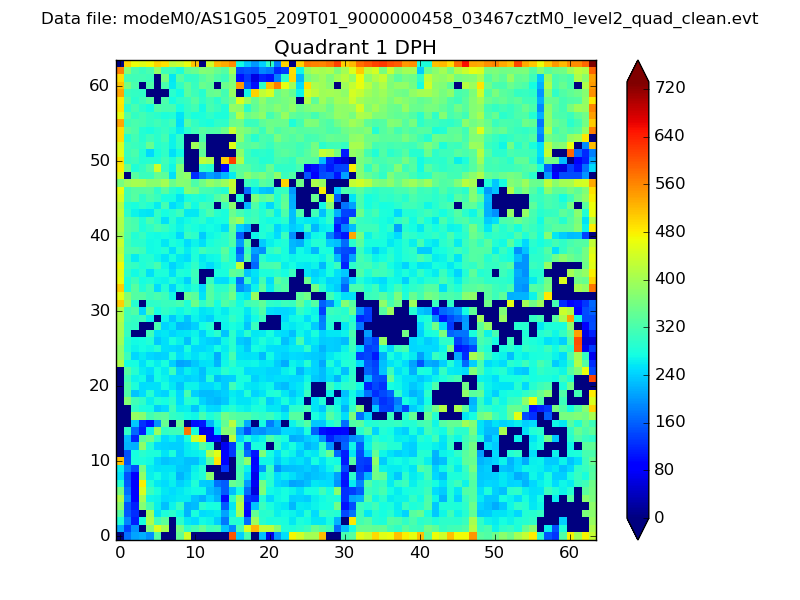 |
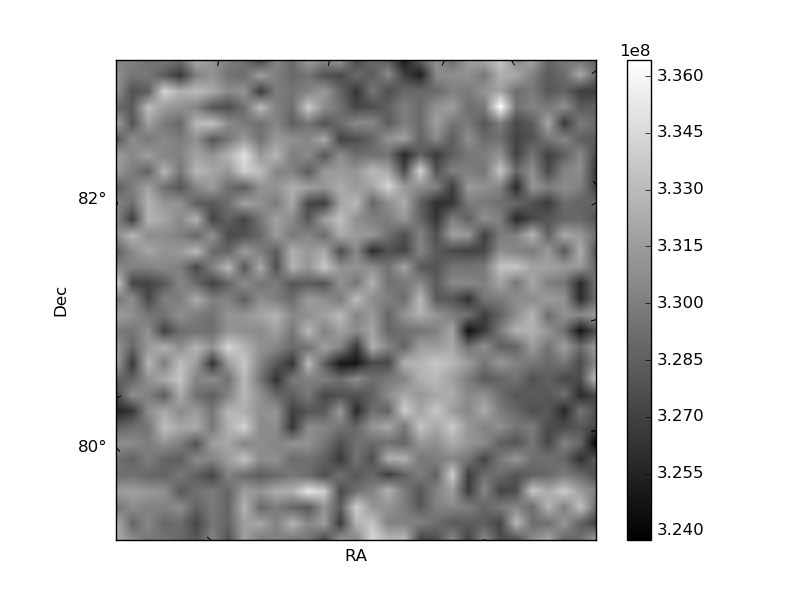
Quadrant B |
|---|---|---|---|
| Quadrant D | 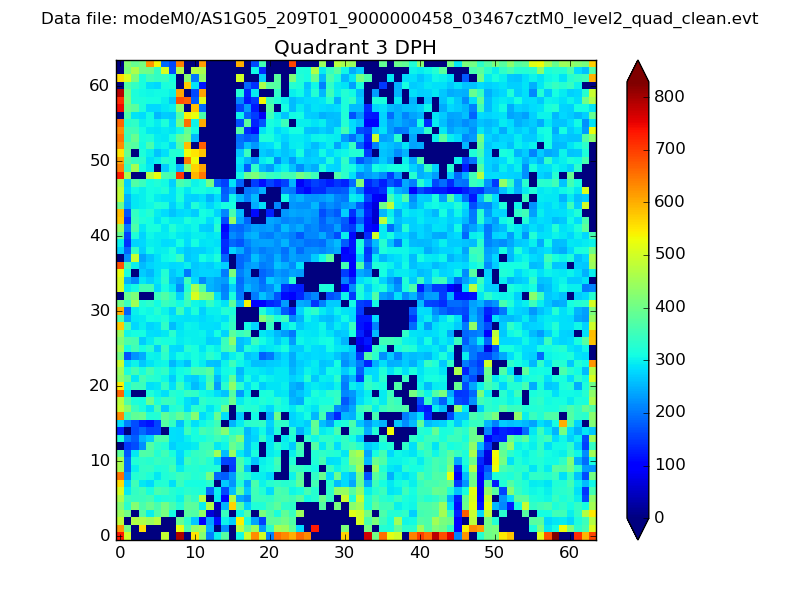 |
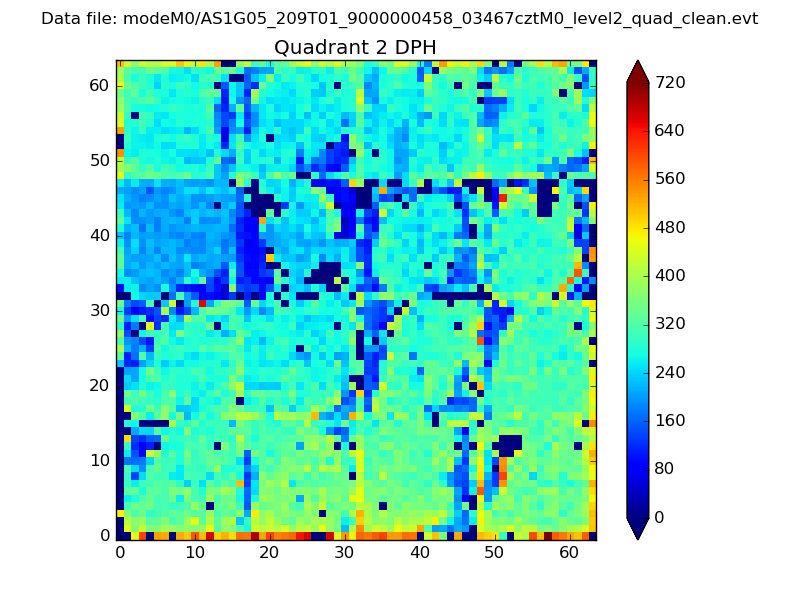 |
Quadrant C |
| Plot type | Count rate plots | Images |
|---|---|---|
| Comparison with Poisson distribution Blue bars denote a histogram of data divided into 1 sec bins. Red curve is a Poisson curve with rate = median count rate of data. |
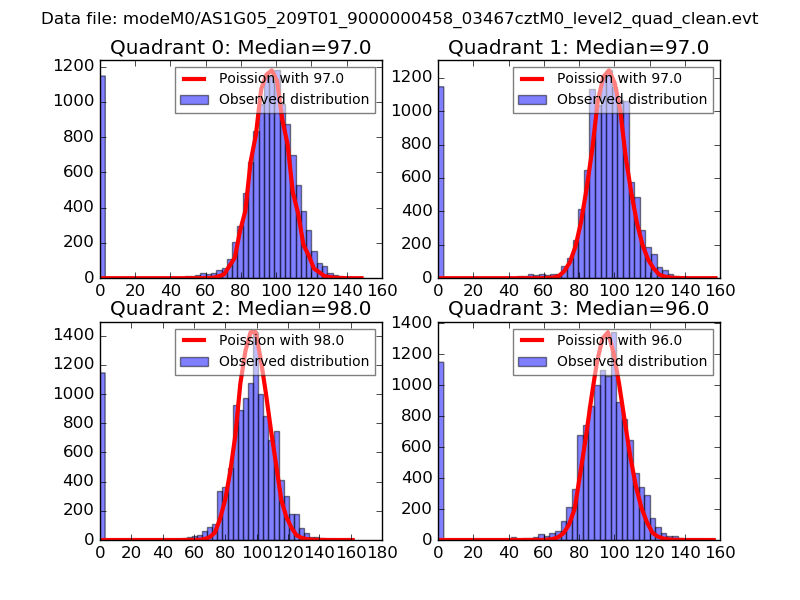 |
 |
| Quadrant-wise count rates Data is divided into 100 sec bins |
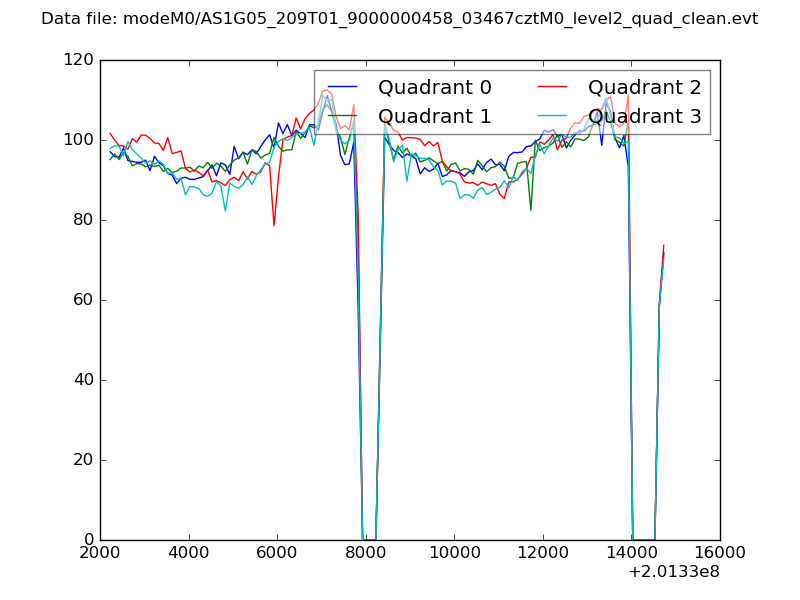 |
|
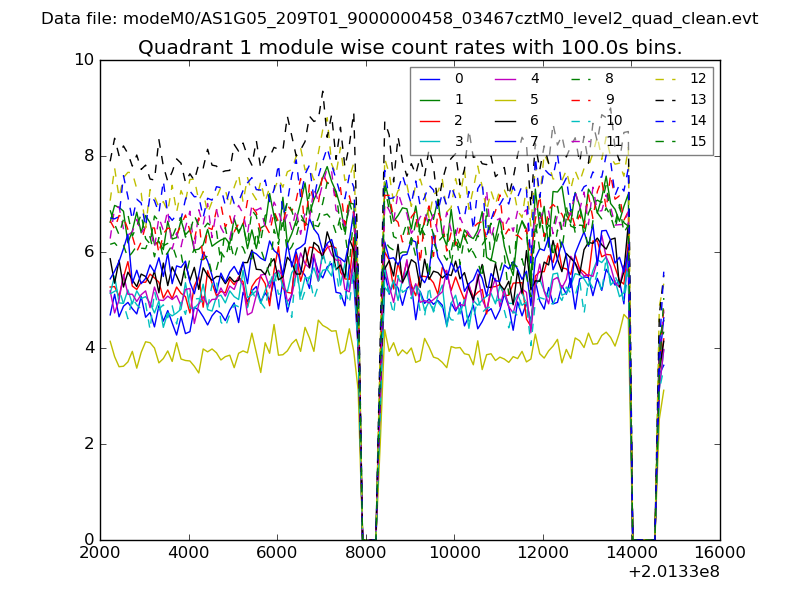
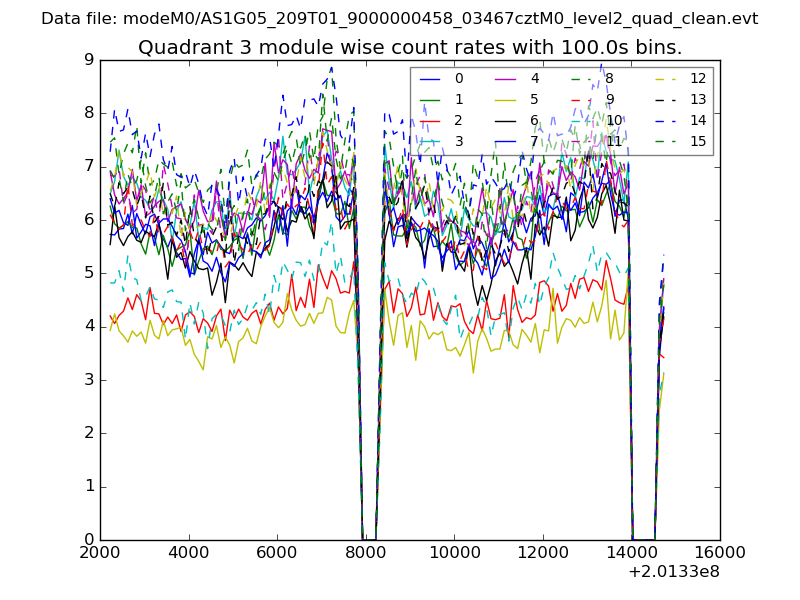
| Module-wise count rates for Quadrant A Data is divided into 100 sec bins |
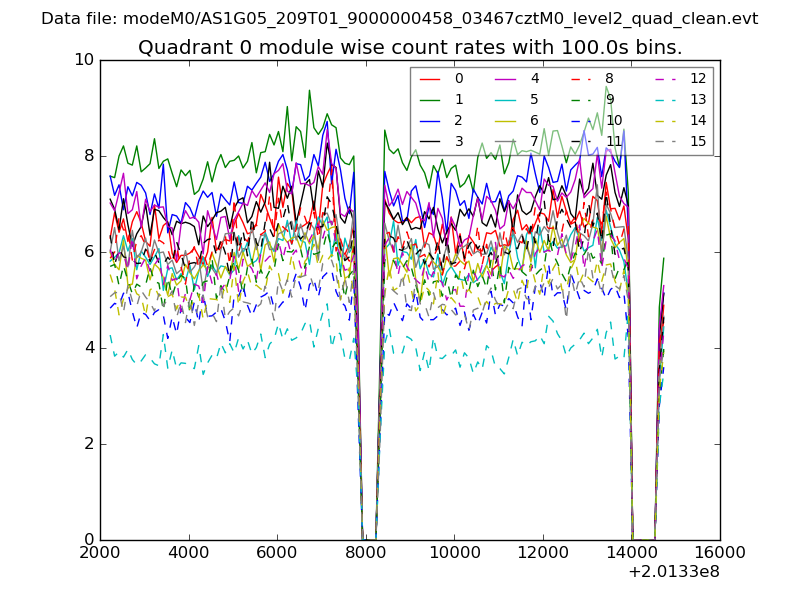 |
 |
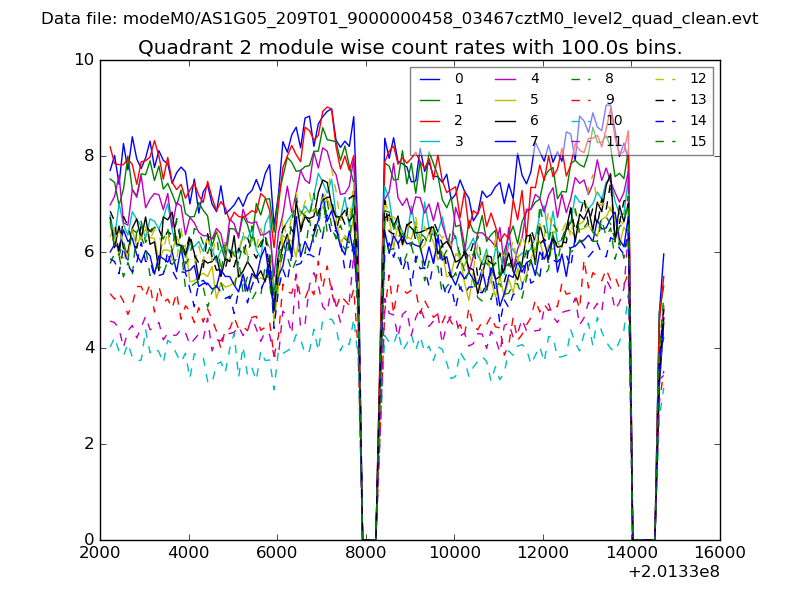
| Module-wise count rates for Quadrant B Data is divided into 100 sec bins |
 |
 |
| Module-wise count rates for Quadrant C Data is divided into 100 sec bins |
 |
 |
| Module-wise count rates for Quadrant D Data is divided into 100 sec bins |
 |
 |
| Parameter | Plot |
|---|---|
| CZT HV Monitor | 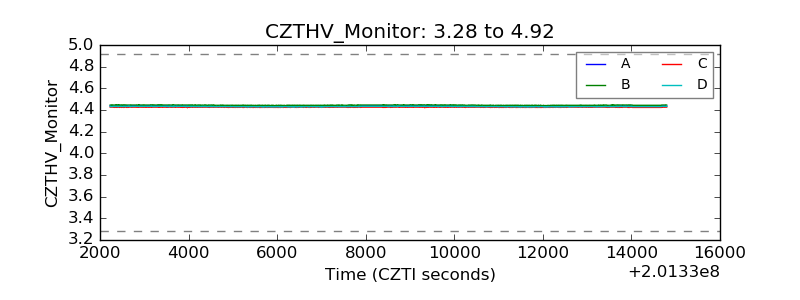 |
| D_VDD | 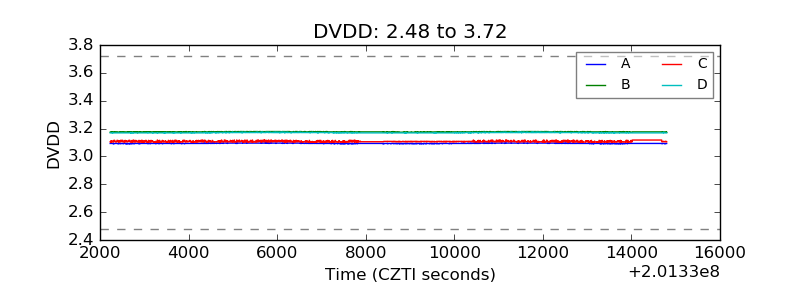 |
| Temperature 1 | 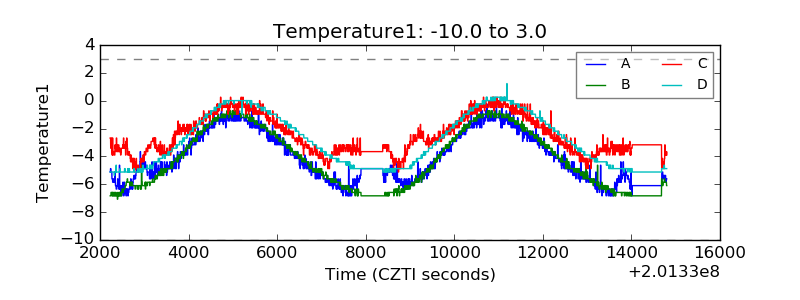 |
| Veto HV Monitor | 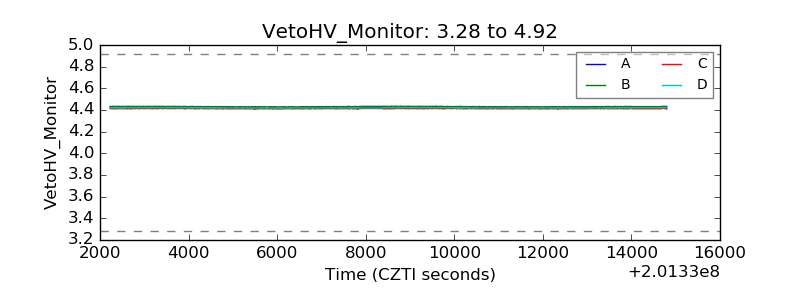 |
| Veto LLD | 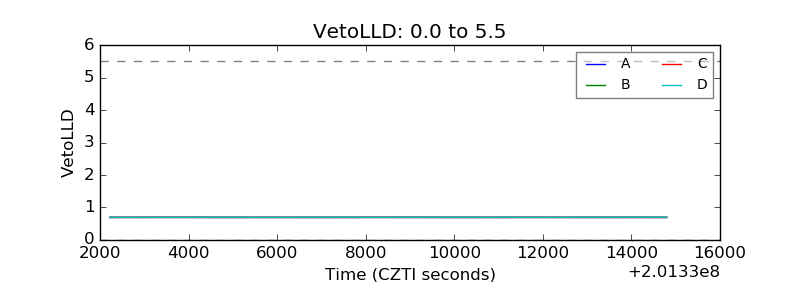 |
| Alpha Counter | 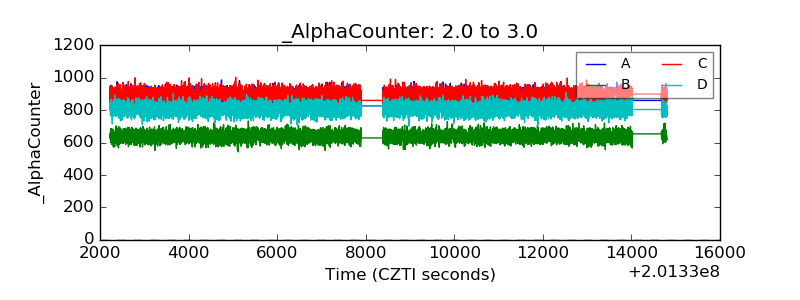 |
| _CPM_Rate |  |
| CZT Counter | 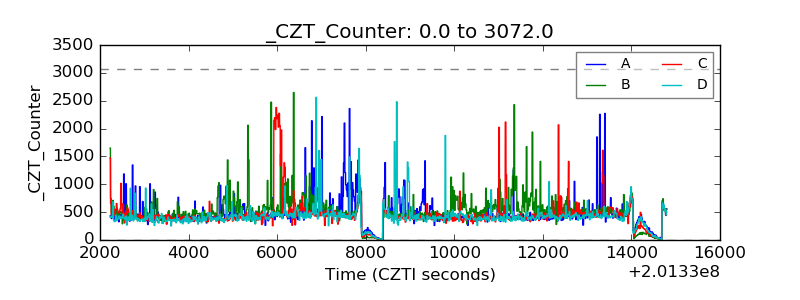 |
| +2.5 Volts monitor |  |
| +5 Volts monitor | 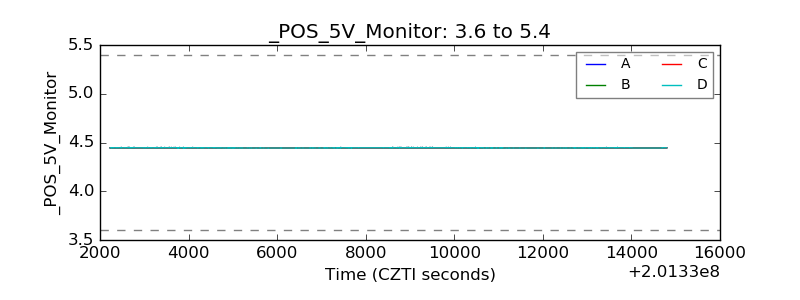 |
| _ROLL_ROT | 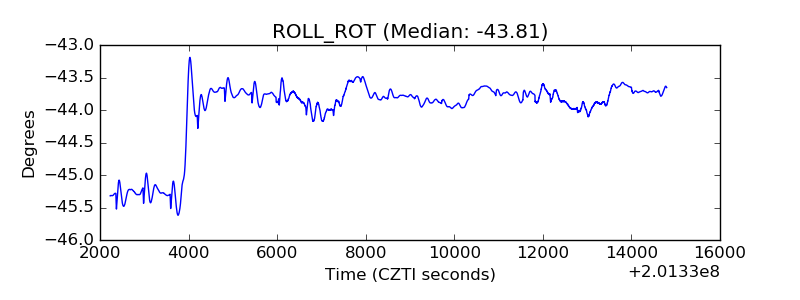 |
| _Roll_DEC | 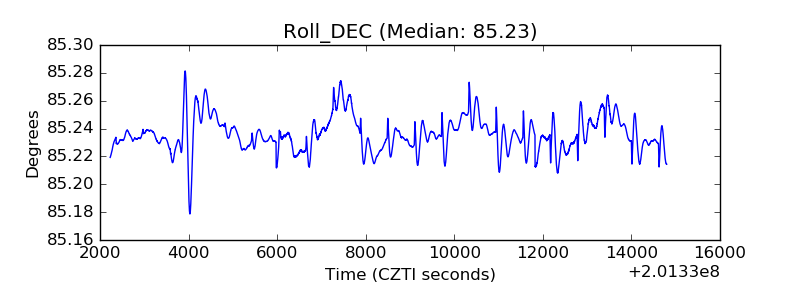 |
| _Roll_RA | 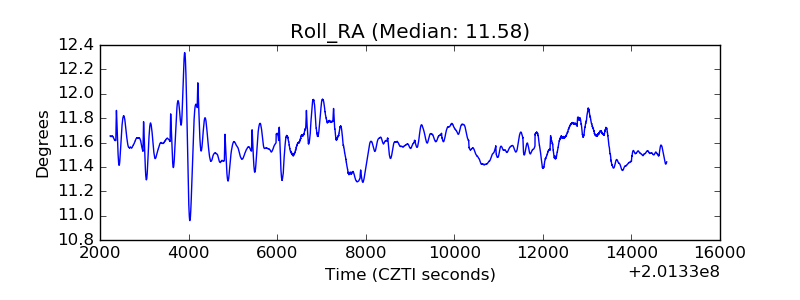 |
| Veto Counter | 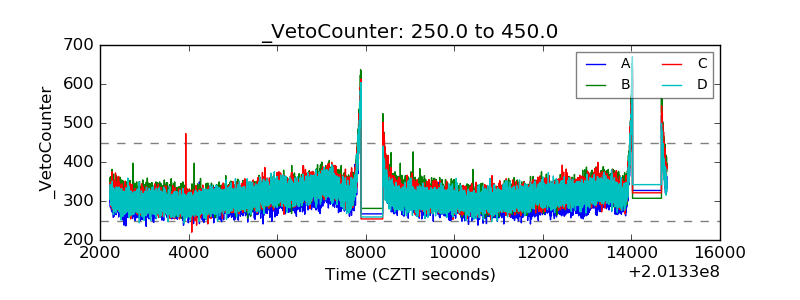 |