| Param | Original file | Final file |
|---|---|---|
| Filename | modeM0/AS1G05_209T01_9000000458_03468cztM0_level2.evt | modeM0/AS1G05_209T01_9000000458_03468cztM0_level2_quad_clean.evt |
| Size (bytes) | 266,376,960 | 61,113,600 |
| Size | 254.0 MB | 58.3 MB |
| Events in quadrant A | 1,881,169 | 396,273 |
| Events in quadrant B | 2,455,642 | 390,951 |
| Events in quadrant C | 1,695,615 | 392,553 |
| Events in quadrant D | 1,756,430 | 383,517 |
| Mode SS | |||
|---|---|---|---|
| Quadrant | BADHDUFLAG | Total packets | Discarded packets |
| A | 0 | 82 | 0 |
| B | 0 | 82 | 0 |
| C | 0 | 82 | 0 |
| D | 0 | 82 | 0 |
| Mode M0 | |||
|---|---|---|---|
| Quadrant | BADHDUFLAG | Total packets | Discarded packets |
| A | 0 | 8506 | 0 |
| B | 0 | 9980 | 0 |
| C | 0 | 8204 | 0 |
| D | 0 | 8461 | 0 |
| Quadrant | Total seconds | Saturated seconds | Saturation percentage |
|---|---|---|---|
| A | 4070 | 6 | 0.147420% |
| B | 4070 | 37 | 0.909091% |
| C | 4070 | 7 | 0.171990% |
| D | 4070 | 9 | 0.221130% |
Noise dominated data is calculated using 1-second bins in cleaned event files. If a bin has >2000 counts, and if more than 50% of those come from <1% of pixels, then it is considered to be noise-dominated and hence unusable.
| Quadrant | # 1 sec bins | Bins with >0 counts | Bins with >2000 counts | High rate bins dominated by noise | Noise dominated (total time) | Noise dominated (detector-on time) | Marked lightcurve |
|---|---|---|---|---|---|---|---|
| A | 4070 | 4070 | 1 | 1 | 0.02% | 0.02% | 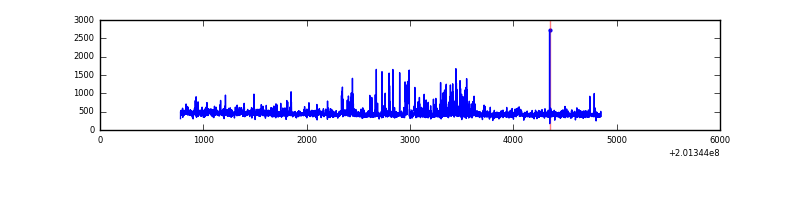 |
| B | 4070 | 4070 | 32 | 32 | 0.79% | 0.79% | 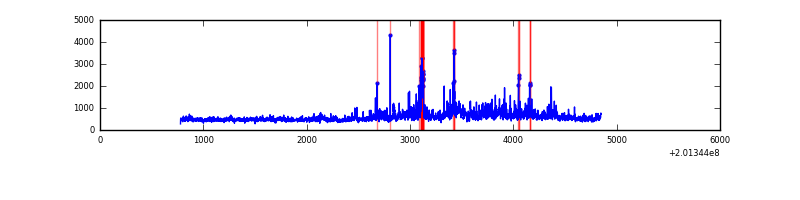 |
| C | 4070 | 4070 | 7 | 7 | 0.17% | 0.17% | 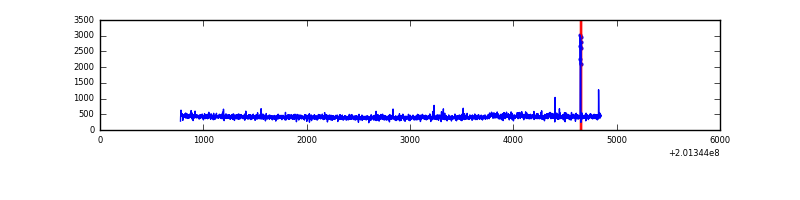 |
| D | 4070 | 4070 | 7 | 7 | 0.17% | 0.17% | 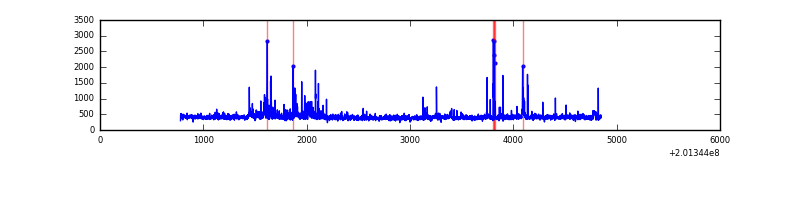 |
Top three noisy pixels from each quadrant. If the there are fewer than three noisy pixels in the level2.evt file, extra rows are filled as -1
| Pixel properties | Quadrant properties | ||||||
|---|---|---|---|---|---|---|---|
| Quadrant | DetID | PixID | Counts | Sigma | Mean | Median | Sigma |
| A | 8 | 15 | 142375 | 1570.53 | 434 | 425 | 90.4 |
| A | 0 | 118 | 28212 | 307.43 | 434 | 425 | 90.4 |
| A | 0 | 50 | 23191 | 251.88 | 434 | 425 | 90.4 |
| B | 15 | 204 | 474448 | 5565.52 | 436 | 426 | 85.2 |
| B | 4 | 200 | 62787 | 732.18 | 436 | 426 | 85.2 |
| B | 15 | 54 | 53781 | 626.44 | 436 | 426 | 85.2 |
| C | 1 | 192 | 37925 | 379.74 | 419 | 421 | 98.8 |
| C | 15 | 208 | 5396 | 50.37 | 419 | 421 | 98.8 |
| C | 6 | 80 | 4687 | 43.19 | 419 | 421 | 98.8 |
| D | 4 | 160 | 80868 | 787.61 | 421 | 408 | 102.2 |
| D | 6 | 112 | 28191 | 271.96 | 421 | 408 | 102.2 |
| D | 13 | 70 | 13171 | 124.93 | 421 | 408 | 102.2 |
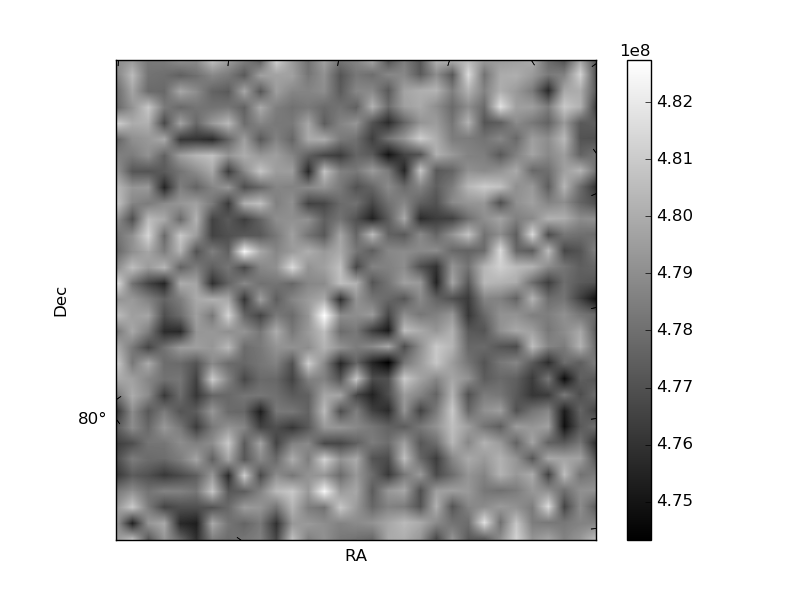
Histogram calculated using DETX and DETY for each event in the final _common_clean file
| Quadrant A | 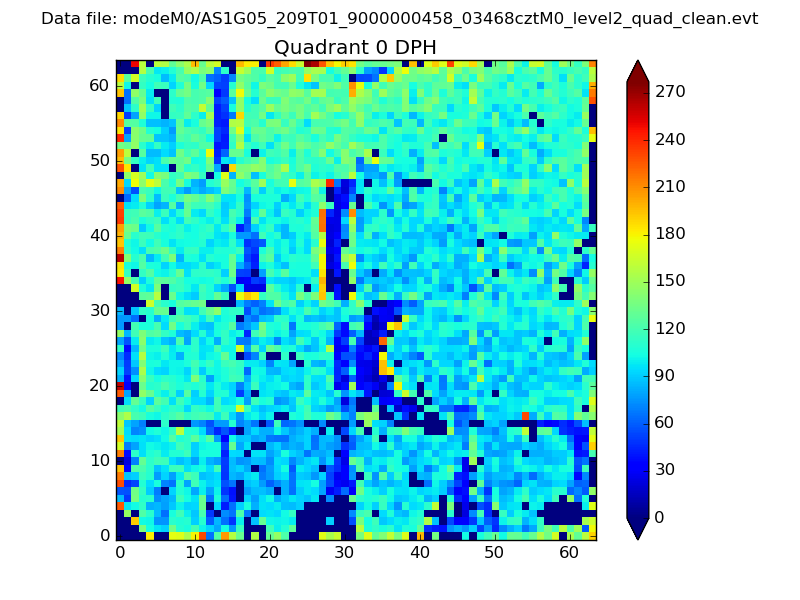 |
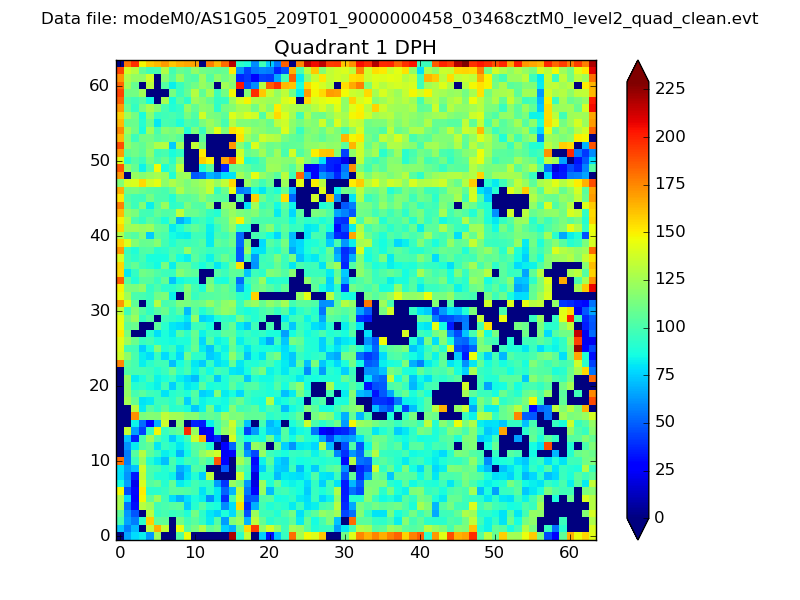 |
Quadrant B |
|---|---|---|---|
| Quadrant D |  |
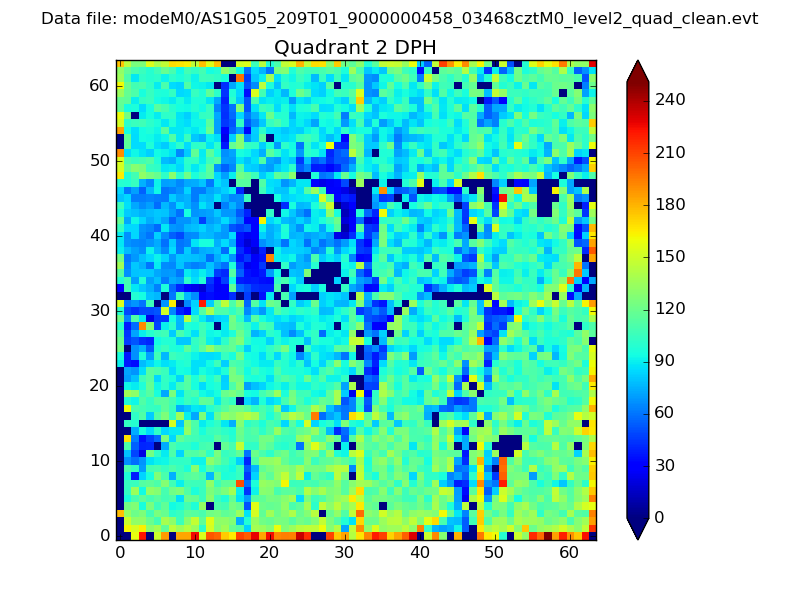 |
Quadrant C |
| Plot type | Count rate plots | Images |
|---|---|---|
| Comparison with Poisson distribution Blue bars denote a histogram of data divided into 1 sec bins. Red curve is a Poisson curve with rate = median count rate of data. |
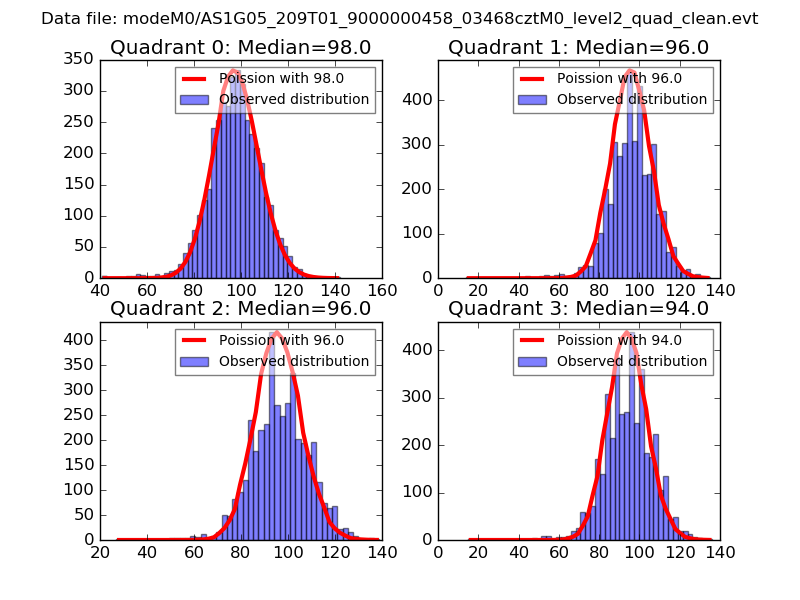 |
 |
| Quadrant-wise count rates Data is divided into 100 sec bins |
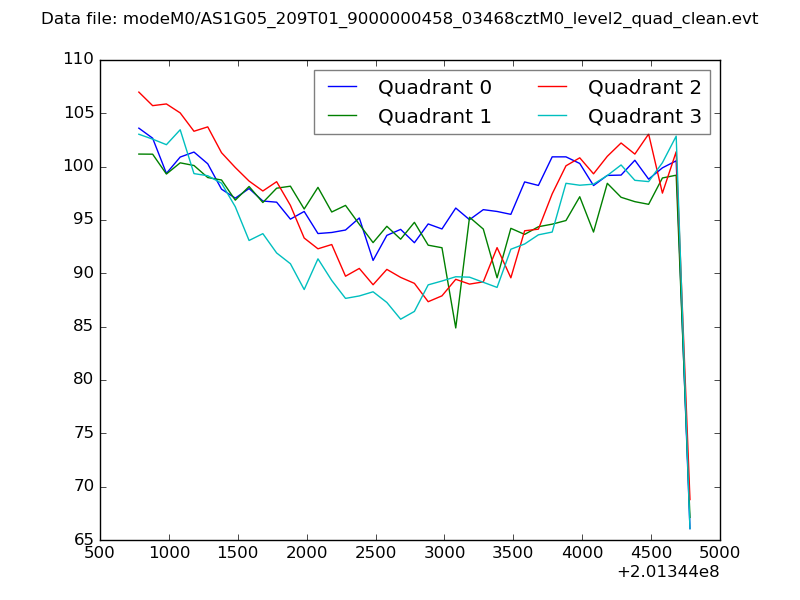 |
|
| Module-wise count rates for Quadrant A Data is divided into 100 sec bins |
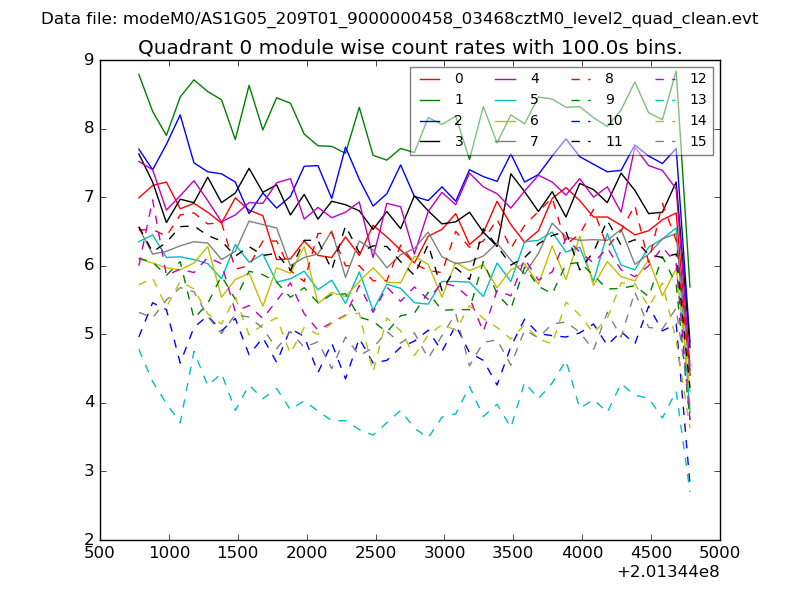 |
 |
| Module-wise count rates for Quadrant B Data is divided into 100 sec bins |
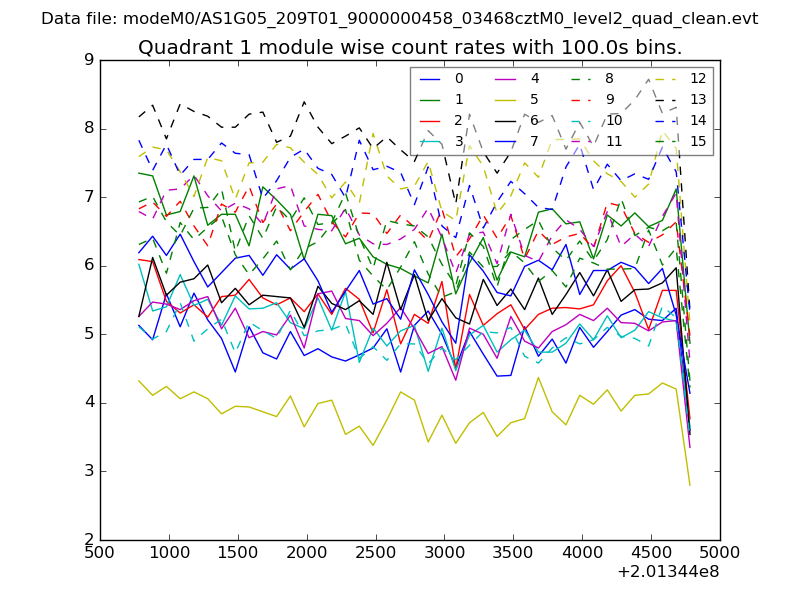 |
 |
| Module-wise count rates for Quadrant C Data is divided into 100 sec bins |
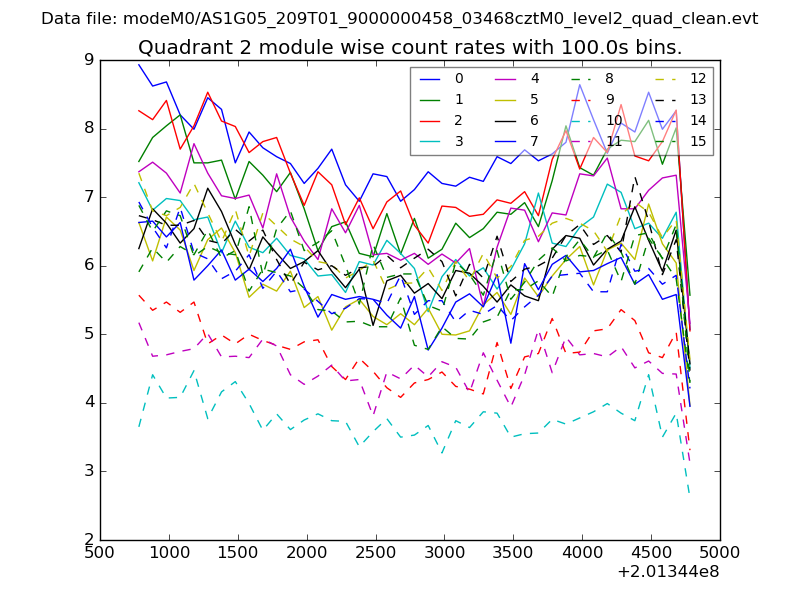 |
 |
| Module-wise count rates for Quadrant D Data is divided into 100 sec bins |
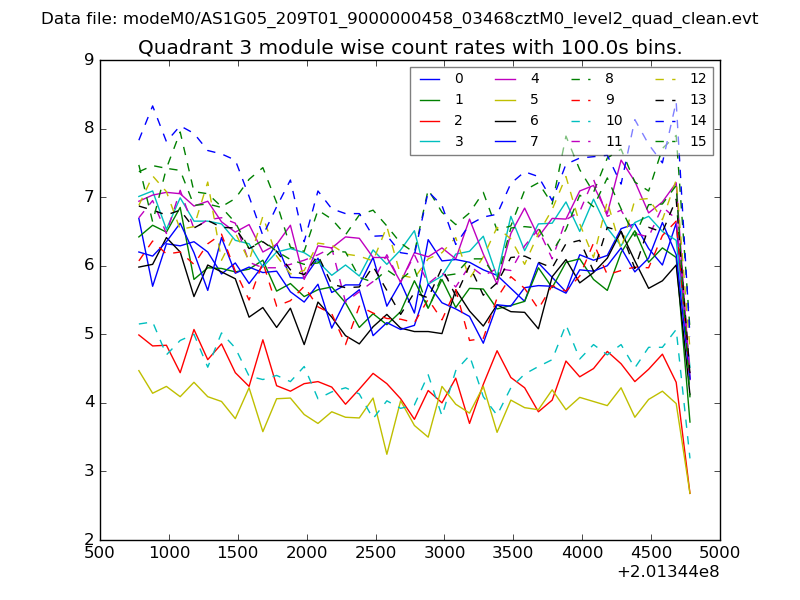 |
 |
| Parameter | Plot |
|---|---|
| CZT HV Monitor | 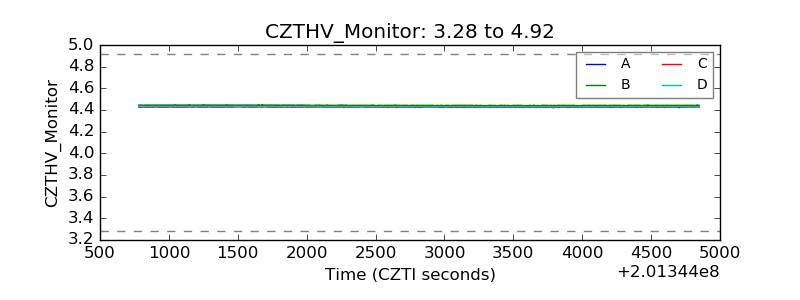 |
| D_VDD | 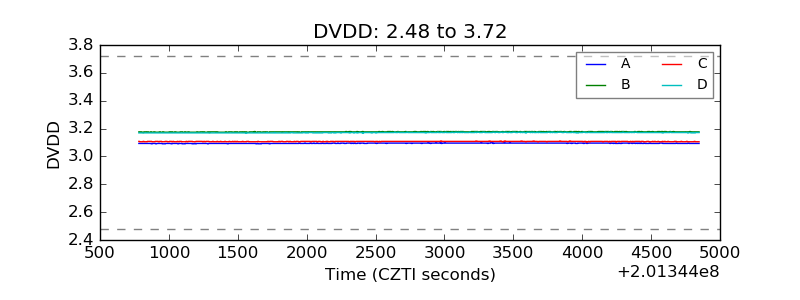 |
| Temperature 1 | 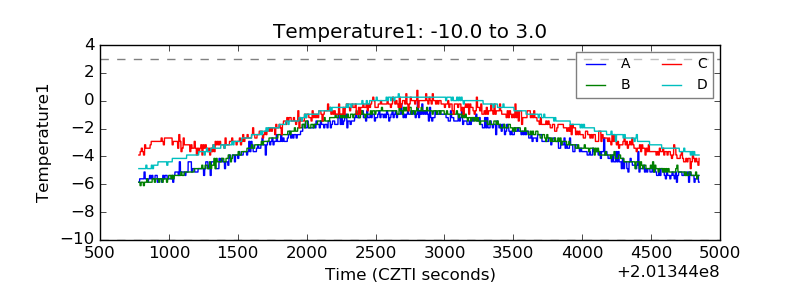 |
| Veto HV Monitor | 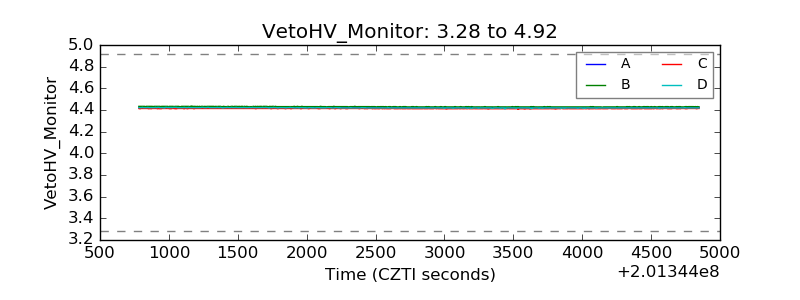 |
| Veto LLD | 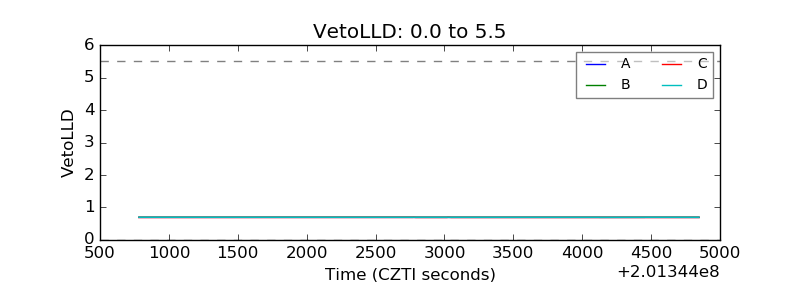 |
| Alpha Counter | 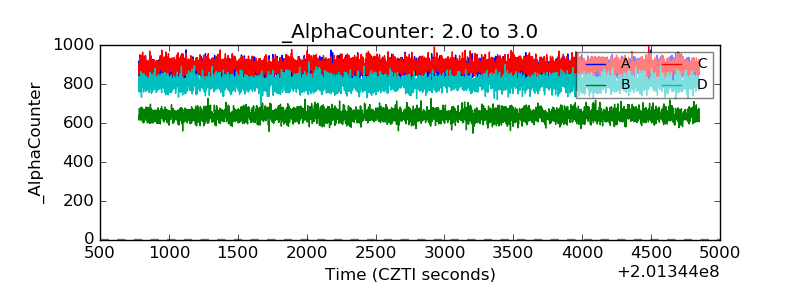 |
| _CPM_Rate | 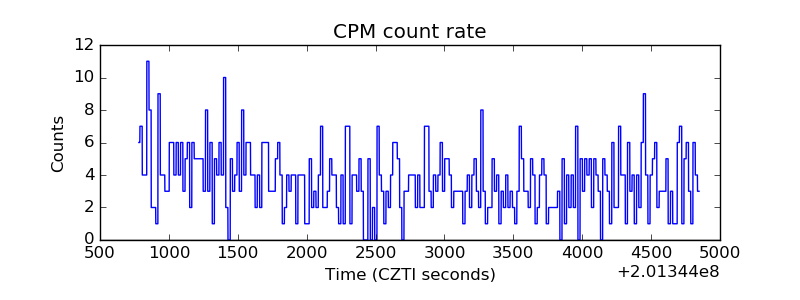 |
| CZT Counter | 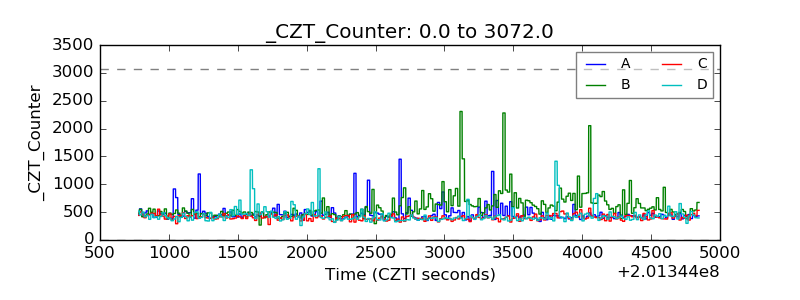 |
| +2.5 Volts monitor |  |
| +5 Volts monitor |  |
| _ROLL_ROT | 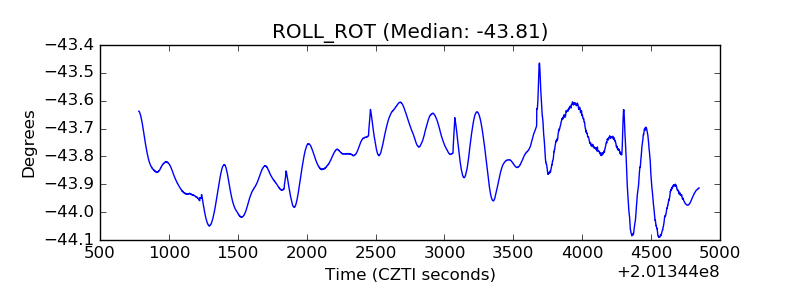 |
| _Roll_DEC | 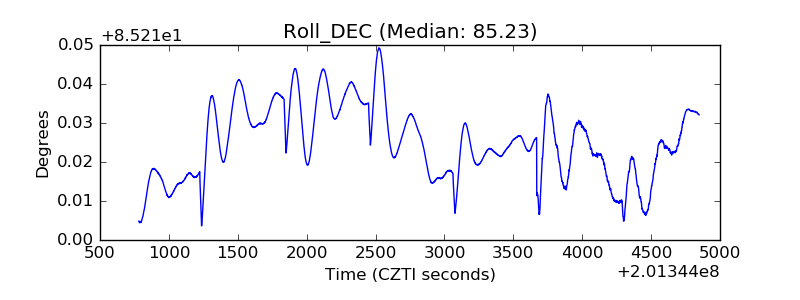 |
| _Roll_RA |  |
| Veto Counter | 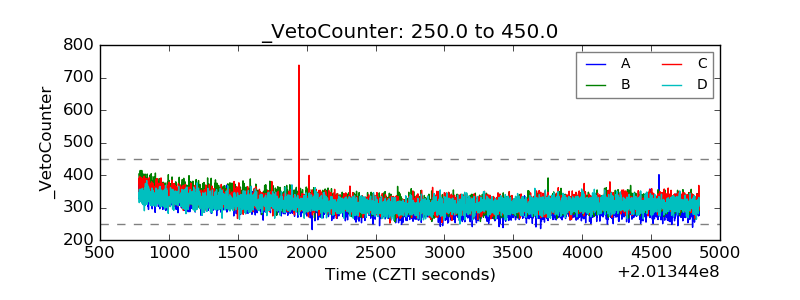 |