| Param | Original file | Final file |
|---|---|---|
| Filename | modeM0/AS1SLEW_01234_9000000457_03459cztM0_level2.evt | modeM0/AS1SLEW_01234_9000000457_03459cztM0_level2_quad_clean.evt |
| Size (bytes) | 39,205,440 | 12,401,280 |
| Size | 37.4 MB | 11.8 MB |
| Events in quadrant A | 276,814 | 79,447 |
| Events in quadrant B | 290,605 | 79,906 |
| Events in quadrant C | 287,481 | 81,233 |
| Events in quadrant D | 281,651 | 78,292 |
| Mode SS | |||
|---|---|---|---|
| Quadrant | BADHDUFLAG | Total packets | Discarded packets |
| A | 0 | 14 | 0 |
| B | 0 | 14 | 0 |
| C | 0 | 14 | 0 |
| D | 0 | 14 | 0 |
| Mode M0 | |||
|---|---|---|---|
| Quadrant | BADHDUFLAG | Total packets | Discarded packets |
| A | 0 | 1384 | 0 |
| B | 0 | 1389 | 0 |
| C | 0 | 1389 | 0 |
| D | 0 | 1414 | 0 |
| Quadrant | Total seconds | Saturated seconds | Saturation percentage |
|---|---|---|---|
| A | 693 | 0 | 0.000000% |
| B | 693 | 0 | 0.000000% |
| C | 693 | 0 | 0.000000% |
| D | 693 | 0 | 0.000000% |
Noise dominated data is calculated using 1-second bins in cleaned event files. If a bin has >2000 counts, and if more than 50% of those come from <1% of pixels, then it is considered to be noise-dominated and hence unusable.
| Quadrant | # 1 sec bins | Bins with >0 counts | Bins with >2000 counts | High rate bins dominated by noise | Noise dominated (total time) | Noise dominated (detector-on time) | Marked lightcurve |
|---|---|---|---|---|---|---|---|
| A | 693 | 693 | 0 | 0 | 0.00% | 0.00% | 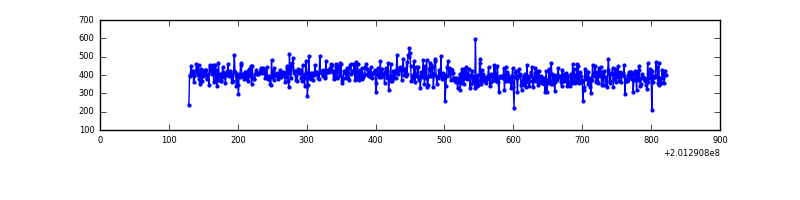 |
| B | 693 | 693 | 0 | 0 | 0.00% | 0.00% | 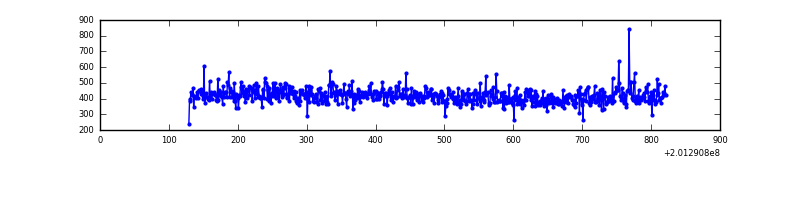 |
| C | 693 | 693 | 0 | 0 | 0.00% | 0.00% | 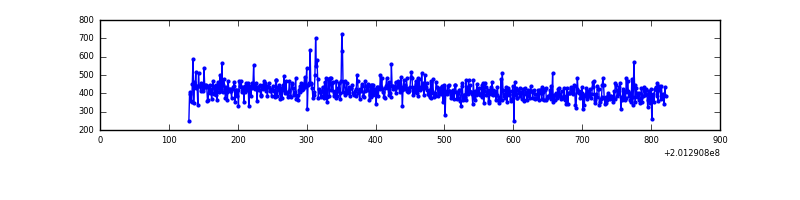 |
| D | 693 | 693 | 0 | 0 | 0.00% | 0.00% |  |
Top three noisy pixels from each quadrant. If the there are fewer than three noisy pixels in the level2.evt file, extra rows are filled as -1
| Pixel properties | Quadrant properties | ||||||
|---|---|---|---|---|---|---|---|
| Quadrant | DetID | PixID | Counts | Sigma | Mean | Median | Sigma |
| A | 8 | 15 | 970 | 54.21 | 71 | 70 | 16.6 |
| A | 0 | 226 | 745 | 40.66 | 71 | 70 | 16.6 |
| A | 12 | 194 | 708 | 38.43 | 71 | 70 | 16.6 |
| B | 15 | 204 | 4751 | 291.17 | 73 | 72 | 16.1 |
| B | 12 | 111 | 1024 | 59.24 | 73 | 72 | 16.1 |
| B | 0 | 219 | 988 | 57.0 | 73 | 72 | 16.1 |
| C | 9 | 144 | 3051 | 160.91 | 72 | 72 | 18.5 |
| C | 15 | 208 | 2098 | 109.43 | 72 | 72 | 18.5 |
| C | 13 | 61 | 617 | 29.44 | 72 | 72 | 18.5 |
| D | 10 | 199 | 8844 | 457.44 | 70 | 67 | 19.2 |
| D | 1 | 31 | 3013 | 153.54 | 70 | 67 | 19.2 |
| D | 13 | 239 | 1847 | 92.77 | 70 | 67 | 19.2 |
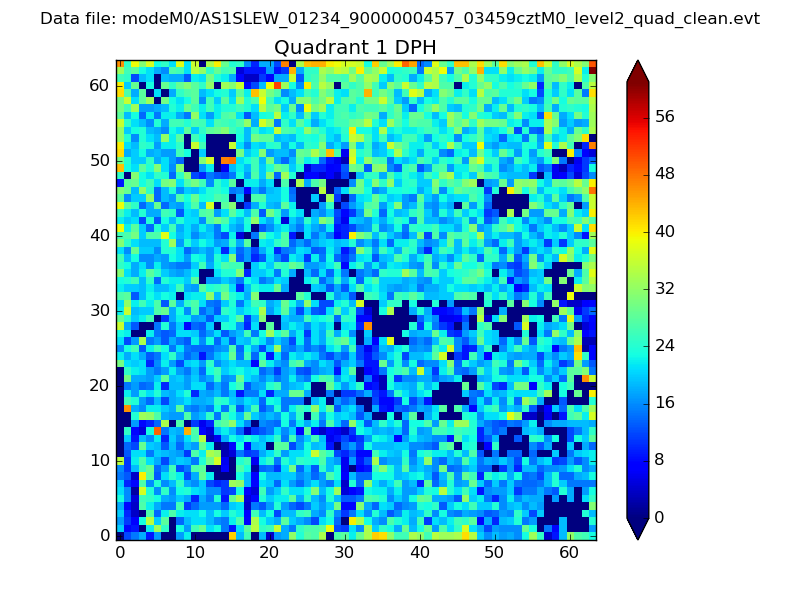
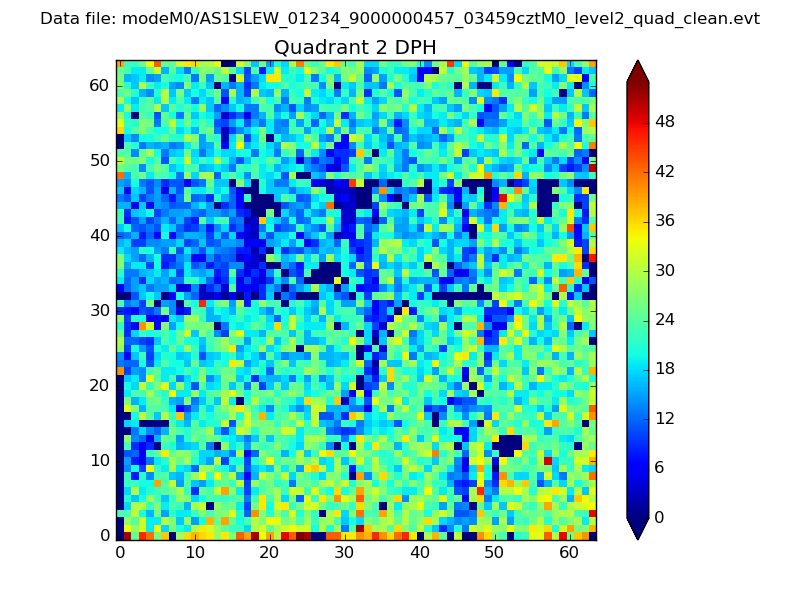
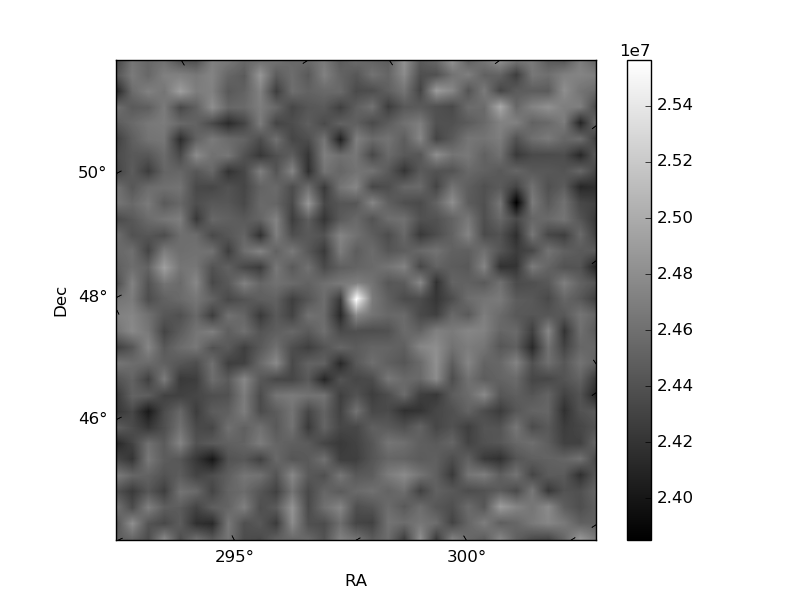
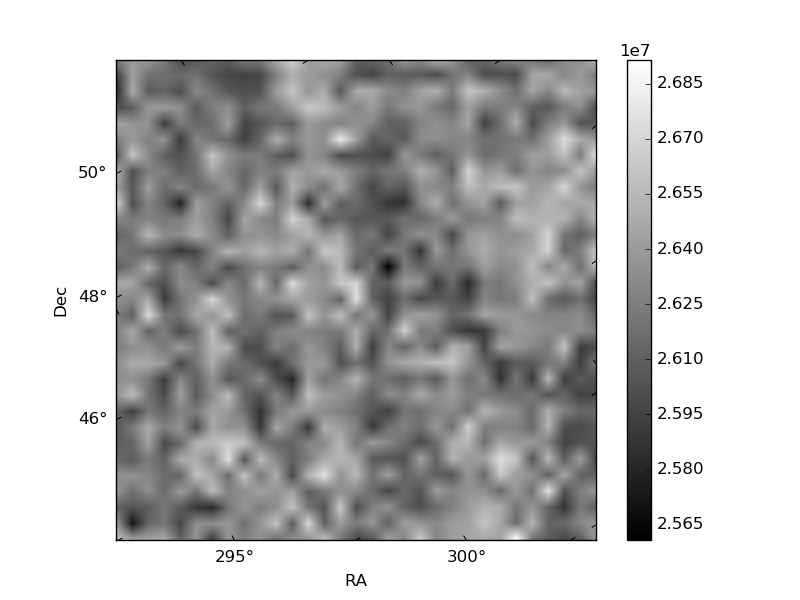
Histogram calculated using DETX and DETY for each event in the final _common_clean file
| Quadrant A | 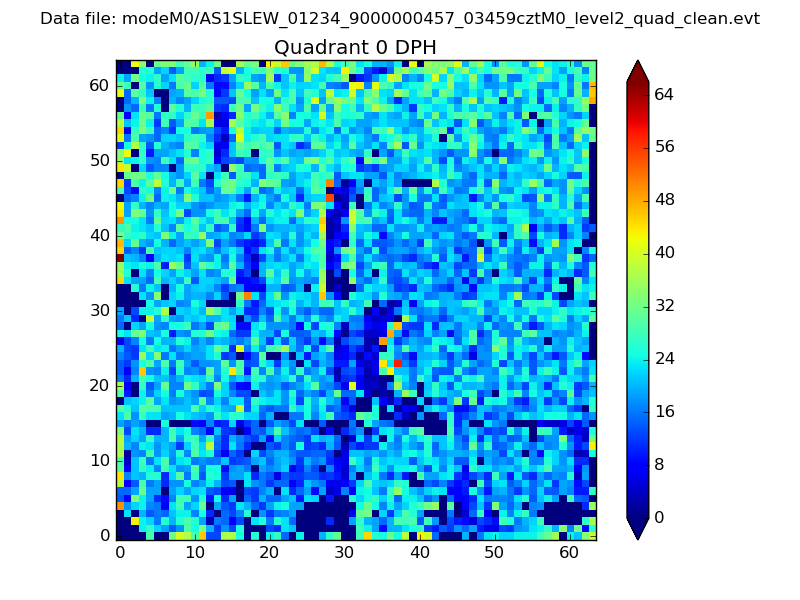 |
 |
Quadrant B |
|---|---|---|---|
| Quadrant D | 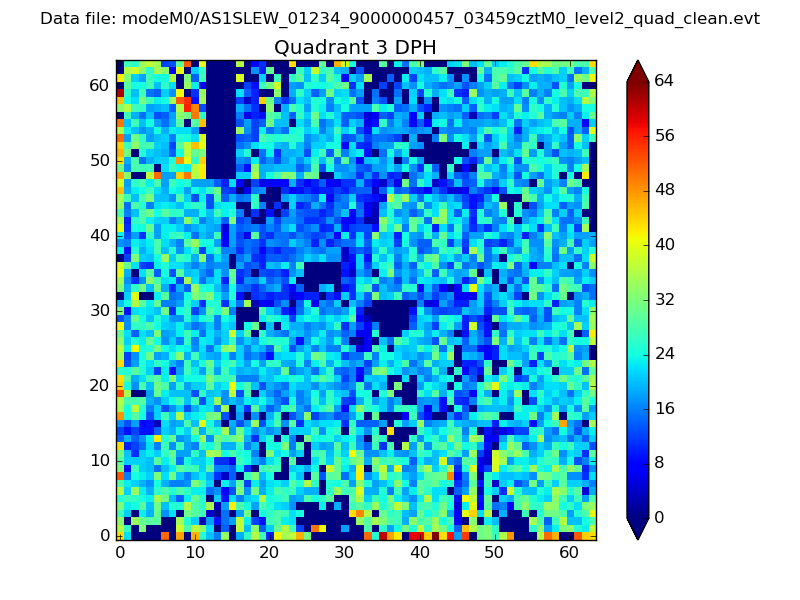 |
 |
Quadrant C |
| Plot type | Count rate plots | Images |
|---|---|---|
| Comparison with Poisson distribution Blue bars denote a histogram of data divided into 1 sec bins. Red curve is a Poisson curve with rate = median count rate of data. |
 |
 |
| Quadrant-wise count rates Data is divided into 100 sec bins |
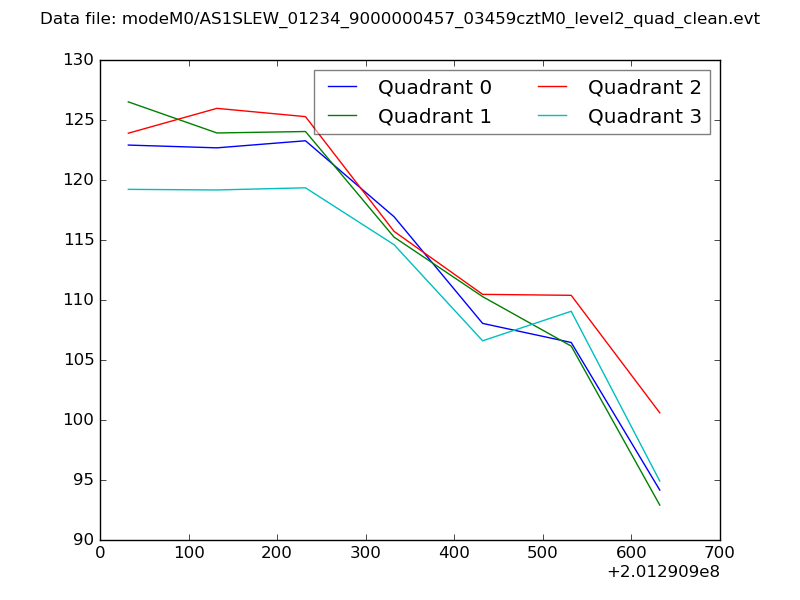 |
|
| Module-wise count rates for Quadrant A Data is divided into 100 sec bins |
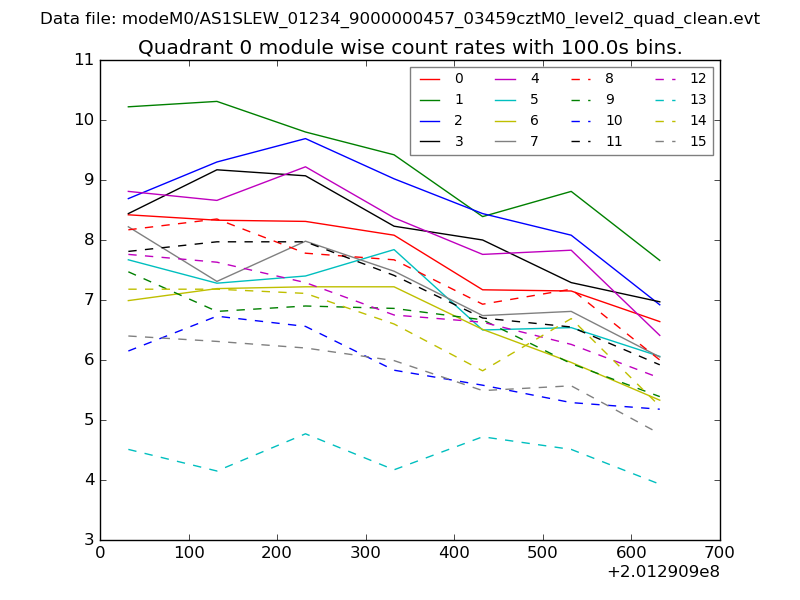 |
 |
| Module-wise count rates for Quadrant B Data is divided into 100 sec bins |
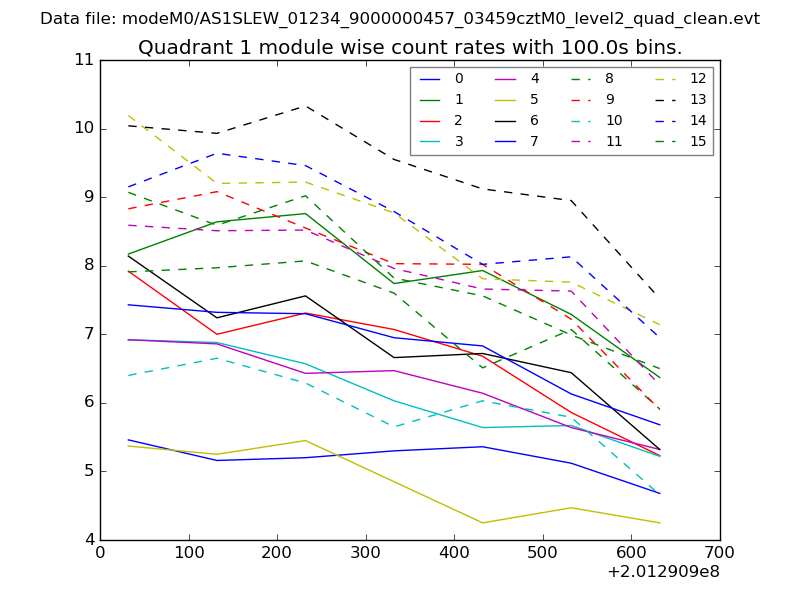 |
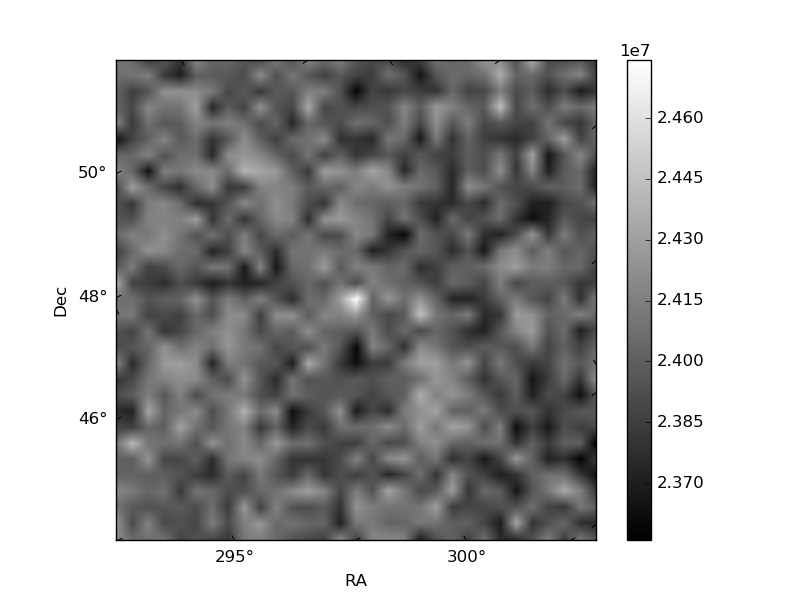 |
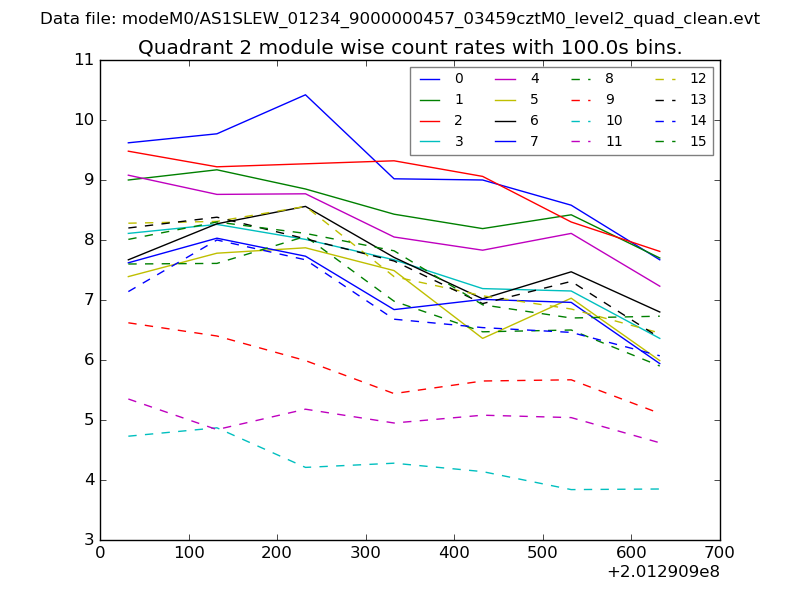
| Module-wise count rates for Quadrant C Data is divided into 100 sec bins |
 |
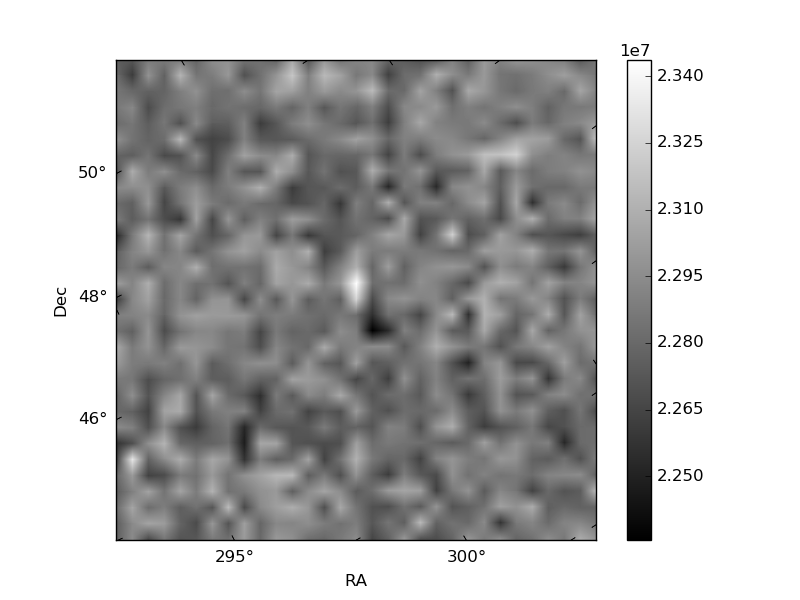 |
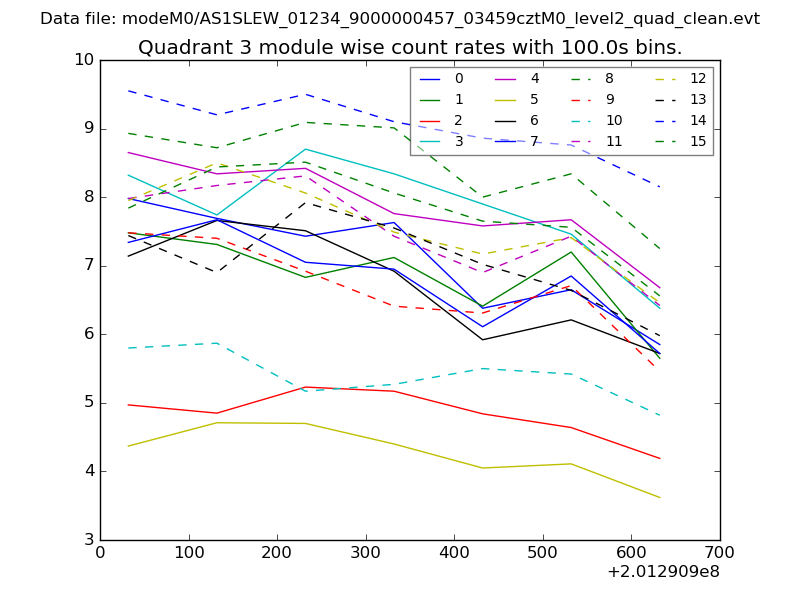
| Module-wise count rates for Quadrant D Data is divided into 100 sec bins |
 |
 |
| Parameter | Plot |
|---|---|
| CZT HV Monitor | 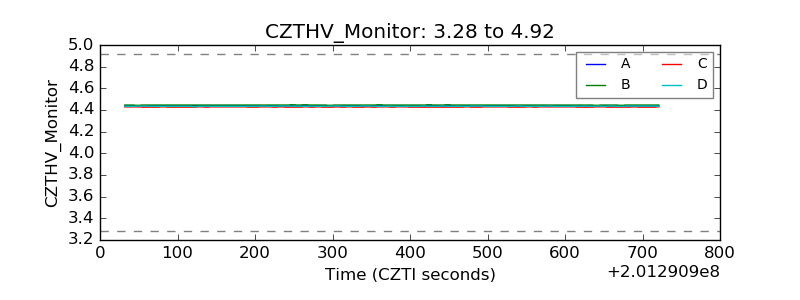 |
| D_VDD | 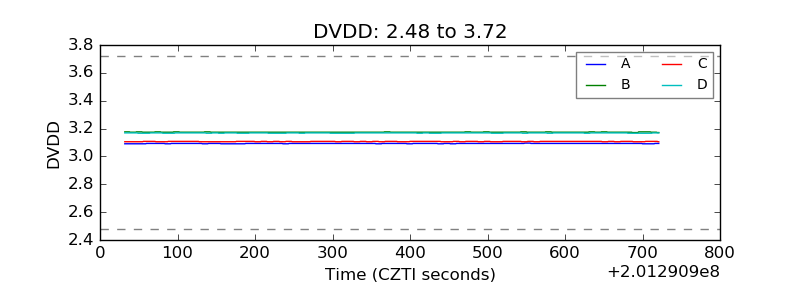 |
| Temperature 1 | 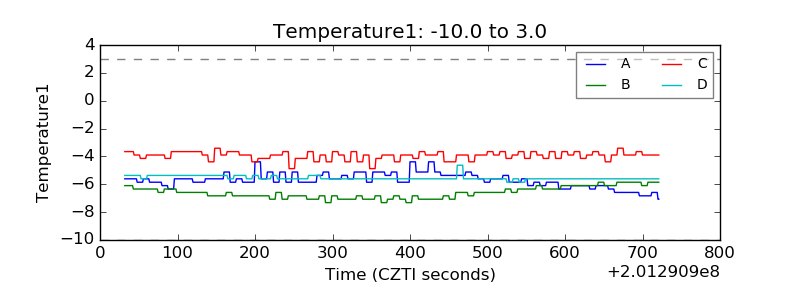 |
| Veto HV Monitor | 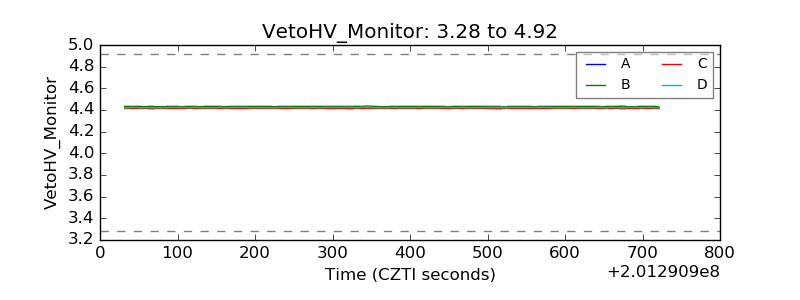 |
| Veto LLD | 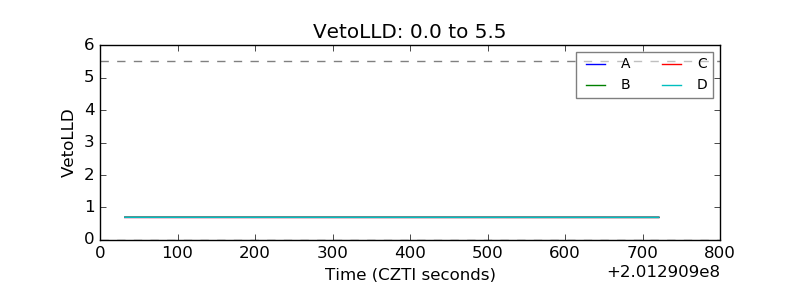 |
| Alpha Counter | 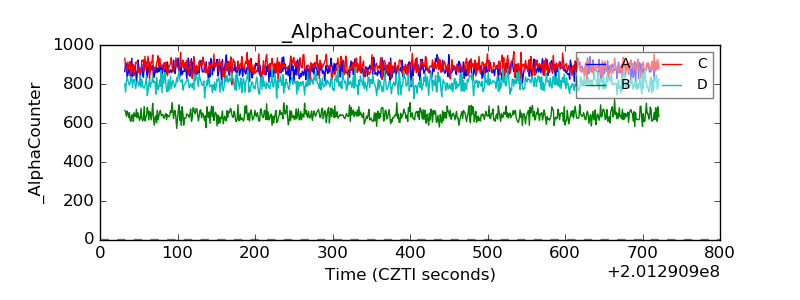 |
| _CPM_Rate | 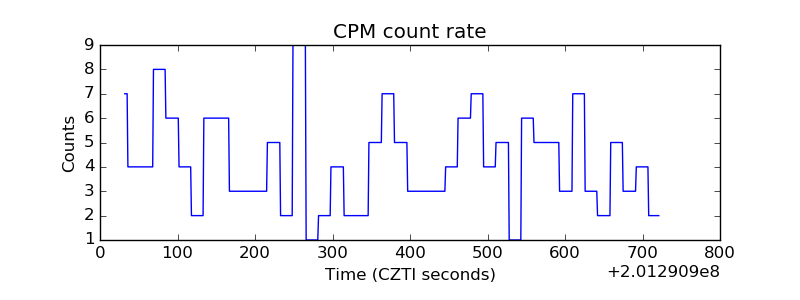 |
| CZT Counter | 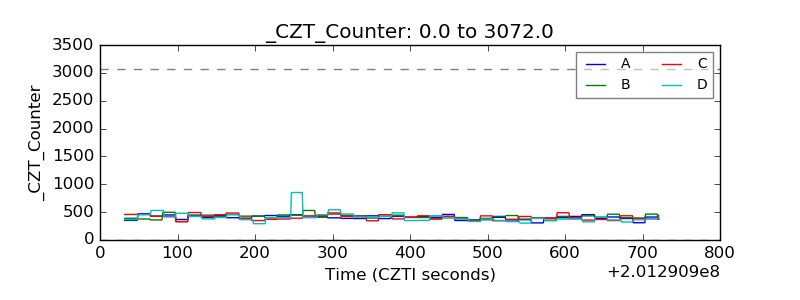 |
| +2.5 Volts monitor |  |
| +5 Volts monitor |  |
| Veto Counter | 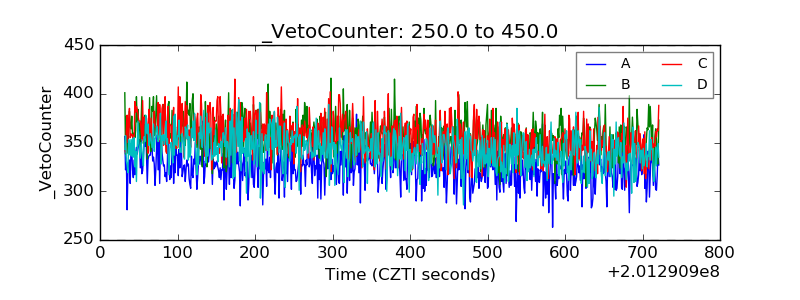 |