| Param | Original file | Final file |
|---|---|---|
| Filename | modeM0/AS1G05_083T03_9000000462cztM0_level2.fits | modeM0/AS1G05_083T03_9000000462cztM0_level2_quad_clean.evt |
| Size (bytes) | 173,736,000 | 131,607,360 |
| Size | 165.7 MB | 125.5 MB |
| Events in quadrant A | 1,027,760 | 673,084 |
| Events in quadrant B | 1,020,014 | 707,357 |
| Events in quadrant C | 1,050,290 | 702,809 |
| Events in quadrant D | 913,278 | 651,158 |
| Mode SS | |||
|---|---|---|---|
| Quadrant | BADHDUFLAG | Total packets | Discarded packets |
| A | 0 | 370 | 0 |
| B | 0 | 370 | 0 |
| C | 0 | 370 | 0 |
| D | 0 | 370 | 0 |
| Mode M0 | |||
|---|---|---|---|
| Quadrant | BADHDUFLAG | Total packets | Discarded packets |
| A | 0 | 45963 | 0 |
| B | 0 | 40784 | 0 |
| C | 0 | 39999 | 0 |
| D | 0 | 38310 | 0 |
| Mode M9 | |||
|---|---|---|---|
| Quadrant | BADHDUFLAG | Total packets | Discarded packets |
| A | 0 | 50 | 0 |
| B | 0 | 50 | 0 |
| C | 0 | 50 | 0 |
| D | 0 | 50 | 0 |
| Quadrant | Total seconds | Saturated seconds | Saturation percentage |
|---|---|---|---|
| A | 18141 | 770 | 4.244529% |
| B | 18141 | 276 | 1.521416% |
| C | 18141 | 397 | 2.188413% |
| D | 18141 | 231 | 1.273359% |
Noise dominated data is calculated using 1-second bins in cleaned event files. If a bin has >2000 counts, and if more than 50% of those come from <1% of pixels, then it is considered to be noise-dominated and hence unusable.
| Quadrant | # 1 sec bins | Bins with >0 counts | Bins with >2000 counts | High rate bins dominated by noise | Noise dominated (total time) | Noise dominated (detector-on time) | Marked lightcurve |
|---|---|---|---|---|---|---|---|
| A | 27724 | 18139 | 0 | 0 | 0.00% | 0.00% |  |
| B | 27724 | 18140 | 0 | 0 | 0.00% | 0.00% |  |
| C | 27724 | 18133 | 0 | 0 | 0.00% | 0.00% |  |
| D | 27724 | 18140 | 0 | 0 | 0.00% | 0.00% |  |
Top three noisy pixels from each quadrant. If the there are fewer than three noisy pixels in the level2.evt file, extra rows are filled as -1
| Pixel properties | Quadrant properties | ||||||
|---|---|---|---|---|---|---|---|
| Quadrant | DetID | PixID | Counts | Sigma | Mean | Median | Sigma |
| A | 0 | 29 | 973 | 10.22 | 268 | 250 | 70.7 |
| A | 7 | 110 | 853 | 8.52 | 268 | 250 | 70.7 |
| A | 0 | 30 | 810 | 7.91 | 268 | 250 | 70.7 |
| B | 2 | 9 | 870 | 10.9 | 269 | 256 | 56.3 |
| B | 5 | 128 | 756 | 8.88 | 269 | 256 | 56.3 |
| B | 12 | 226 | 738 | 8.56 | 269 | 256 | 56.3 |
| C | 9 | 188 | 737 | 6.33 | 277 | 259 | 75.5 |
| C | 3 | 158 | 731 | 6.25 | 277 | 259 | 75.5 |
| C | 1 | 81 | 711 | 5.98 | 277 | 259 | 75.5 |
| D | 3 | 14 | 699 | 6.57 | 260 | 237 | 70.3 |
| D | 7 | 3 | 668 | 6.13 | 260 | 237 | 70.3 |
| D | 7 | 5 | 661 | 6.03 | 260 | 237 | 70.3 |
Histogram calculated using DETX and DETY for each event in the final _common_clean file
| Quadrant A |  |
 |
Quadrant B |
|---|---|---|---|
| Quadrant D |  |
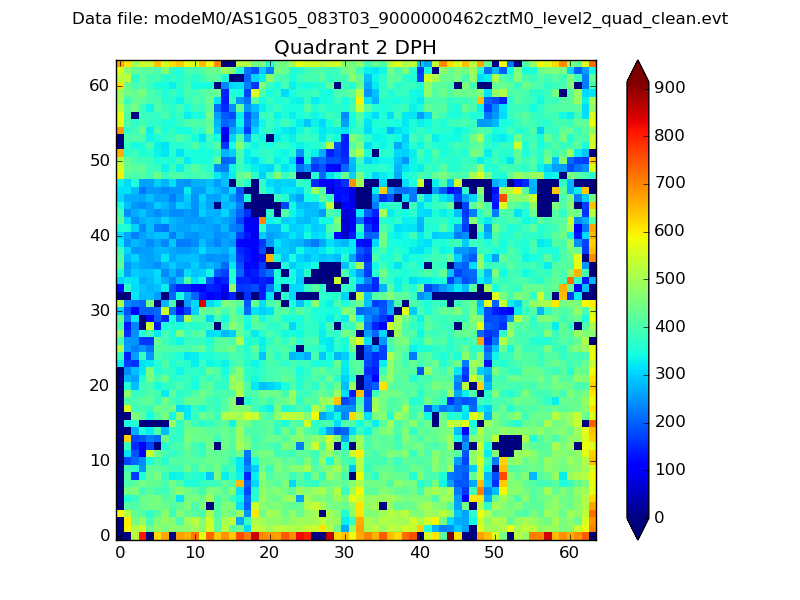 |
Quadrant C |
| Plot type | Count rate plots | Images |
|---|---|---|
| Comparison with Poisson distribution Blue bars denote a histogram of data divided into 1 sec bins. Red curve is a Poisson curve with rate = median count rate of data. |
 |
 |
| Quadrant-wise count rates Data is divided into 100 sec bins |
 |
|
| Module-wise count rates for Quadrant A Data is divided into 100 sec bins |
 |
 |
| Module-wise count rates for Quadrant B Data is divided into 100 sec bins |
 |
 |
| Module-wise count rates for Quadrant C Data is divided into 100 sec bins |
 |
 |
| Module-wise count rates for Quadrant D Data is divided into 100 sec bins |
 |
 |
| Parameter | Plot |
|---|---|
| CZT HV Monitor |  |
| D_VDD | 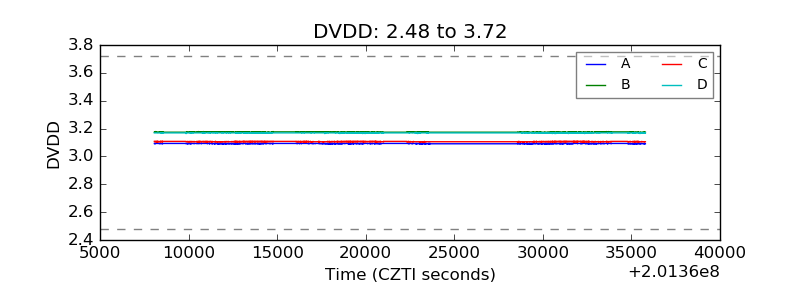 |
| Temperature 1 |  |
| Veto HV Monitor |  |
| Veto LLD |  |
| Alpha Counter |  |
| _CPM_Rate |  |
| CZT Counter |  |
| +2.5 Volts monitor |  |
| +5 Volts monitor |  |
| _ROLL_ROT |  |
| _Roll_DEC |  |
| _Roll_RA |  |
| Veto Counter |  |