| Param | Original file | Final file |
|---|---|---|
| Filename | modeM0/AS1G05_083T03_9000000462_03476cztM0_level2.evt | modeM0/AS1G05_083T03_9000000462_03476cztM0_level2_quad_clean.evt |
| Size (bytes) | 486,132,480 | 73,434,240 |
| Size | 463.6 MB | 70.0 MB |
| Events in quadrant A | 4,856,155 | 425,873 |
| Events in quadrant B | 3,276,103 | 451,911 |
| Events in quadrant C | 3,413,200 | 457,256 |
| Events in quadrant D | 2,746,707 | 446,005 |
| Mode SS | |||
|---|---|---|---|
| Quadrant | BADHDUFLAG | Total packets | Discarded packets |
| A | 0 | 128 | 0 |
| B | 0 | 128 | 0 |
| C | 0 | 128 | 0 |
| D | 0 | 128 | 0 |
| Mode M0 | |||
|---|---|---|---|
| Quadrant | BADHDUFLAG | Total packets | Discarded packets |
| A | 0 | 18902 | 2 |
| B | 0 | 14054 | 2 |
| C | 0 | 14739 | 2 |
| D | 0 | 13110 | 2 |
| Mode M9 | |||
|---|---|---|---|
| Quadrant | BADHDUFLAG | Total packets | Discarded packets |
| A | 0 | 12 | 0 |
| B | 0 | 12 | 0 |
| C | 0 | 12 | 0 |
| D | 0 | 12 | 0 |
| Quadrant | Total seconds | Saturated seconds | Saturation percentage |
|---|---|---|---|
| A | 6340 | 437 | 6.892744% |
| B | 6340 | 38 | 0.599369% |
| C | 6340 | 144 | 2.271293% |
| D | 6340 | 18 | 0.283912% |
Noise dominated data is calculated using 1-second bins in cleaned event files. If a bin has >2000 counts, and if more than 50% of those come from <1% of pixels, then it is considered to be noise-dominated and hence unusable.
| Quadrant | # 1 sec bins | Bins with >0 counts | Bins with >2000 counts | High rate bins dominated by noise | Noise dominated (total time) | Noise dominated (detector-on time) | Marked lightcurve |
|---|---|---|---|---|---|---|---|
| A | 7225 | 6341 | 232 | 232 | 3.21% | 3.66% | 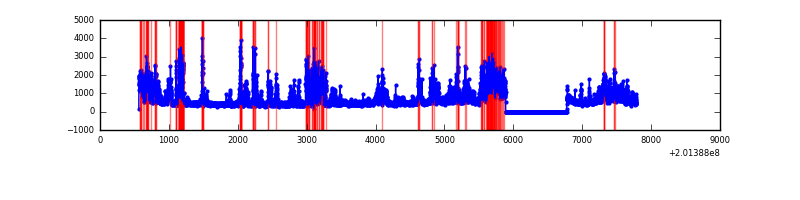 |
| B | 7225 | 6341 | 3 | 3 | 0.04% | 0.05% | 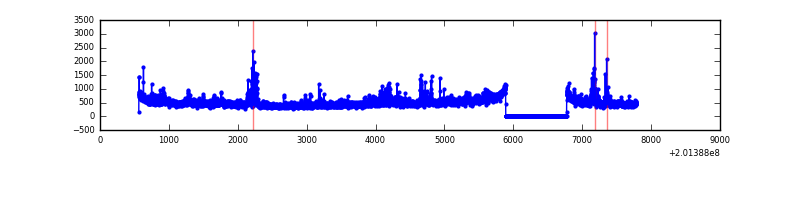 |
| C | 7225 | 6341 | 89 | 89 | 1.23% | 1.40% |  |
| D | 7225 | 6341 | 6 | 6 | 0.08% | 0.09% | 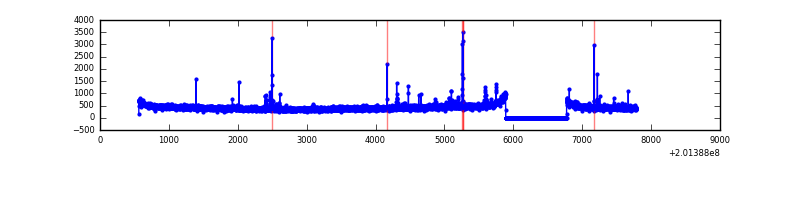 |
Top three noisy pixels from each quadrant. If the there are fewer than three noisy pixels in the level2.evt file, extra rows are filled as -1
| Pixel properties | Quadrant properties | ||||||
|---|---|---|---|---|---|---|---|
| Quadrant | DetID | PixID | Counts | Sigma | Mean | Median | Sigma |
| A | 0 | 118 | 1425547 | 9853.13 | 703 | 687 | 144.6 |
| A | 0 | 50 | 533731 | 3686.08 | 703 | 687 | 144.6 |
| A | 0 | 226 | 137198 | 943.99 | 703 | 687 | 144.6 |
| B | 15 | 204 | 234946 | 1645.33 | 732 | 715 | 142.4 |
| B | 2 | 249 | 125820 | 878.79 | 732 | 715 | 142.4 |
| B | 4 | 200 | 37467 | 258.16 | 732 | 715 | 142.4 |
| C | 7 | 220 | 634900 | 3827.02 | 706 | 709 | 165.7 |
| C | 1 | 192 | 6594 | 35.51 | 706 | 709 | 165.7 |
| C | 13 | 61 | 5955 | 31.66 | 706 | 709 | 165.7 |
| D | 13 | 223 | 21084 | 121.13 | 703 | 683 | 168.4 |
| D | 13 | 239 | 17342 | 98.91 | 703 | 683 | 168.4 |
| D | 2 | 206 | 13074 | 73.57 | 703 | 683 | 168.4 |
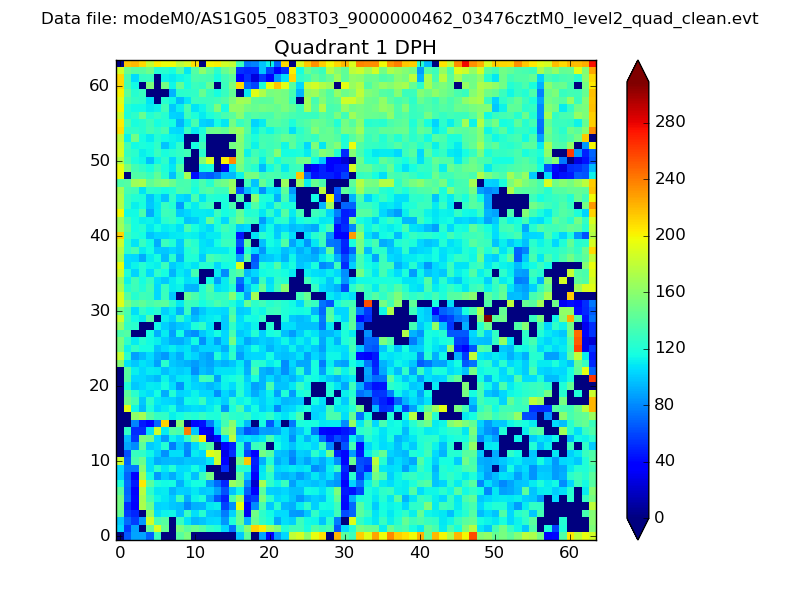
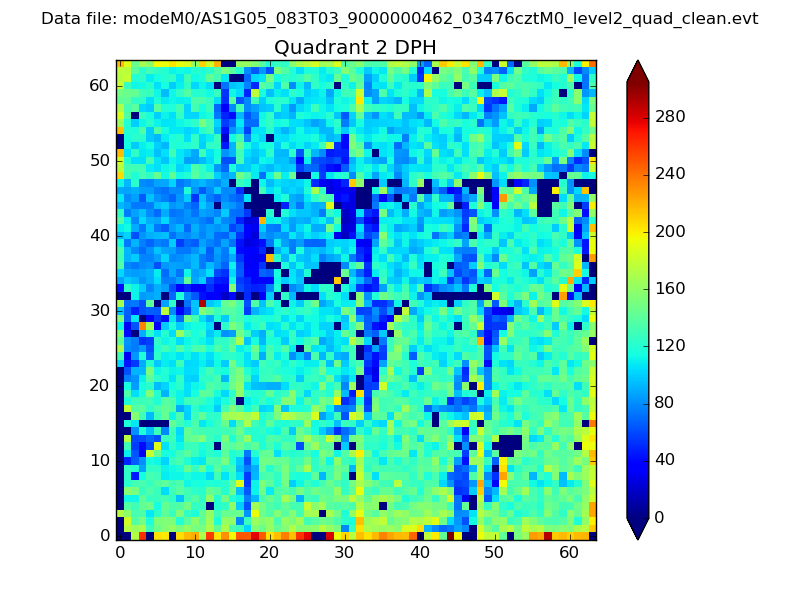
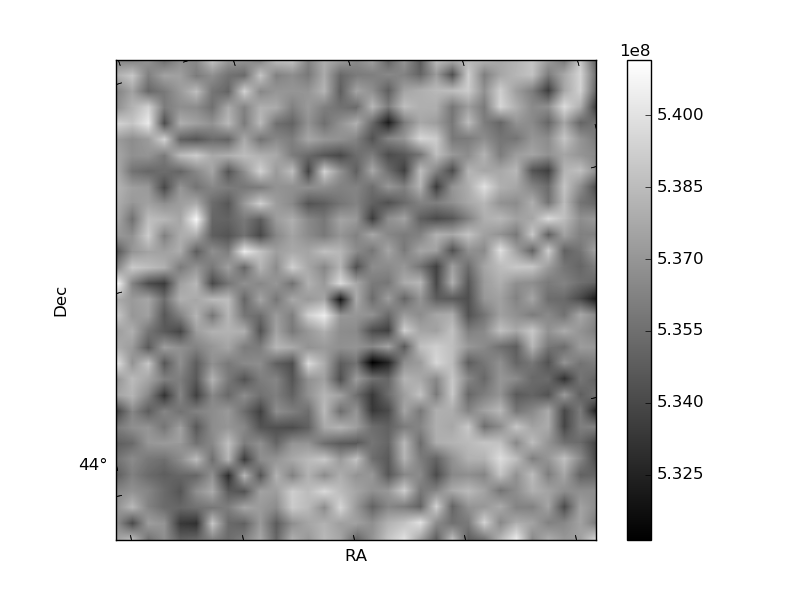
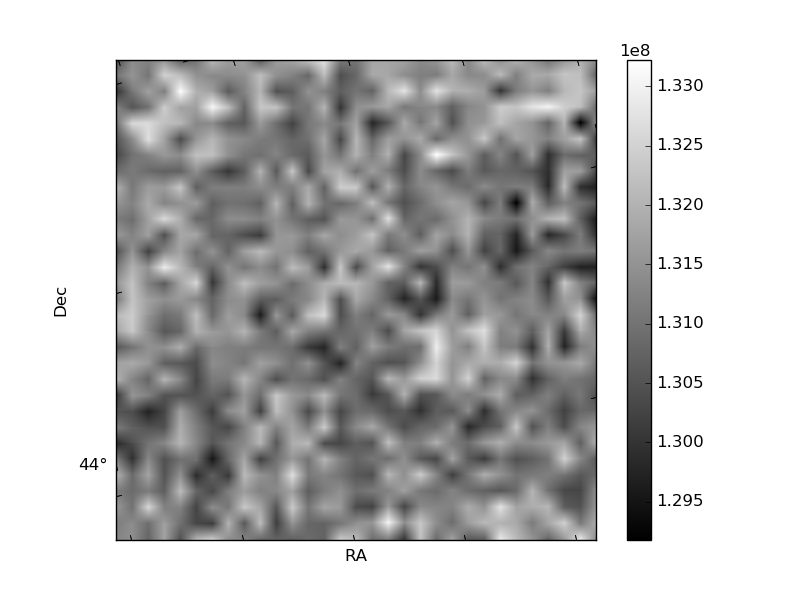
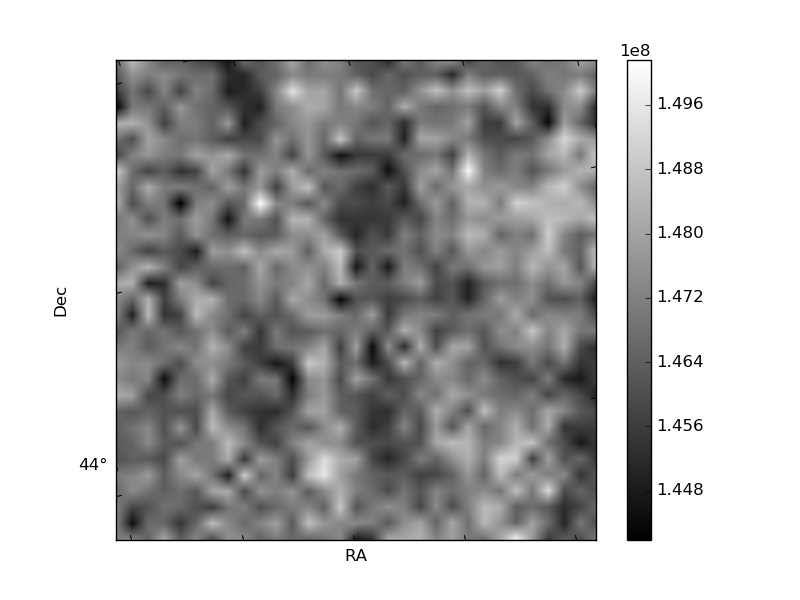
Histogram calculated using DETX and DETY for each event in the final _common_clean file
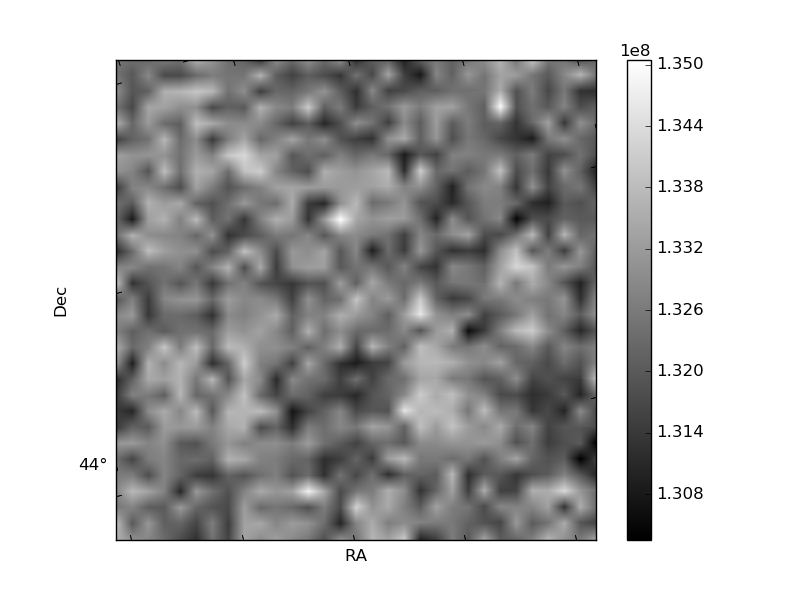
| Quadrant A | 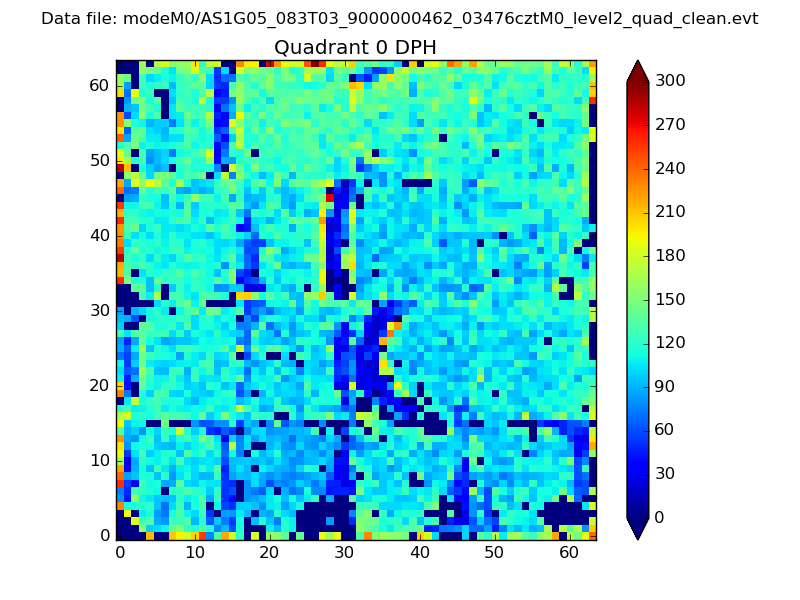 |
 |
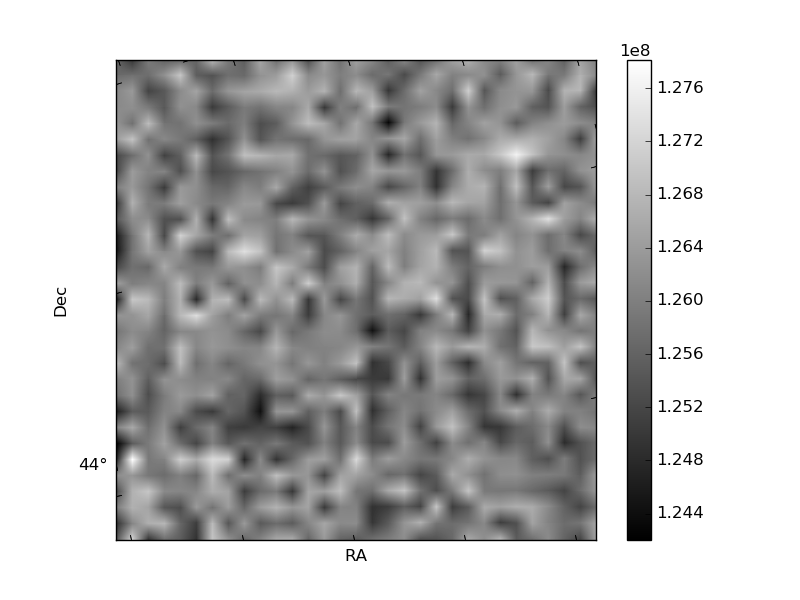
Quadrant B |
|---|---|---|---|
| Quadrant D | 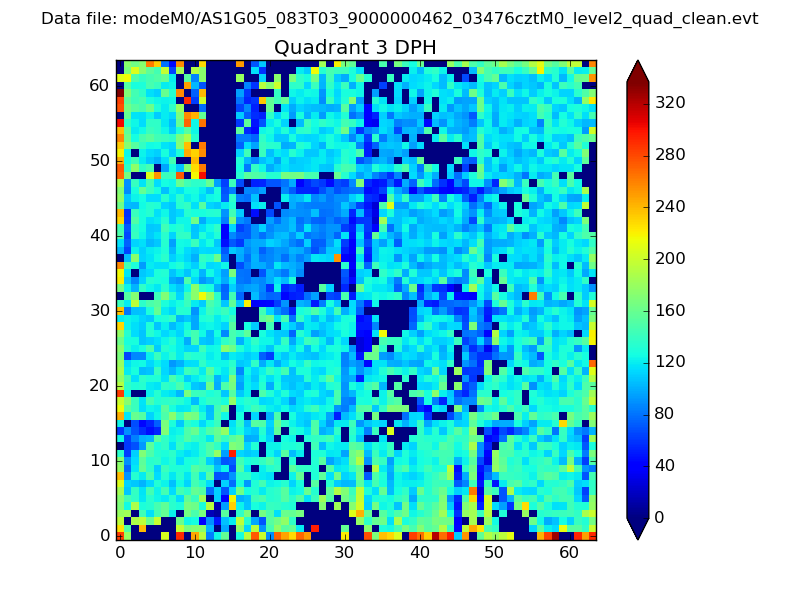 |
 |
Quadrant C |
| Plot type | Count rate plots | Images |
|---|---|---|
| Comparison with Poisson distribution Blue bars denote a histogram of data divided into 1 sec bins. Red curve is a Poisson curve with rate = median count rate of data. |
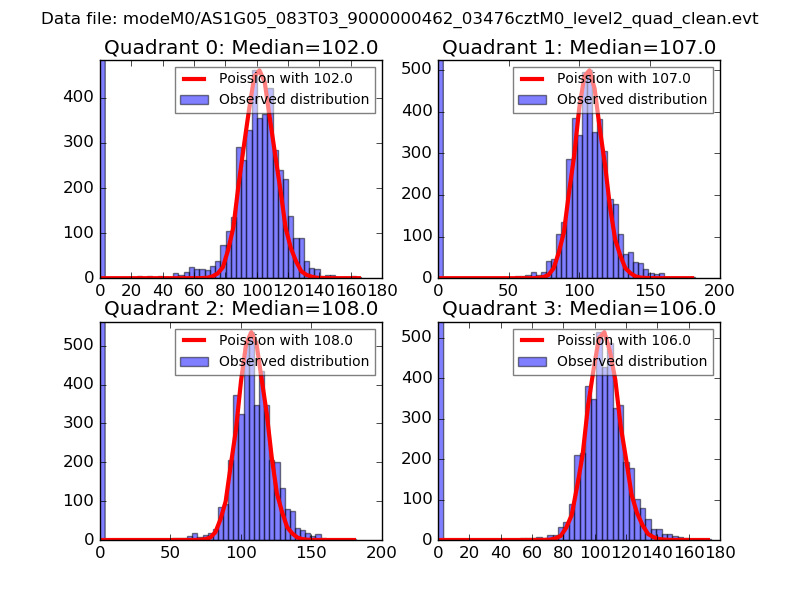 |
 |
| Quadrant-wise count rates Data is divided into 100 sec bins |
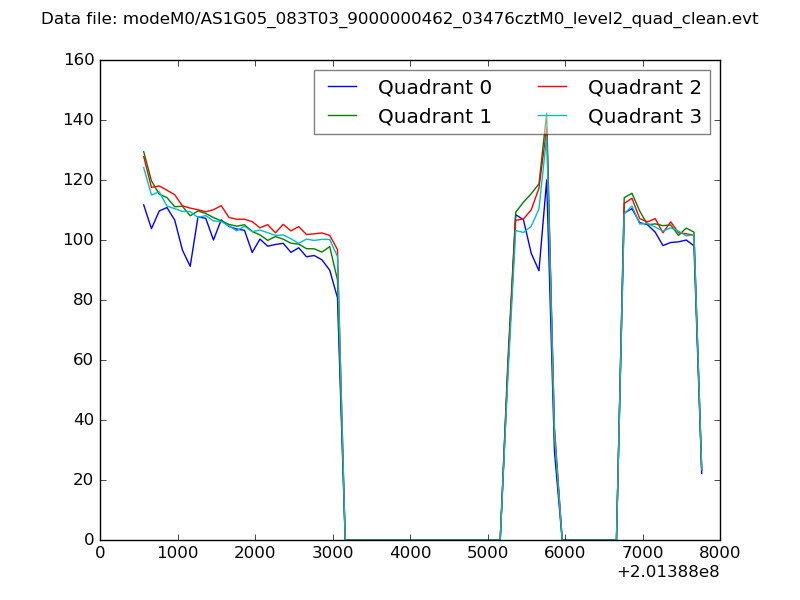 |
|
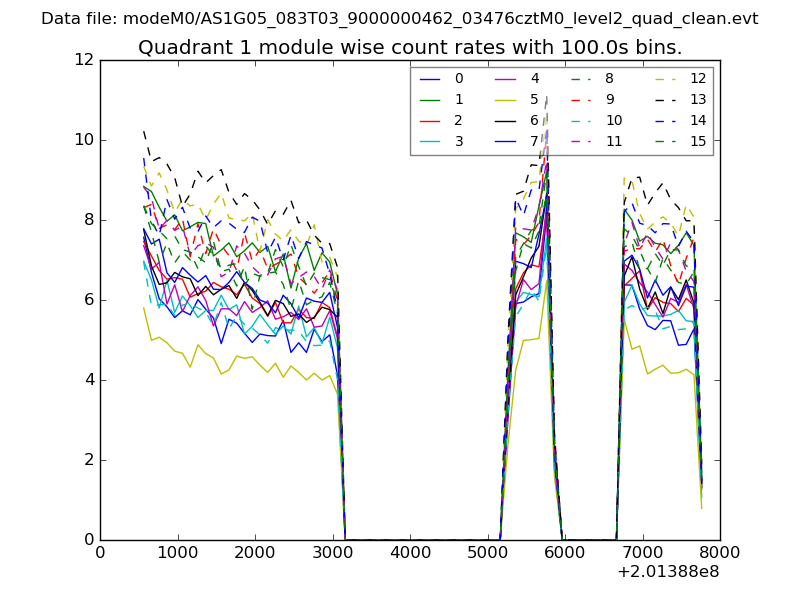
| Module-wise count rates for Quadrant A Data is divided into 100 sec bins |
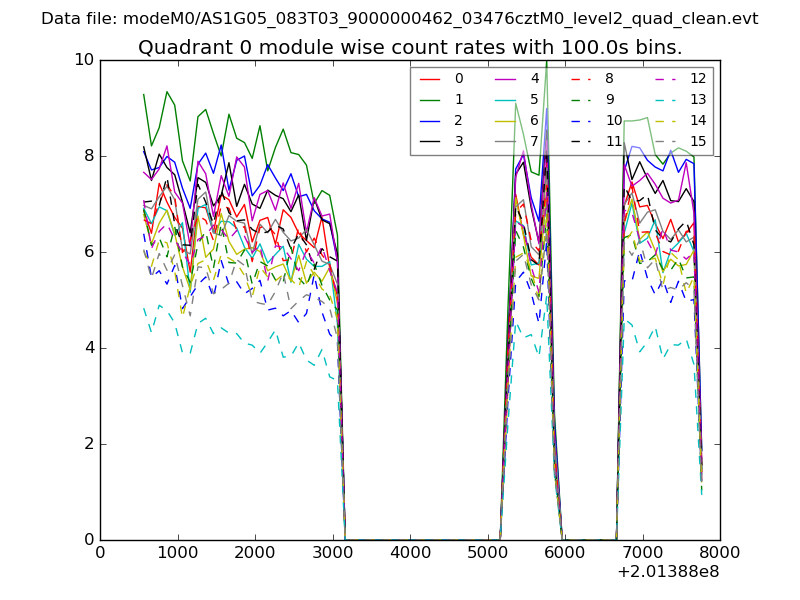 |
 |
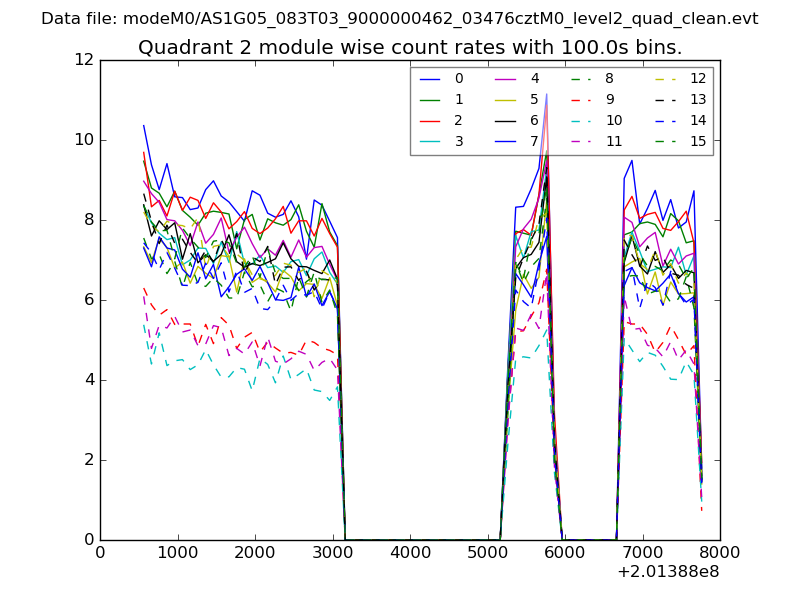
| Module-wise count rates for Quadrant B Data is divided into 100 sec bins |
 |
 |
| Module-wise count rates for Quadrant C Data is divided into 100 sec bins |
 |
 |
| Module-wise count rates for Quadrant D Data is divided into 100 sec bins |
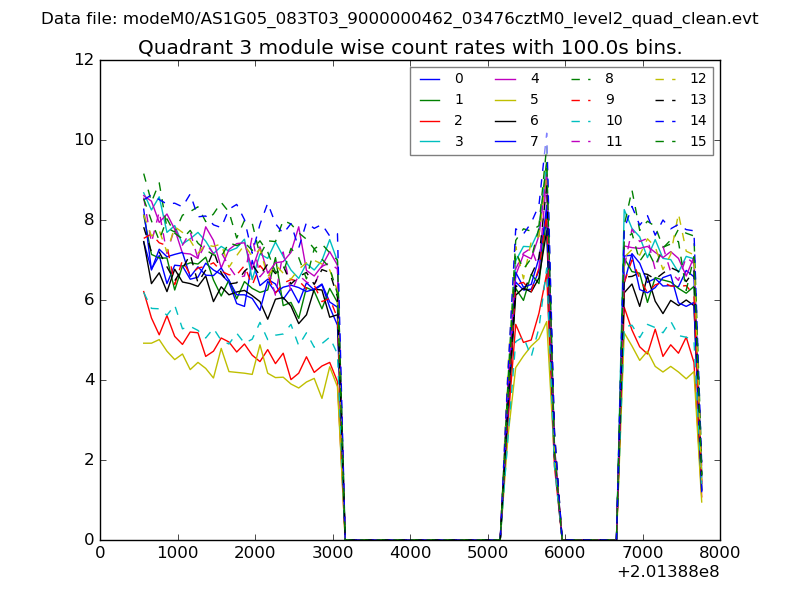 |
 |
| Parameter | Plot |
|---|---|
| CZT HV Monitor | 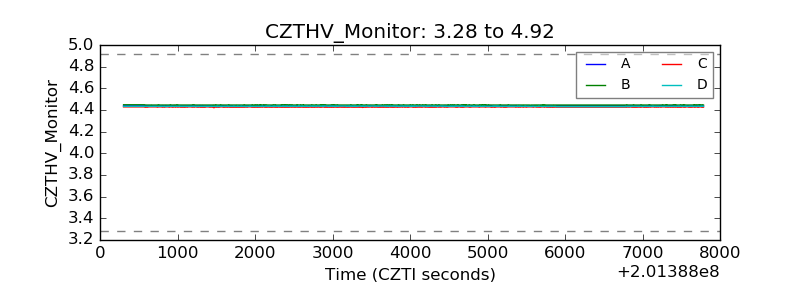 |
| D_VDD | 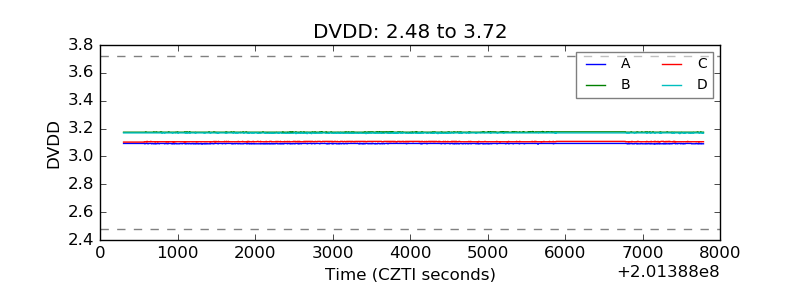 |
| Temperature 1 | 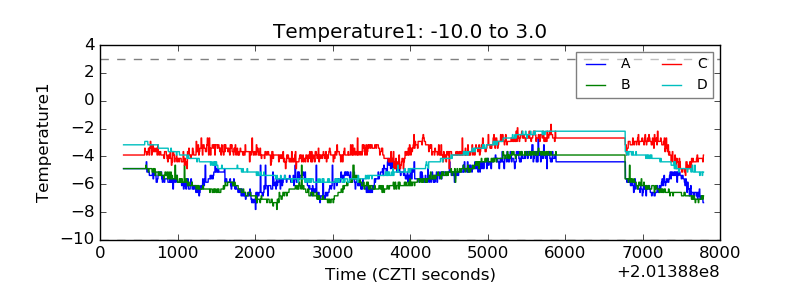 |
| Veto HV Monitor | 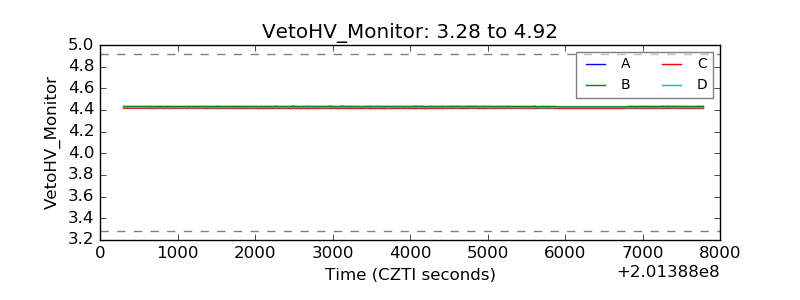 |
| Veto LLD | 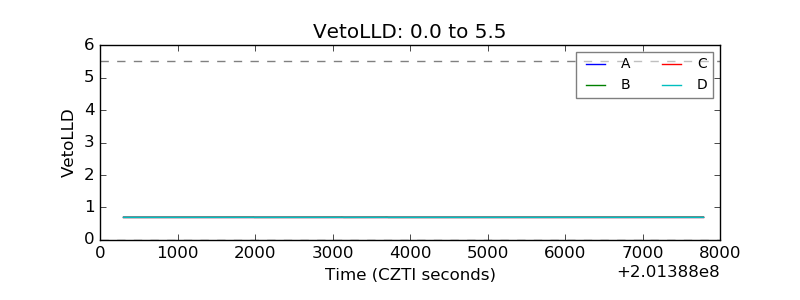 |
| Alpha Counter | 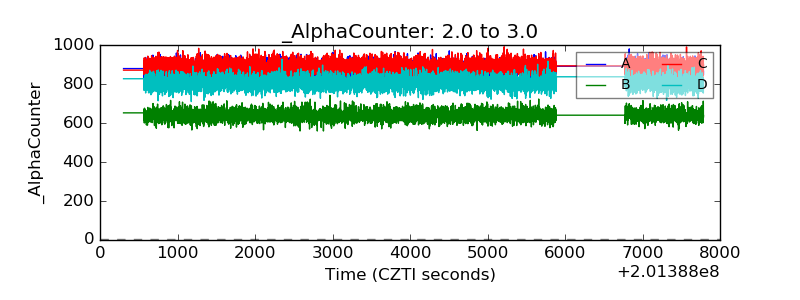 |
| _CPM_Rate | 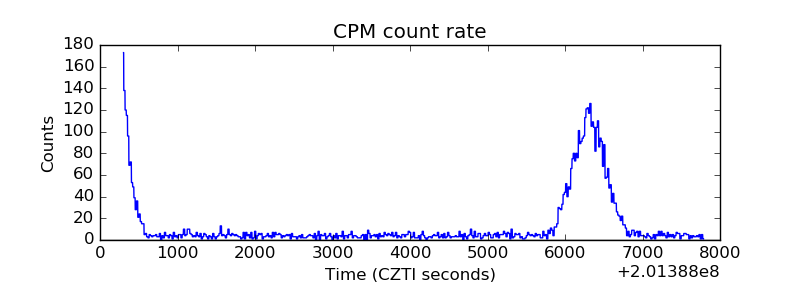 |
| CZT Counter | 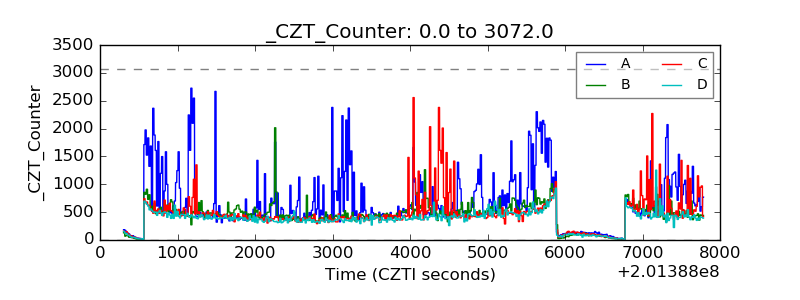 |
| +2.5 Volts monitor |  |
| +5 Volts monitor |  |
| Veto Counter | 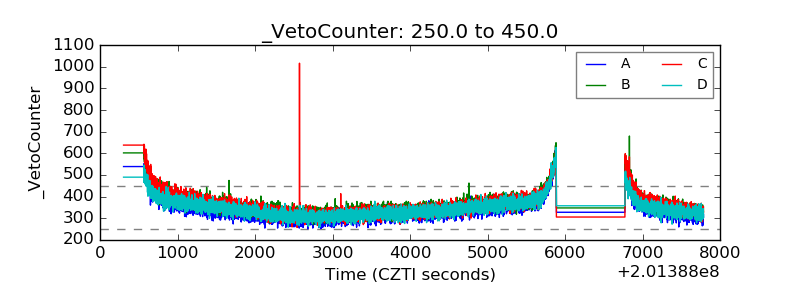 |