| Param | Original file | Final file |
|---|---|---|
| Filename | modeM0/AS1G05_211T01_9000000464cztM0_level2.fits | modeM0/AS1G05_211T01_9000000464cztM0_level2_quad_clean.evt |
| Size (bytes) | 996,298,560 | 1,027,296,000 |
| Size | 950.1 MB | 979.7 MB |
| Events in quadrant A | 5,899,886 | 6,114,227 |
| Events in quadrant B | 5,727,650 | 6,120,381 |
| Events in quadrant C | 5,685,996 | 5,658,356 |
| Events in quadrant D | 5,078,636 | 5,444,241 |
| Mode M9 | |||
|---|---|---|---|
| Quadrant | BADHDUFLAG | Total packets | Discarded packets |
| A | 0 | 131 | 0 |
| B | 0 | 131 | 0 |
| C | 0 | 131 | 0 |
| D | 0 | 131 | 0 |
| Mode M0 | |||
|---|---|---|---|
| Quadrant | BADHDUFLAG | Total packets | Discarded packets |
| A | 0 | 259834 | 0 |
| B | 0 | 256600 | 0 |
| C | 0 | 297067 | 0 |
| D | 0 | 241029 | 0 |
| Mode SS | |||
|---|---|---|---|
| Quadrant | BADHDUFLAG | Total packets | Discarded packets |
| A | 0 | 2304 | 0 |
| B | 0 | 2304 | 0 |
| C | 0 | 2304 | 0 |
| D | 0 | 2304 | 0 |
| Quadrant | Total seconds | Saturated seconds | Saturation percentage |
|---|---|---|---|
| A | 113448 | 3246 | 2.861223% |
| B | 113448 | 2463 | 2.171039% |
| C | 113448 | 7067 | 6.229286% |
| D | 113447 | 1723 | 1.518771% |
Noise dominated data is calculated using 1-second bins in cleaned event files. If a bin has >2000 counts, and if more than 50% of those come from <1% of pixels, then it is considered to be noise-dominated and hence unusable.
| Quadrant | # 1 sec bins | Bins with >0 counts | Bins with >2000 counts | High rate bins dominated by noise | Noise dominated (total time) | Noise dominated (detector-on time) | Marked lightcurve |
|---|---|---|---|---|---|---|---|
| A | 126713 | 113435 | 0 | 0 | 0.00% | 0.00% |  |
| B | 126713 | 113439 | 0 | 0 | 0.00% | 0.00% | 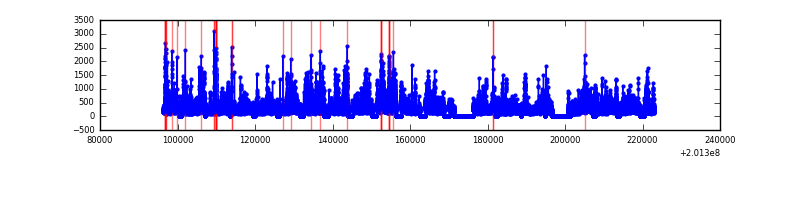 |
| C | 126713 | 113007 | 0 | 0 | 0.00% | 0.00% | 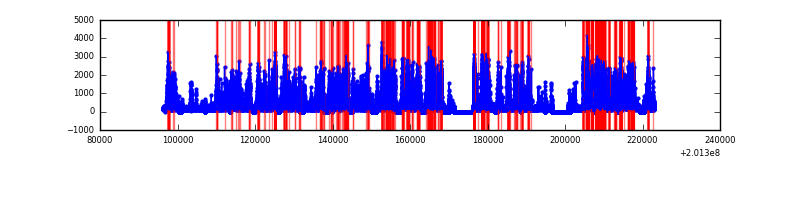 |
| D | 126713 | 113412 | 0 | 0 | 0.00% | 0.00% |  |
Top three noisy pixels from each quadrant. If the there are fewer than three noisy pixels in the level2.evt file, extra rows are filled as -1
| Pixel properties | Quadrant properties | ||||||
|---|---|---|---|---|---|---|---|
| Quadrant | DetID | PixID | Counts | Sigma | Mean | Median | Sigma |
| A | 0 | 29 | 5814 | 10.96 | 1533 | 1421 | 400.7 |
| A | 14 | 188 | 5630 | 10.51 | 1533 | 1421 | 400.7 |
| A | 7 | 110 | 5120 | 9.23 | 1533 | 1421 | 400.7 |
| B | 2 | 9 | 4925 | 11.24 | 1513 | 1429 | 311.0 |
| B | 12 | 226 | 4213 | 8.95 | 1513 | 1429 | 311.0 |
| B | 14 | 254 | 3901 | 7.95 | 1513 | 1429 | 311.0 |
| C | 1 | 80 | 4149 | 6.94 | 1503 | 1382 | 399.0 |
| C | 1 | 81 | 4056 | 6.7 | 1503 | 1382 | 399.0 |
| C | 12 | 241 | 3954 | 6.45 | 1503 | 1382 | 399.0 |
| D | 11 | 82 | 4553 | 8.32 | 1451 | 1312 | 389.5 |
| D | 6 | 231 | 3821 | 6.44 | 1451 | 1312 | 389.5 |
| D | 3 | 14 | 3757 | 6.28 | 1451 | 1312 | 389.5 |
Histogram calculated using DETX and DETY for each event in the final _common_clean file
| Quadrant A | 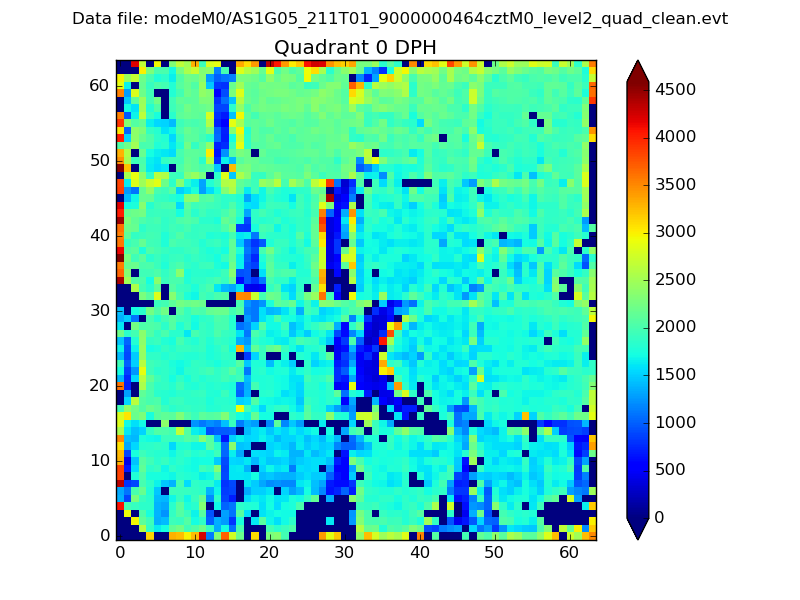 |
 |
Quadrant B |
|---|---|---|---|
| Quadrant D | 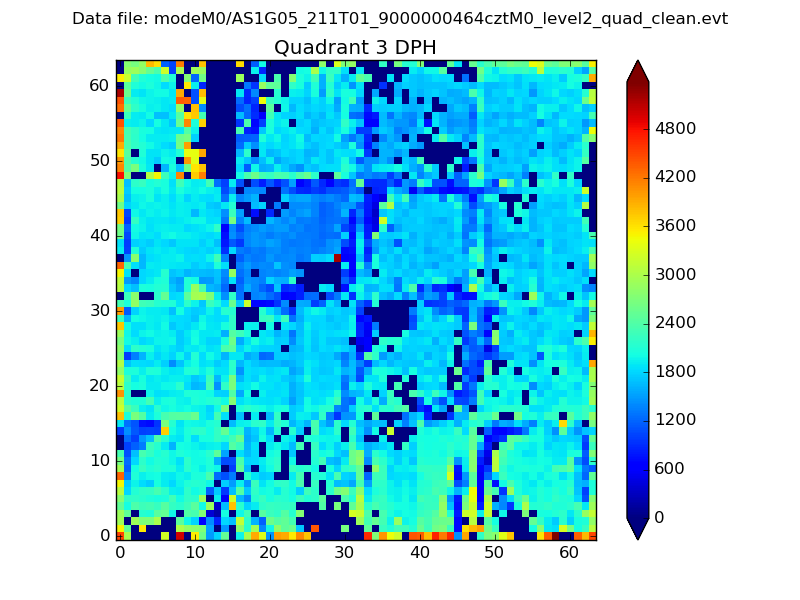 |
 |
Quadrant C |
| Plot type | Count rate plots | Images |
|---|---|---|
| Comparison with Poisson distribution Blue bars denote a histogram of data divided into 1 sec bins. Red curve is a Poisson curve with rate = median count rate of data. |
 |
 |
| Quadrant-wise count rates Data is divided into 100 sec bins |
 |
|
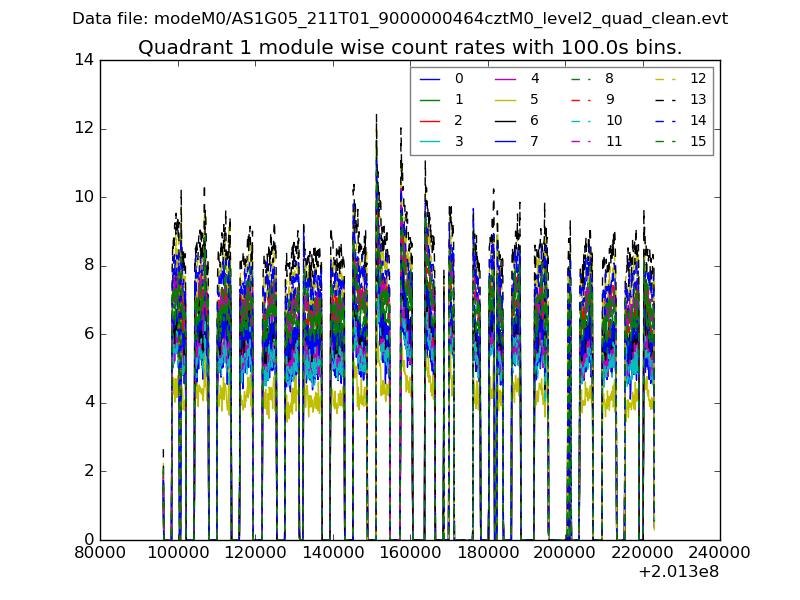
| Module-wise count rates for Quadrant A Data is divided into 100 sec bins |
 |
 |
| Module-wise count rates for Quadrant B Data is divided into 100 sec bins |
 |
 |
| Module-wise count rates for Quadrant C Data is divided into 100 sec bins |
 |
 |
| Module-wise count rates for Quadrant D Data is divided into 100 sec bins |
 |
 |
| Parameter | Plot |
|---|---|
| CZT HV Monitor |  |
| D_VDD | 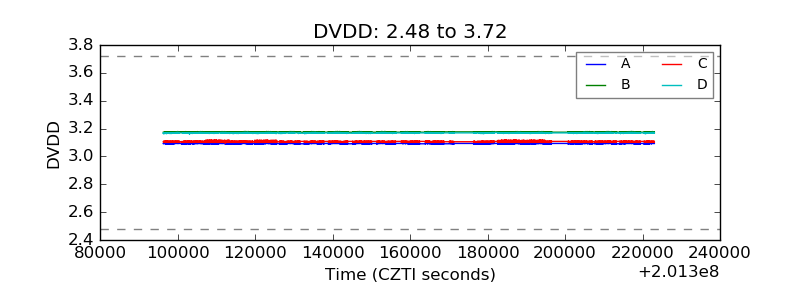 |
| Temperature 1 |  |
| Veto HV Monitor | 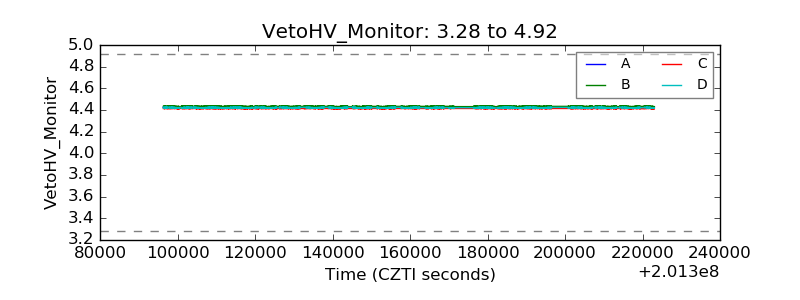 |
| Veto LLD |  |
| Alpha Counter |  |
| _CPM_Rate |  |
| CZT Counter | 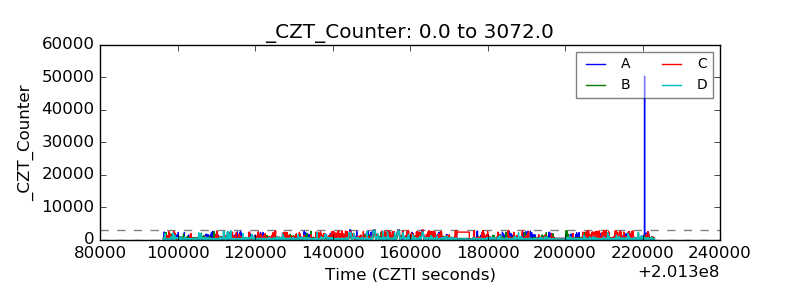 |
| +2.5 Volts monitor | 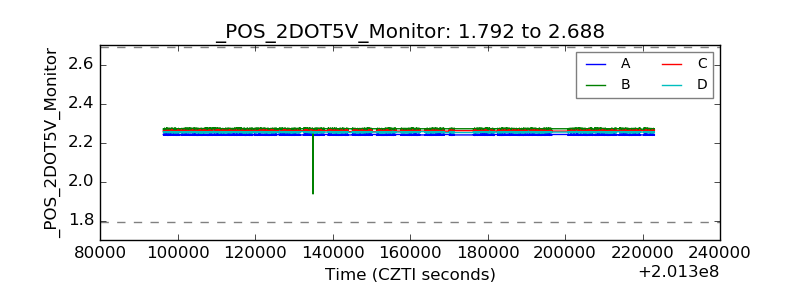 |
| +5 Volts monitor | 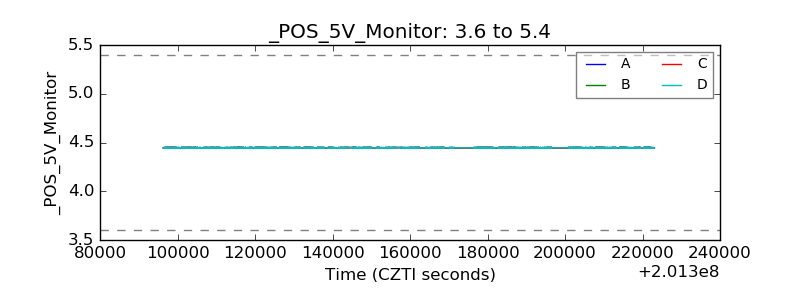 |
| _ROLL_ROT |  |
| _Roll_DEC | 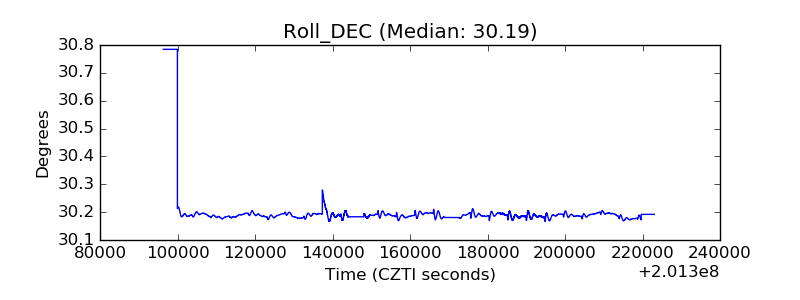 |
| _Roll_RA |  |
| Veto Counter |  |