| Param | Original file | Final file |
|---|---|---|
| Filename | modeM0/AS1G05_211T01_9000000464_03477cztM0_level2.evt | modeM0/AS1G05_211T01_9000000464_03477cztM0_level2_quad_clean.evt |
| Size (bytes) | 413,375,040 | 58,155,840 |
| Size | 394.2 MB | 55.5 MB |
| Events in quadrant A | 3,273,539 | 339,549 |
| Events in quadrant B | 3,110,321 | 345,624 |
| Events in quadrant C | 3,222,671 | 341,220 |
| Events in quadrant D | 2,523,134 | 333,944 |
| Mode M9 | |||
|---|---|---|---|
| Quadrant | BADHDUFLAG | Total packets | Discarded packets |
| A | 0 | 4 | 0 |
| B | 0 | 4 | 0 |
| C | 0 | 4 | 0 |
| D | 0 | 4 | 0 |
| Mode M0 | |||
|---|---|---|---|
| Quadrant | BADHDUFLAG | Total packets | Discarded packets |
| A | 0 | 13719 | 3 |
| B | 0 | 13084 | 2 |
| C | 0 | 13734 | 2 |
| D | 0 | 11973 | 2 |
| Mode SS | |||
|---|---|---|---|
| Quadrant | BADHDUFLAG | Total packets | Discarded packets |
| A | 0 | 116 | 0 |
| B | 0 | 116 | 0 |
| C | 0 | 116 | 0 |
| D | 0 | 116 | 0 |
| Quadrant | Total seconds | Saturated seconds | Saturation percentage |
|---|---|---|---|
| A | 5726 | 119 | 2.078240% |
| B | 5726 | 96 | 1.676563% |
| C | 5726 | 132 | 2.305274% |
| D | 5726 | 21 | 0.366748% |
Noise dominated data is calculated using 1-second bins in cleaned event files. If a bin has >2000 counts, and if more than 50% of those come from <1% of pixels, then it is considered to be noise-dominated and hence unusable.
| Quadrant | # 1 sec bins | Bins with >0 counts | Bins with >2000 counts | High rate bins dominated by noise | Noise dominated (total time) | Noise dominated (detector-on time) | Marked lightcurve |
|---|---|---|---|---|---|---|---|
| A | 6121 | 5728 | 64 | 64 | 1.05% | 1.12% |  |
| B | 6121 | 5728 | 26 | 26 | 0.42% | 0.45% | 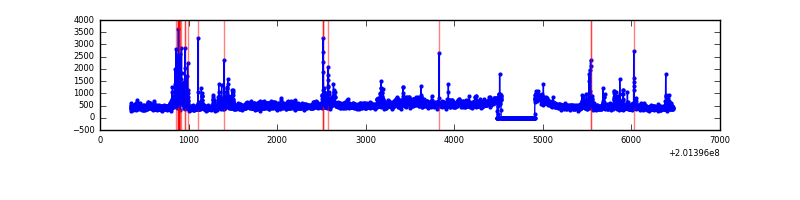 |
| C | 6121 | 5728 | 99 | 99 | 1.62% | 1.73% | 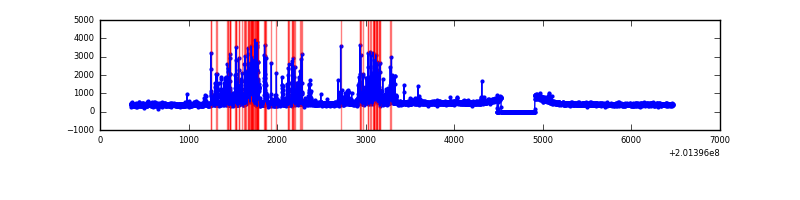 |
| D | 6121 | 5728 | 10 | 10 | 0.16% | 0.17% | 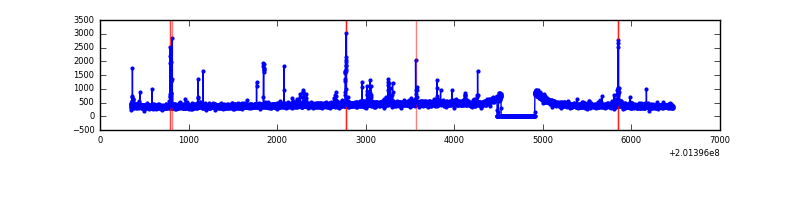 |
Top three noisy pixels from each quadrant. If the there are fewer than three noisy pixels in the level2.evt file, extra rows are filled as -1
| Pixel properties | Quadrant properties | ||||||
|---|---|---|---|---|---|---|---|
| Quadrant | DetID | PixID | Counts | Sigma | Mean | Median | Sigma |
| A | 0 | 118 | 532303 | 3947.87 | 645 | 630 | 134.7 |
| A | 0 | 50 | 119714 | 884.24 | 645 | 630 | 134.7 |
| A | 14 | 238 | 60570 | 445.08 | 645 | 630 | 134.7 |
| B | 2 | 249 | 220901 | 1702.52 | 657 | 640 | 129.4 |
| B | 15 | 204 | 190236 | 1465.49 | 657 | 640 | 129.4 |
| B | 3 | 0 | 85773 | 658.04 | 657 | 640 | 129.4 |
| C | 7 | 220 | 669539 | 4526.29 | 630 | 634 | 147.8 |
| C | 6 | 80 | 72437 | 485.87 | 630 | 634 | 147.8 |
| C | 1 | 192 | 8018 | 49.97 | 630 | 634 | 147.8 |
| D | 2 | 31 | 34098 | 219.98 | 628 | 608 | 152.2 |
| D | 13 | 223 | 26437 | 169.66 | 628 | 608 | 152.2 |
| D | 13 | 239 | 22121 | 141.31 | 628 | 608 | 152.2 |
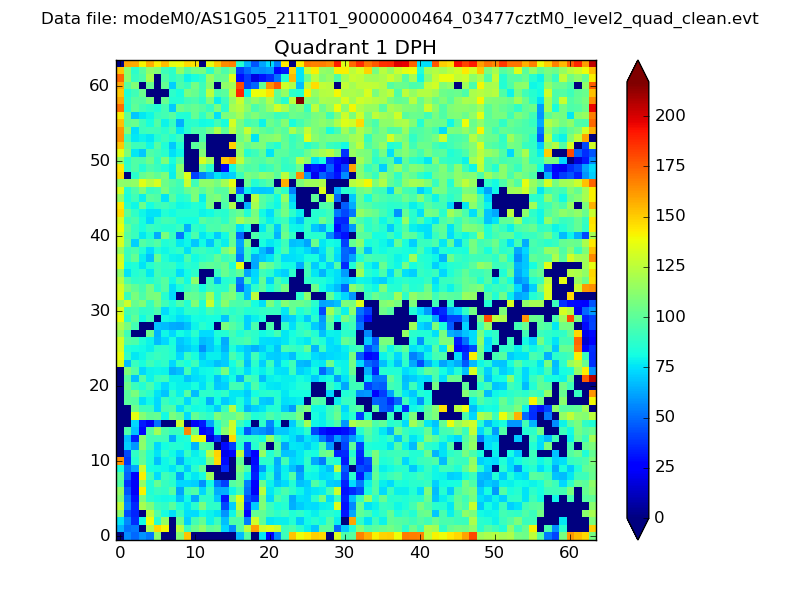
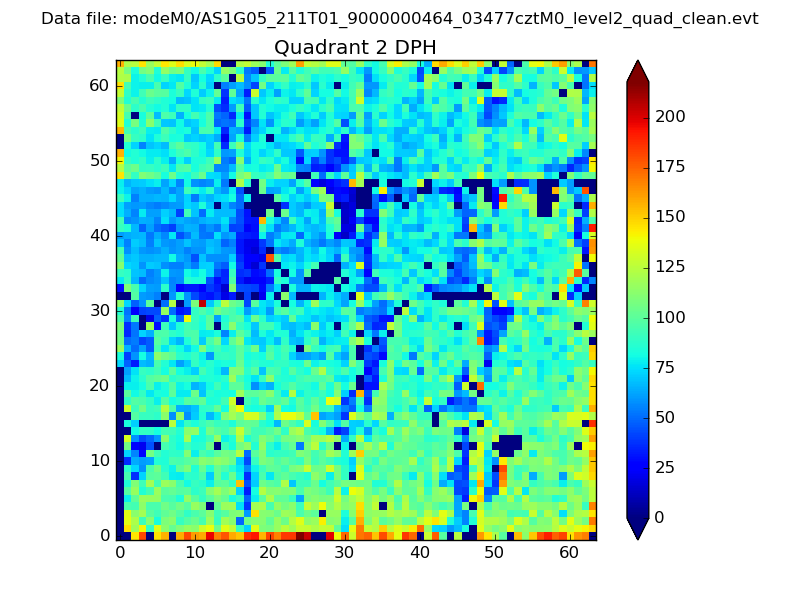
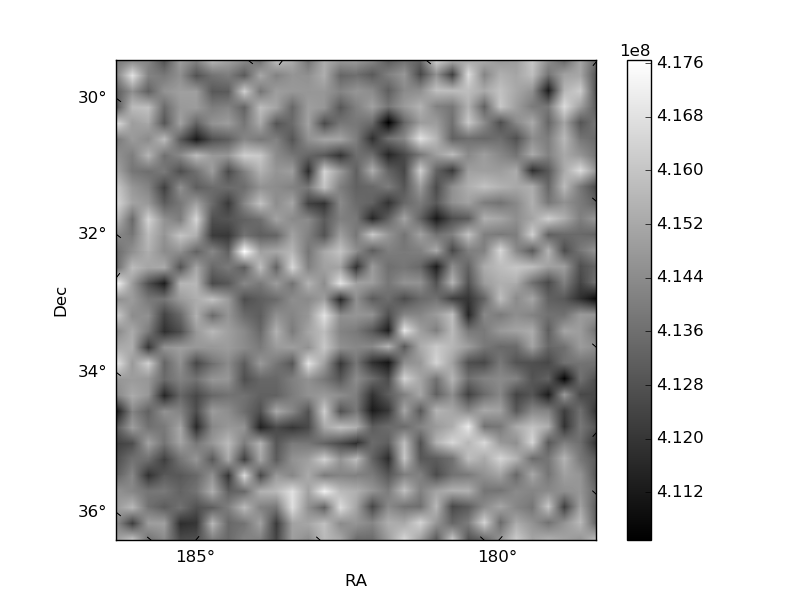
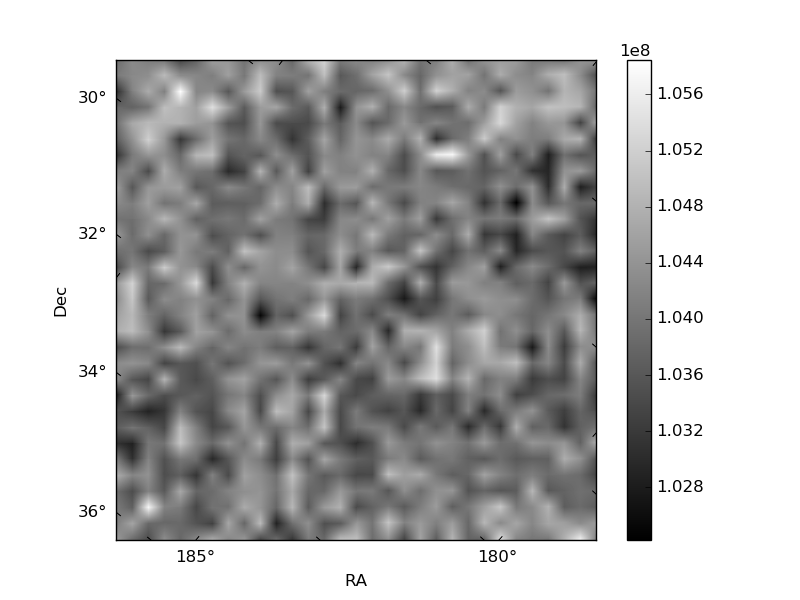
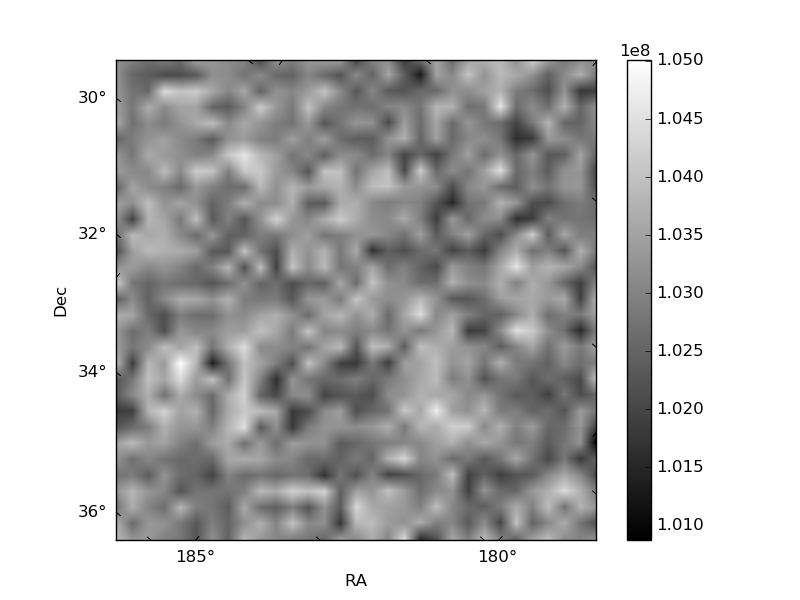
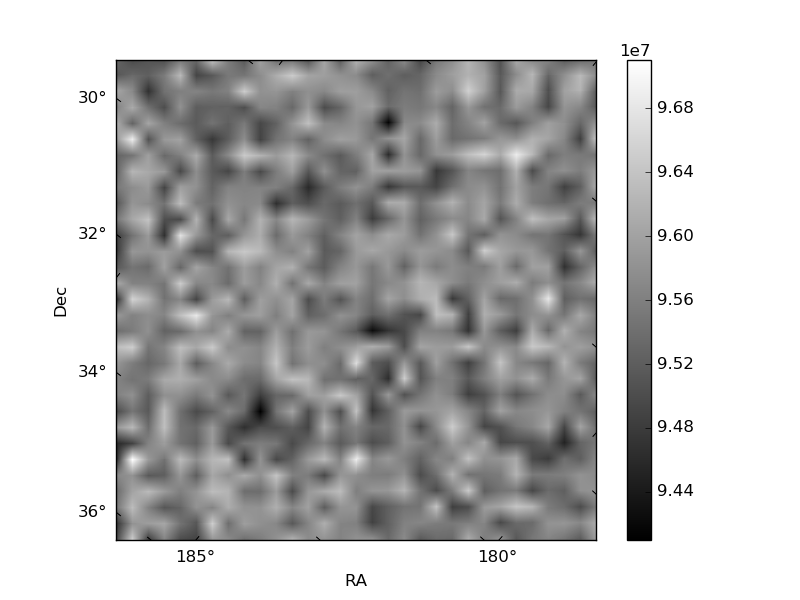
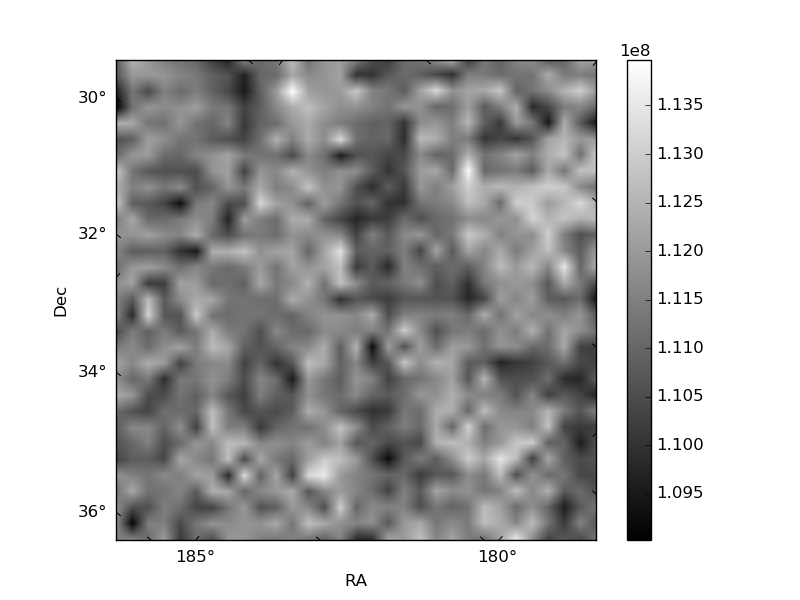
Histogram calculated using DETX and DETY for each event in the final _common_clean file
| Quadrant A | 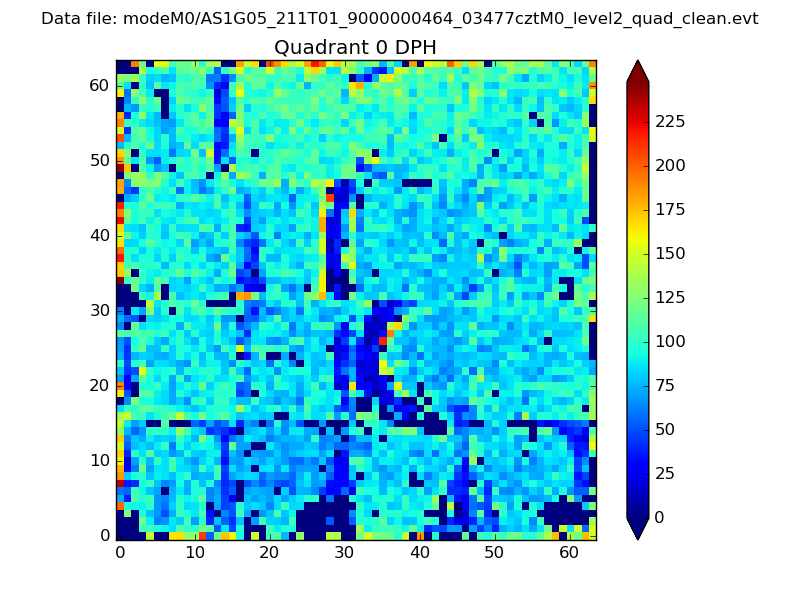 |
 |
Quadrant B |
|---|---|---|---|
| Quadrant D | 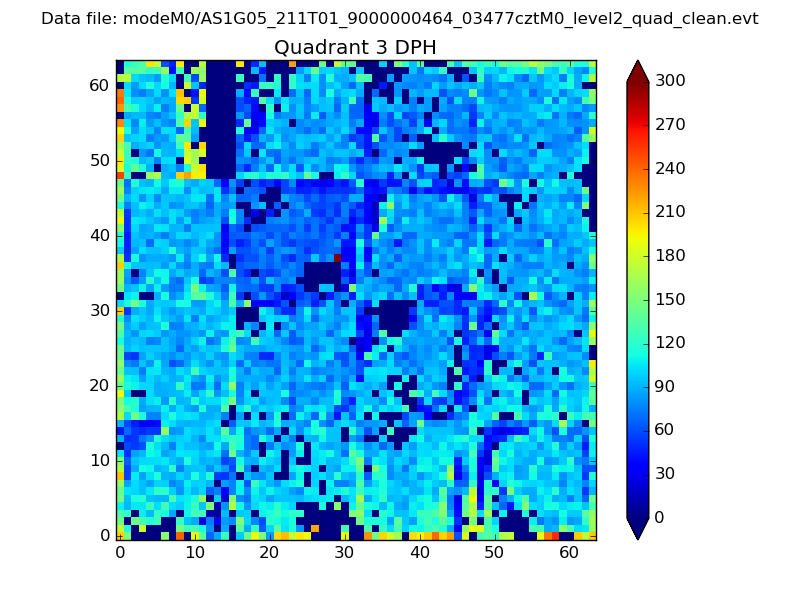 |
 |
Quadrant C |
| Plot type | Count rate plots | Images |
|---|---|---|
| Comparison with Poisson distribution Blue bars denote a histogram of data divided into 1 sec bins. Red curve is a Poisson curve with rate = median count rate of data. |
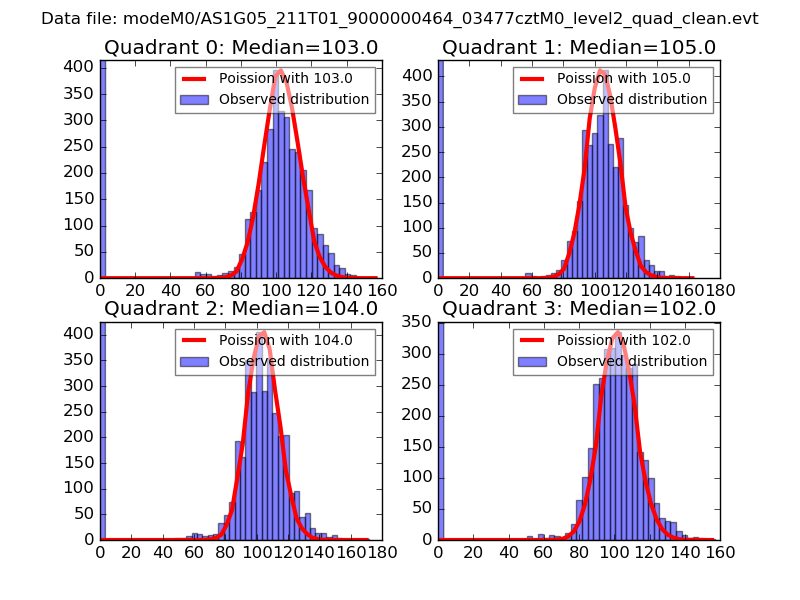 |
 |
| Quadrant-wise count rates Data is divided into 100 sec bins |
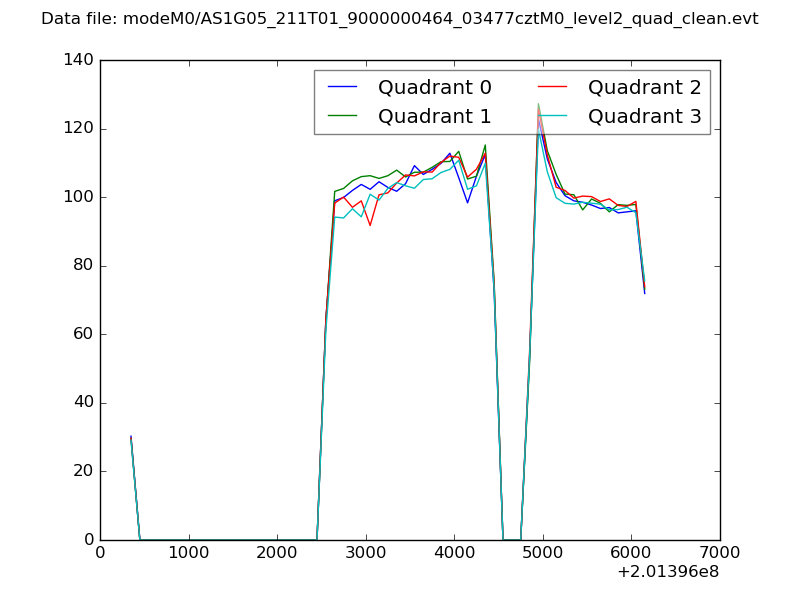 |
|
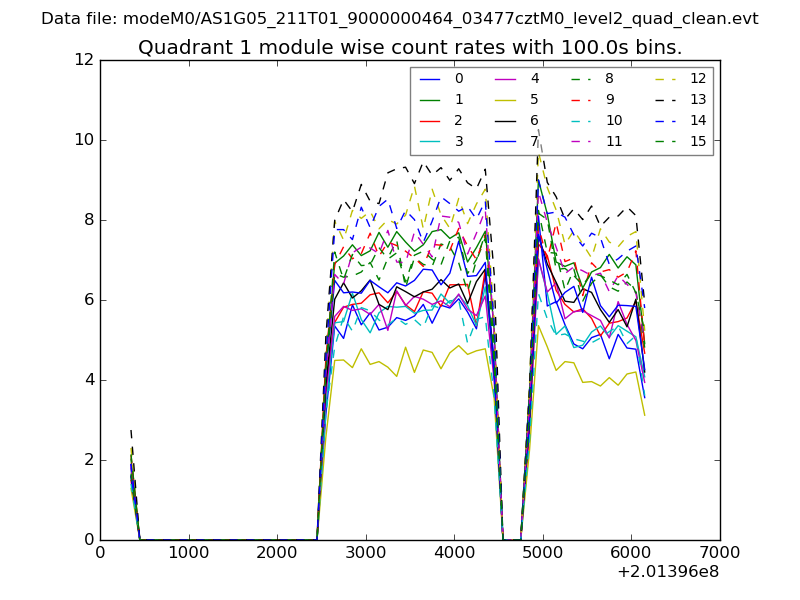
| Module-wise count rates for Quadrant A Data is divided into 100 sec bins |
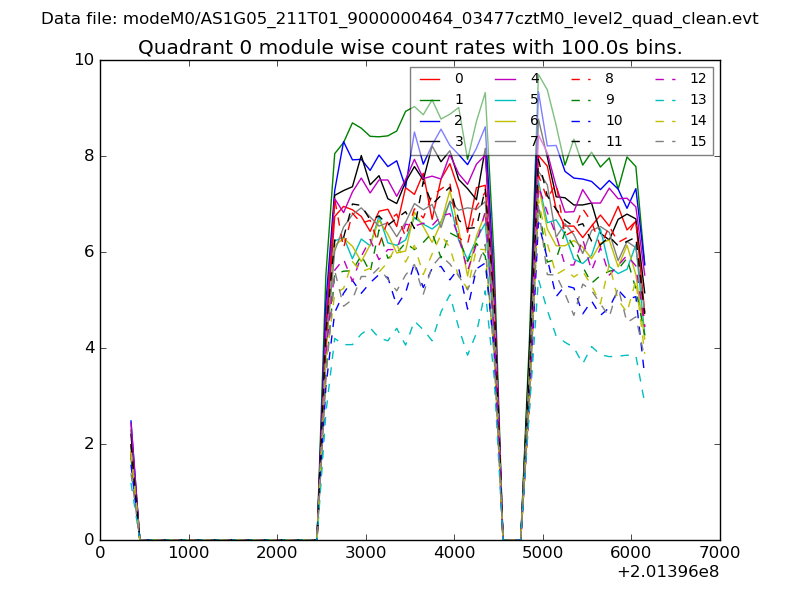 |
 |
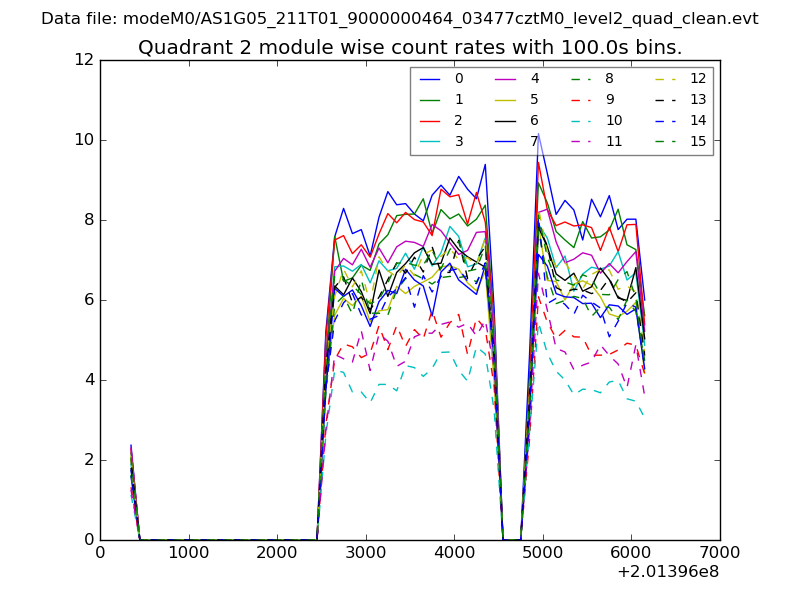
| Module-wise count rates for Quadrant B Data is divided into 100 sec bins |
 |
 |
| Module-wise count rates for Quadrant C Data is divided into 100 sec bins |
 |
 |
| Module-wise count rates for Quadrant D Data is divided into 100 sec bins |
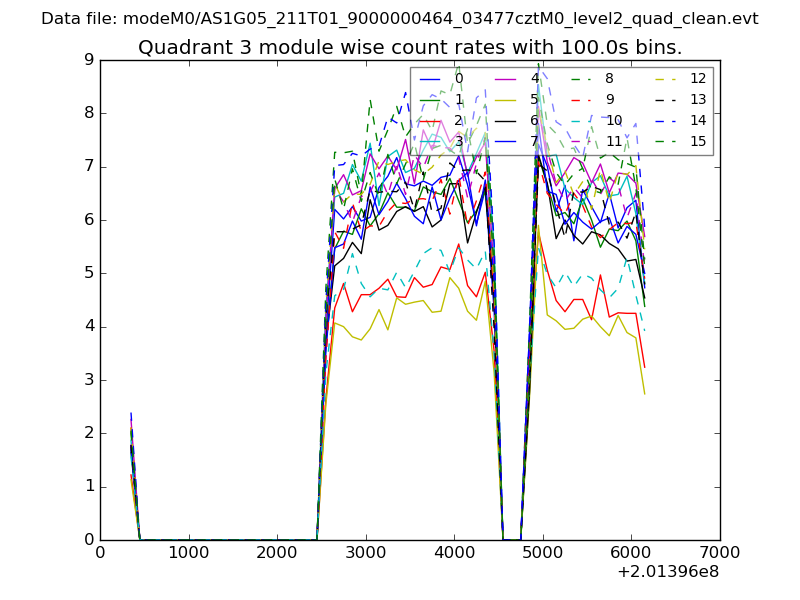 |
 |
| Parameter | Plot |
|---|---|
| CZT HV Monitor | 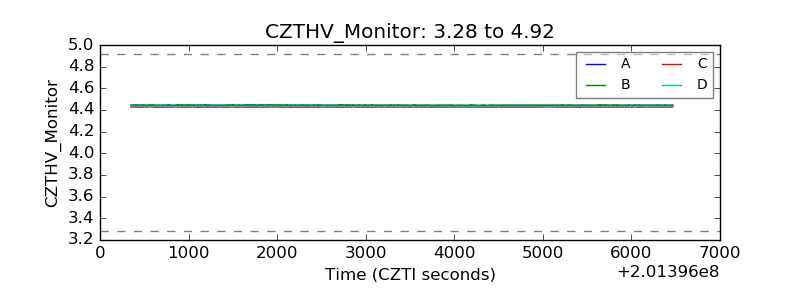 |
| D_VDD | 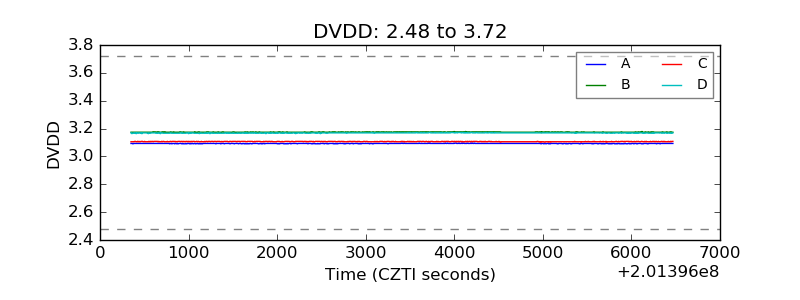 |
| Temperature 1 | 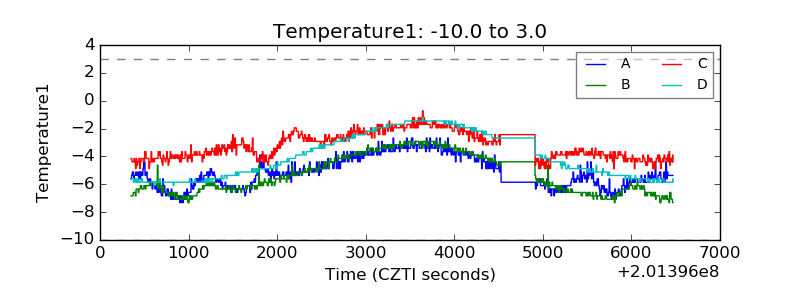 |
| Veto HV Monitor | 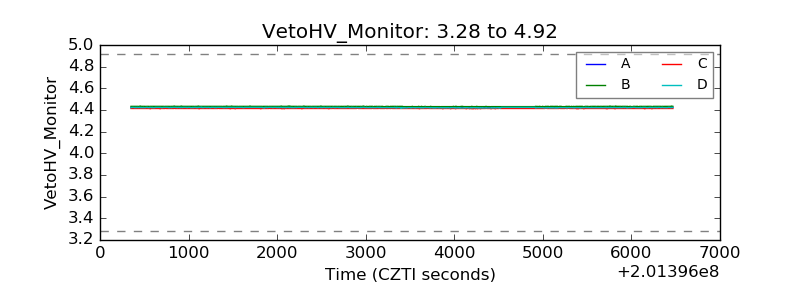 |
| Veto LLD | 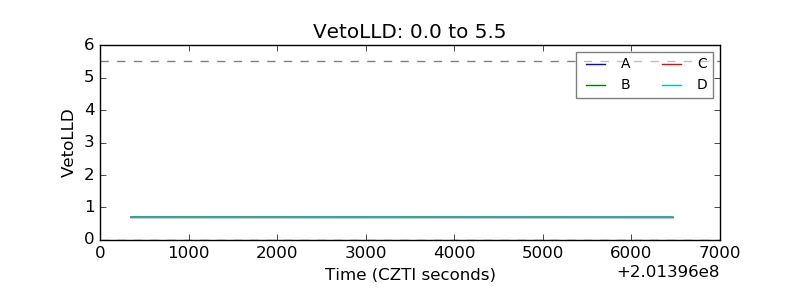 |
| Alpha Counter | 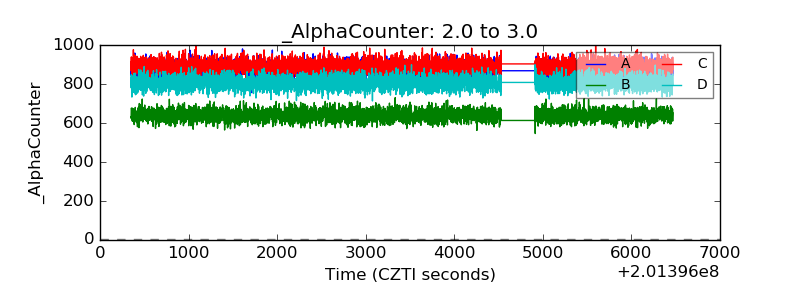 |
| _CPM_Rate | 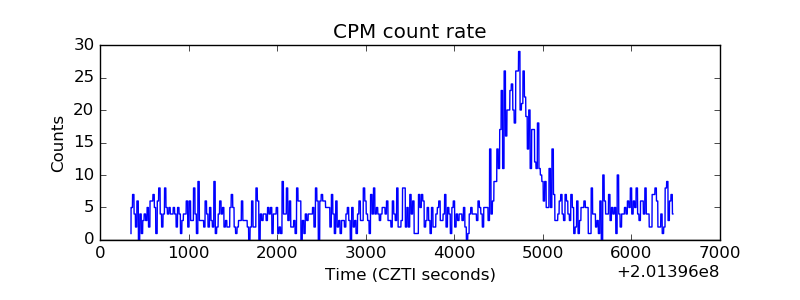 |
| CZT Counter | 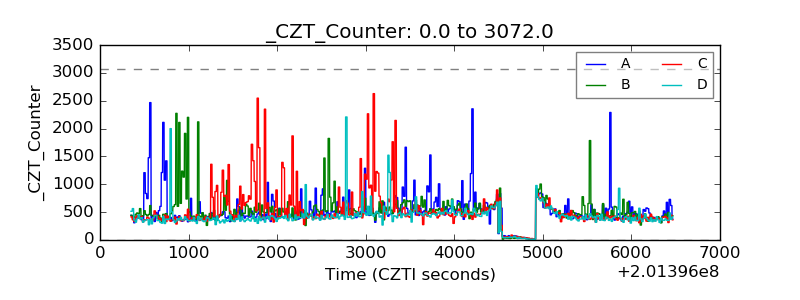 |
| +2.5 Volts monitor |  |
| +5 Volts monitor |  |
| Veto Counter | 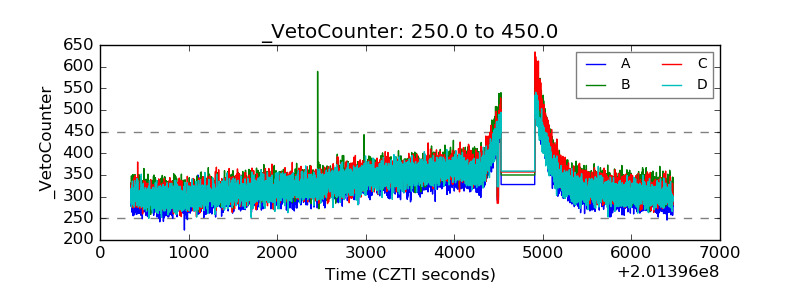 |