| Param | Original file | Final file |
|---|---|---|
| Filename | modeM0/AS1G05_211T01_9000000464_03479cztM0_level2.evt | modeM0/AS1G05_211T01_9000000464_03479cztM0_level2_quad_clean.evt |
| Size (bytes) | 691,044,480 | 95,143,680 |
| Size | 659.0 MB | 90.7 MB |
| Events in quadrant A | 5,232,077 | 570,505 |
| Events in quadrant B | 4,935,050 | 579,759 |
| Events in quadrant C | 5,071,627 | 568,851 |
| Events in quadrant D | 5,080,387 | 537,507 |
| Mode M0 | |||
|---|---|---|---|
| Quadrant | BADHDUFLAG | Total packets | Discarded packets |
| A | 0 | 21787 | 3 |
| B | 0 | 20721 | 2 |
| C | 0 | 21463 | 2 |
| D | 0 | 22085 | 2 |
| Mode SS | |||
|---|---|---|---|
| Quadrant | BADHDUFLAG | Total packets | Discarded packets |
| A | 0 | 180 | 0 |
| B | 0 | 180 | 0 |
| C | 0 | 180 | 0 |
| D | 0 | 180 | 0 |
| Quadrant | Total seconds | Saturated seconds | Saturation percentage |
|---|---|---|---|
| A | 8986 | 387 | 4.306699% |
| B | 8986 | 357 | 3.972847% |
| C | 8986 | 367 | 4.084131% |
| D | 8986 | 603 | 6.710438% |
Noise dominated data is calculated using 1-second bins in cleaned event files. If a bin has >2000 counts, and if more than 50% of those come from <1% of pixels, then it is considered to be noise-dominated and hence unusable.
| Quadrant | # 1 sec bins | Bins with >0 counts | Bins with >2000 counts | High rate bins dominated by noise | Noise dominated (total time) | Noise dominated (detector-on time) | Marked lightcurve |
|---|---|---|---|---|---|---|---|
| A | 9031 | 8988 | 62 | 62 | 0.69% | 0.69% | 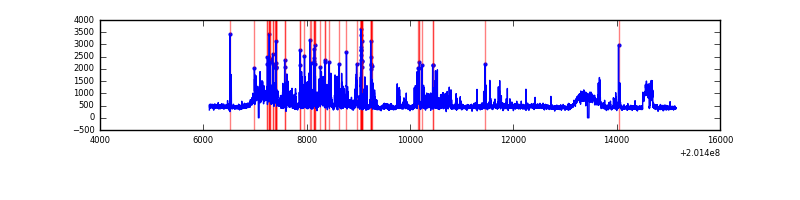 |
| B | 9031 | 8988 | 29 | 29 | 0.32% | 0.32% | 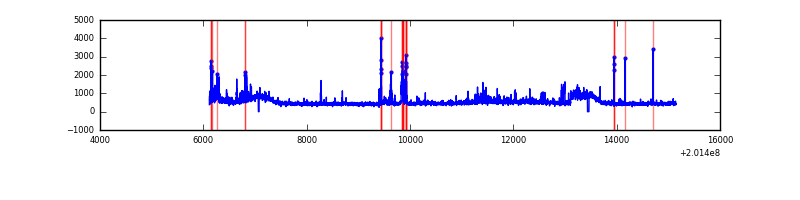 |
| C | 9031 | 8988 | 137 | 137 | 1.52% | 1.52% |  |
| D | 9031 | 8988 | 387 | 387 | 4.29% | 4.31% | 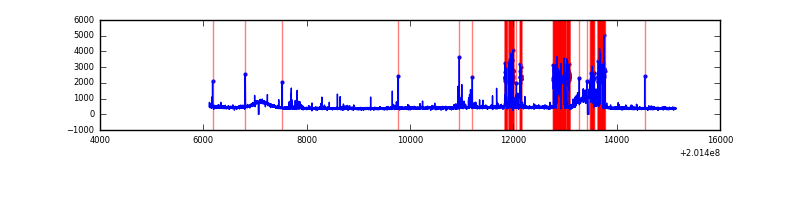 |
Top three noisy pixels from each quadrant. If the there are fewer than three noisy pixels in the level2.evt file, extra rows are filled as -1
| Pixel properties | Quadrant properties | ||||||
|---|---|---|---|---|---|---|---|
| Quadrant | DetID | PixID | Counts | Sigma | Mean | Median | Sigma |
| A | 0 | 118 | 638825 | 2904.73 | 1055 | 1027 | 219.6 |
| A | 0 | 50 | 268557 | 1218.41 | 1055 | 1027 | 219.6 |
| A | 15 | 174 | 192320 | 871.21 | 1055 | 1027 | 219.6 |
| B | 15 | 204 | 295198 | 1378.71 | 1077 | 1046 | 213.4 |
| B | 15 | 85 | 182171 | 848.94 | 1077 | 1046 | 213.4 |
| B | 6 | 205 | 146170 | 680.2 | 1077 | 1046 | 213.4 |
| C | 7 | 220 | 987487 | 4090.4 | 1024 | 1028 | 241.2 |
| C | 8 | 128 | 23911 | 94.89 | 1024 | 1028 | 241.2 |
| C | 1 | 192 | 10644 | 39.87 | 1024 | 1028 | 241.2 |
| D | 13 | 46 | 1149626 | 4679.65 | 1005 | 973 | 245.5 |
| D | 13 | 239 | 41564 | 165.37 | 1005 | 973 | 245.5 |
| D | 4 | 160 | 40297 | 160.21 | 1005 | 973 | 245.5 |
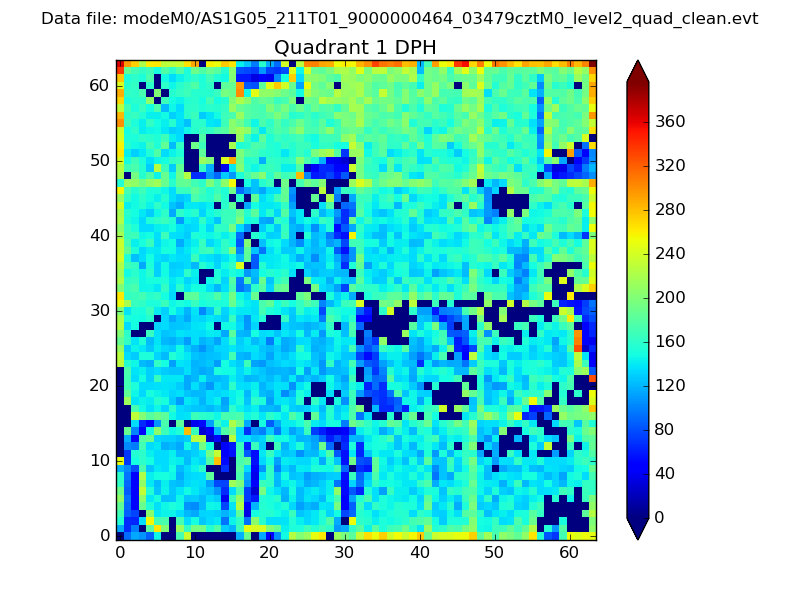
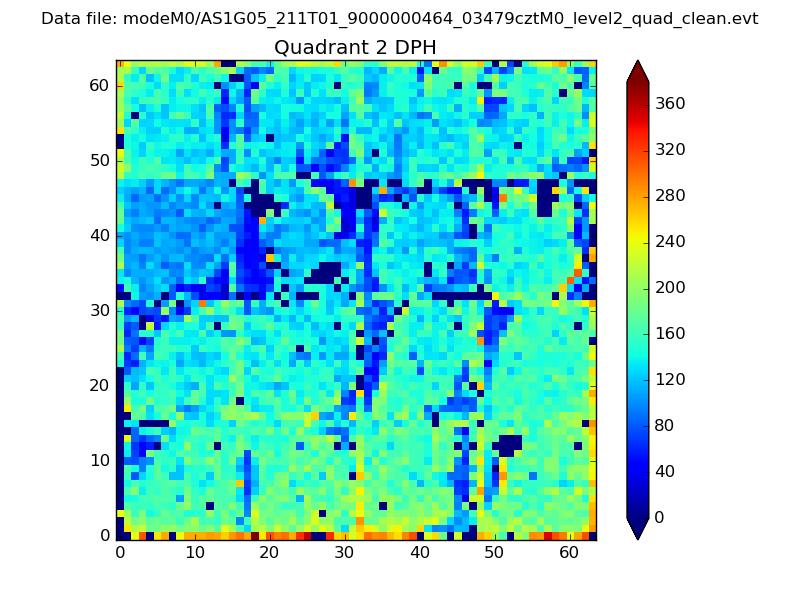
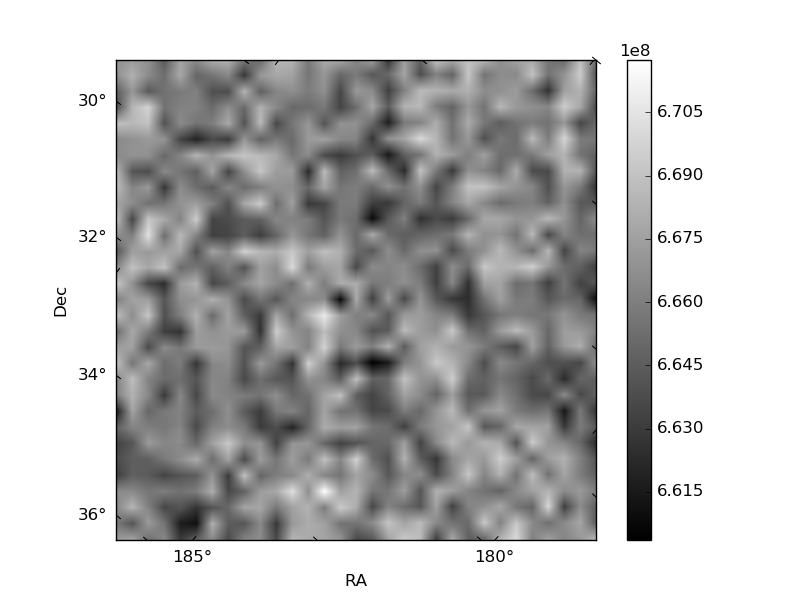
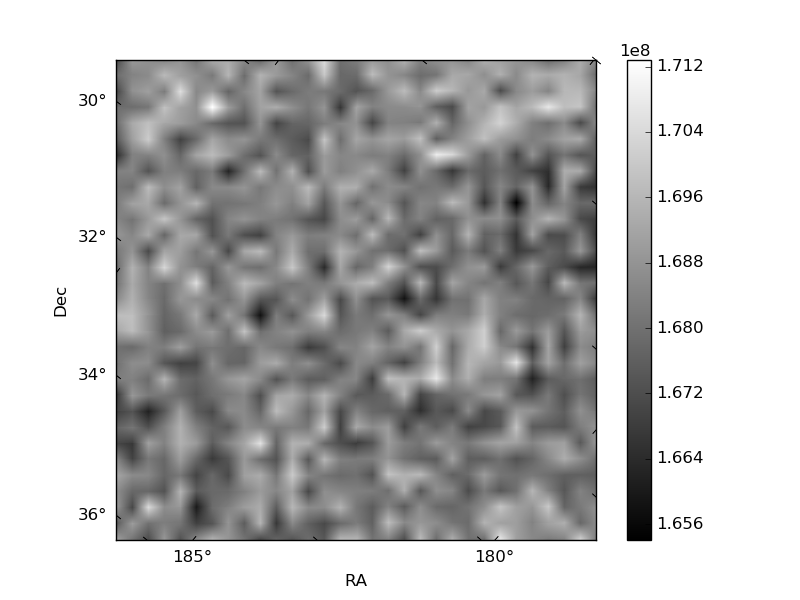
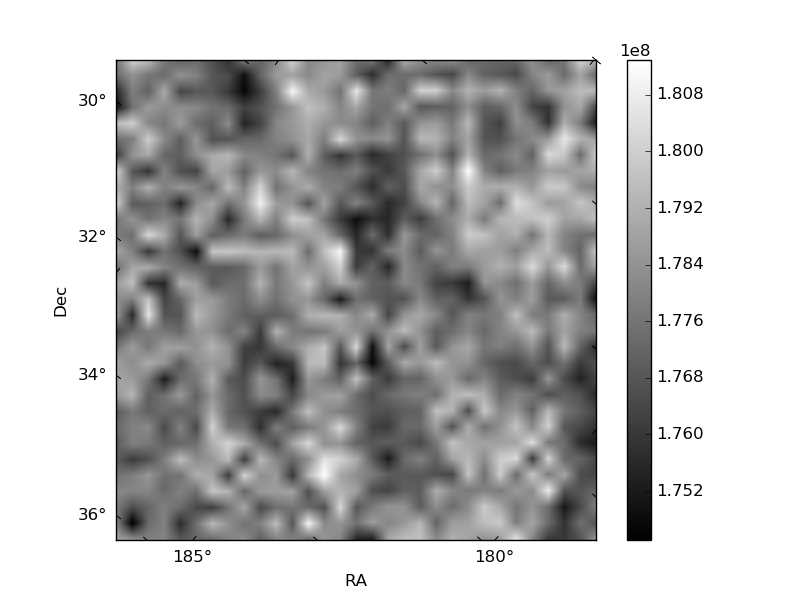
Histogram calculated using DETX and DETY for each event in the final _common_clean file
| Quadrant A | 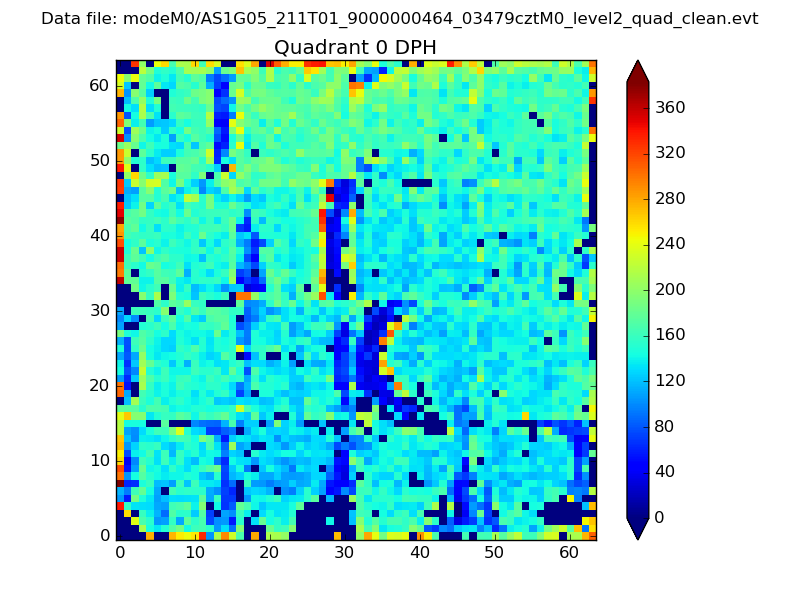 |
 |
Quadrant B |
|---|---|---|---|
| Quadrant D | 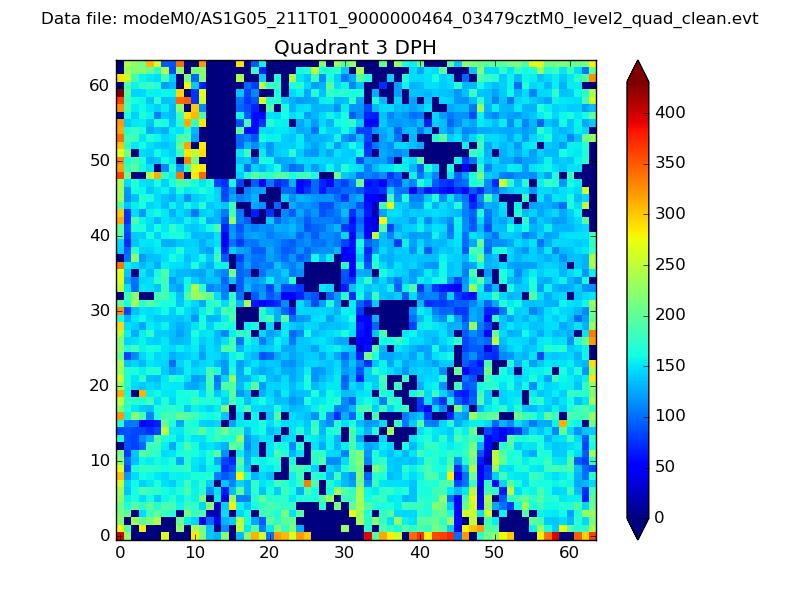 |
 |
Quadrant C |
| Plot type | Count rate plots | Images |
|---|---|---|
| Comparison with Poisson distribution Blue bars denote a histogram of data divided into 1 sec bins. Red curve is a Poisson curve with rate = median count rate of data. |
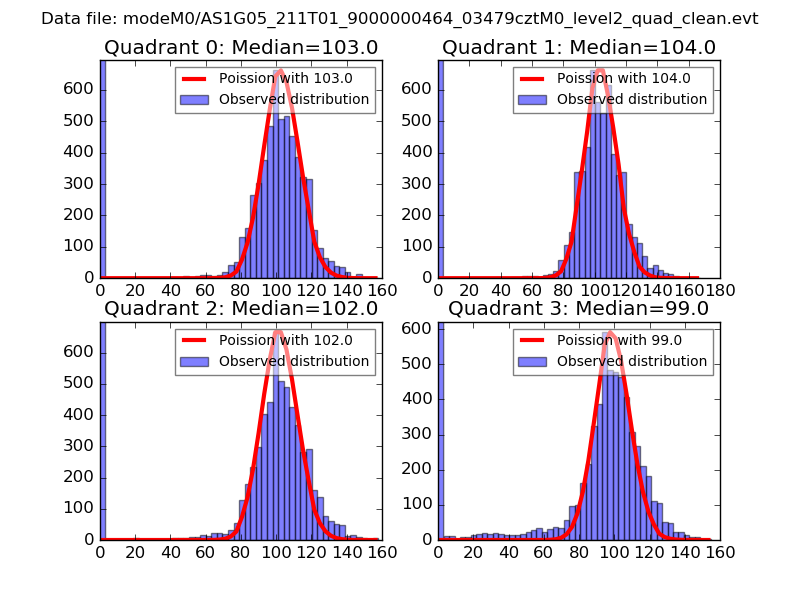 |
 |
| Quadrant-wise count rates Data is divided into 100 sec bins |
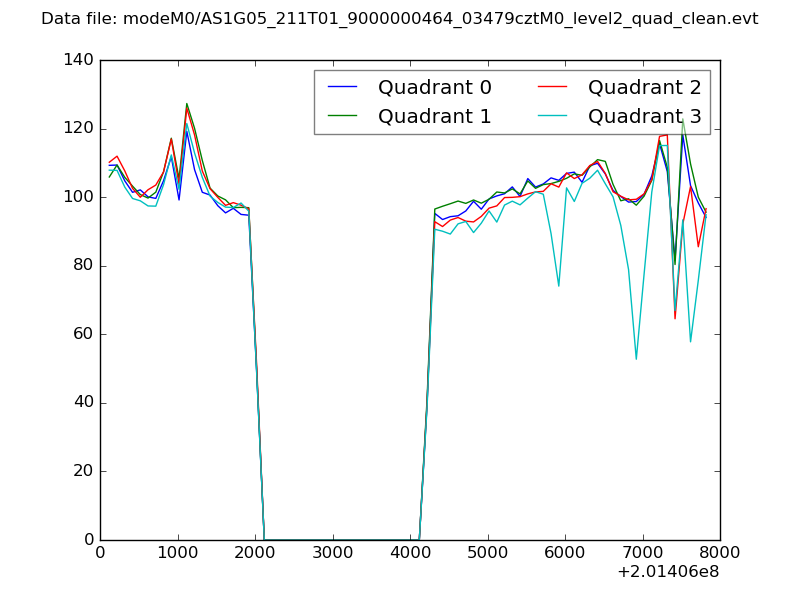 |
|
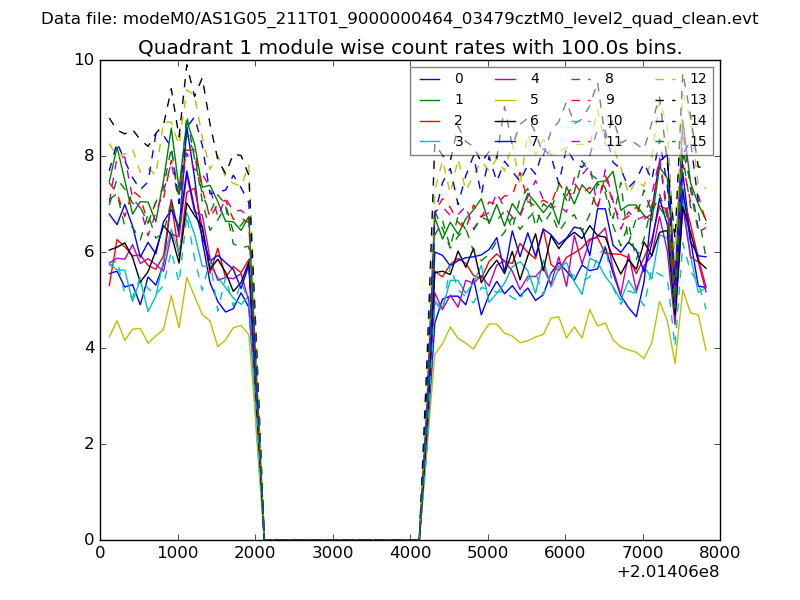
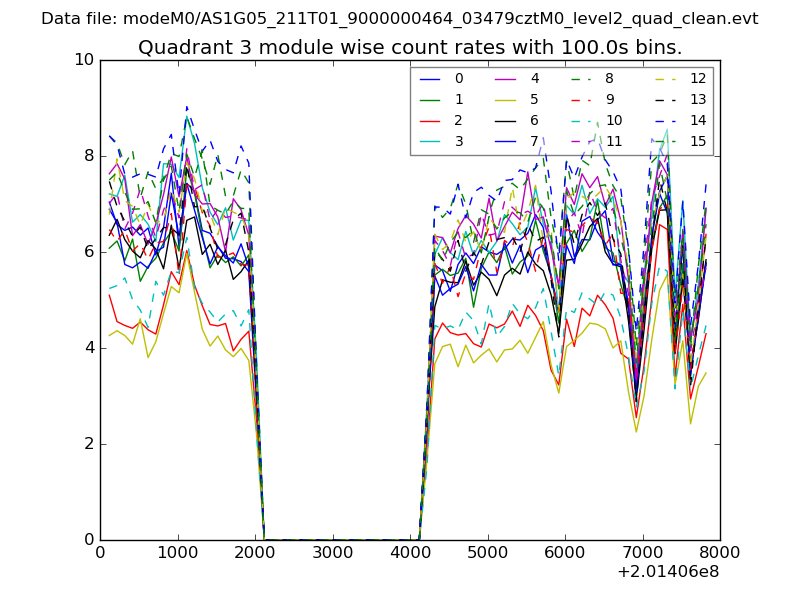
| Module-wise count rates for Quadrant A Data is divided into 100 sec bins |
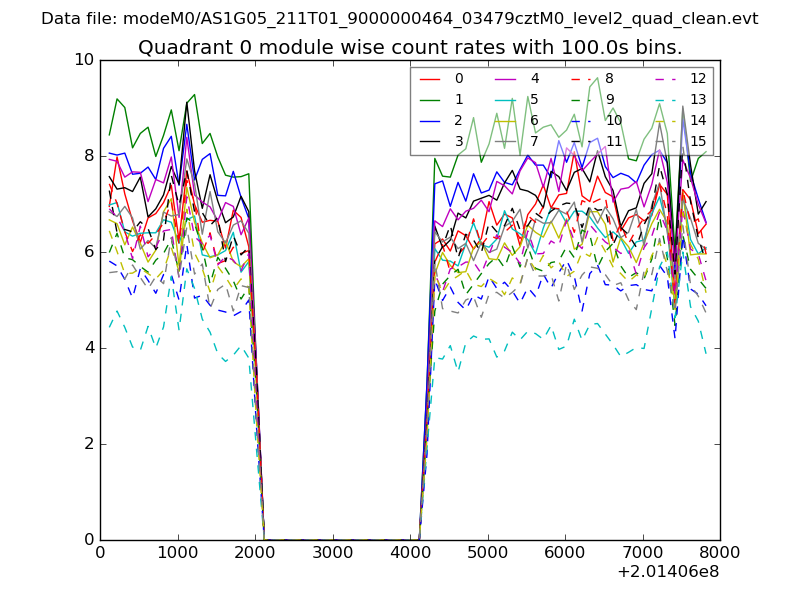 |
 |
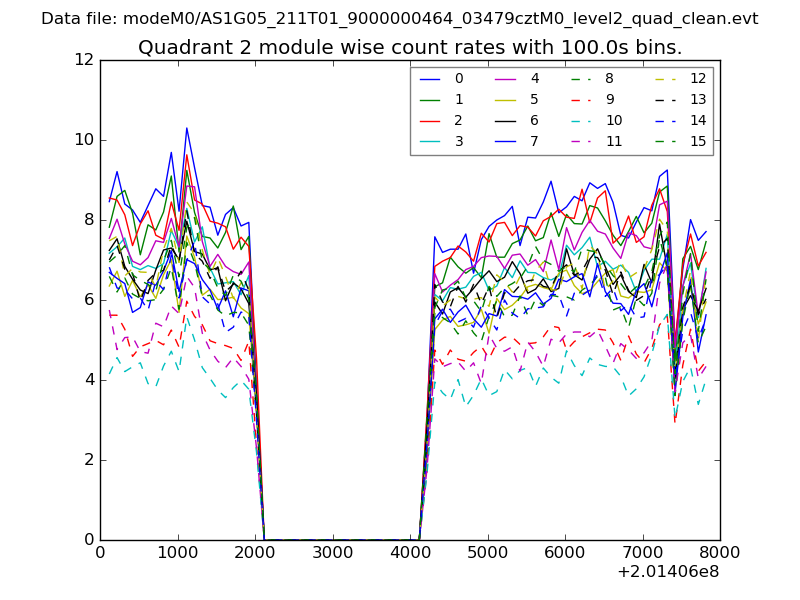
| Module-wise count rates for Quadrant B Data is divided into 100 sec bins |
 |
 |
| Module-wise count rates for Quadrant C Data is divided into 100 sec bins |
 |
 |
| Module-wise count rates for Quadrant D Data is divided into 100 sec bins |
 |
 |
| Parameter | Plot |
|---|---|
| CZT HV Monitor | 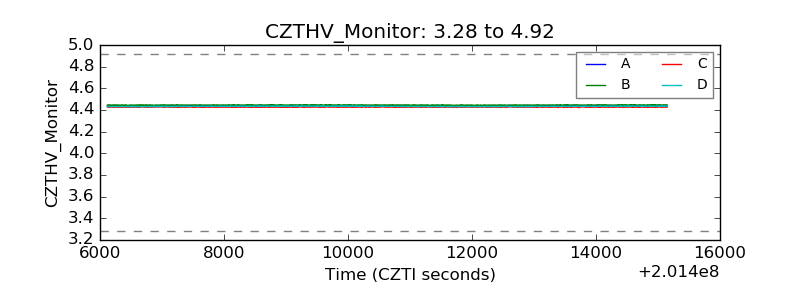 |
| D_VDD |  |
| Temperature 1 | 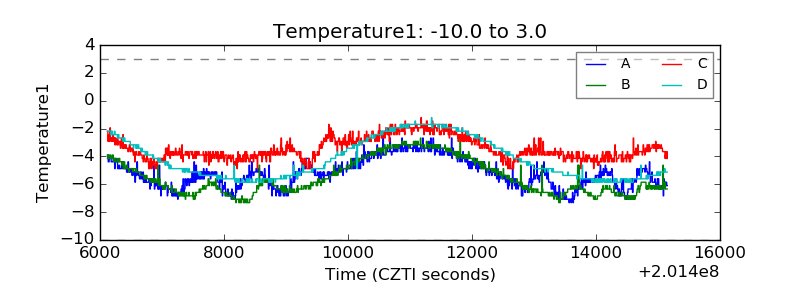 |
| Veto HV Monitor | 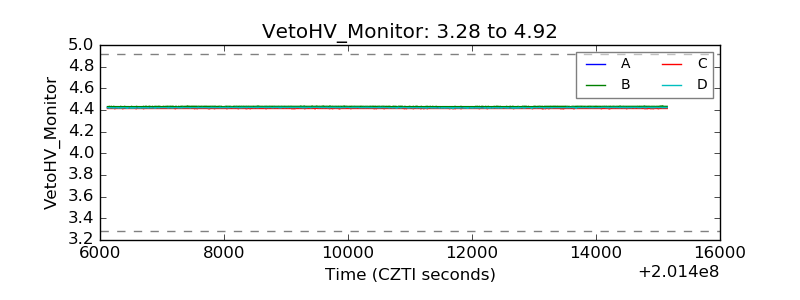 |
| Veto LLD | 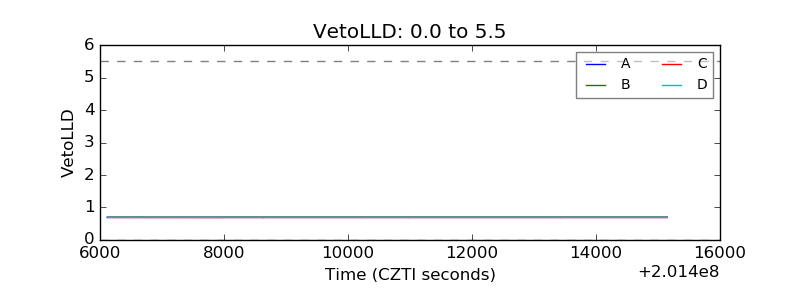 |
| Alpha Counter | 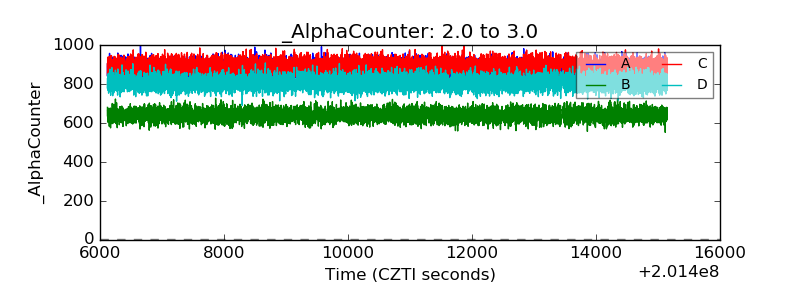 |
| _CPM_Rate | 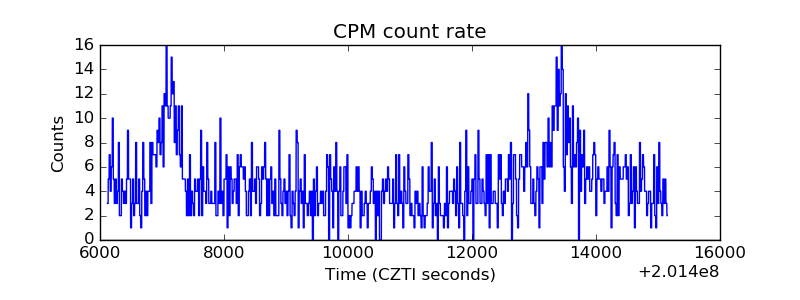 |
| CZT Counter | 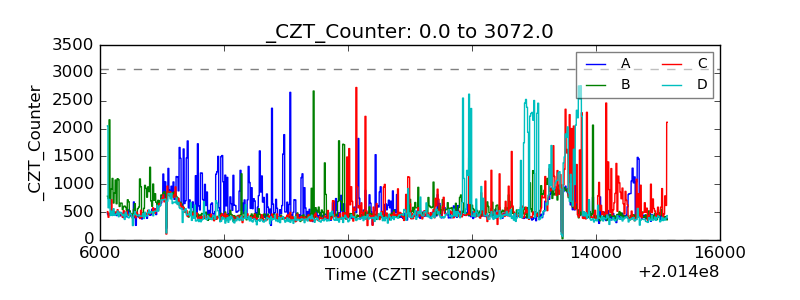 |
| +2.5 Volts monitor |  |
| +5 Volts monitor |  |
| _ROLL_ROT | 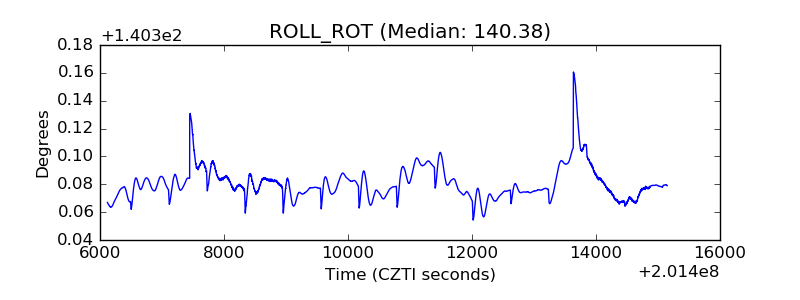 |
| _Roll_DEC | 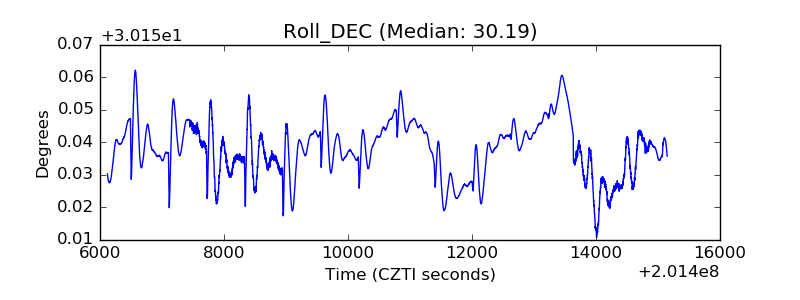 |
| _Roll_RA | 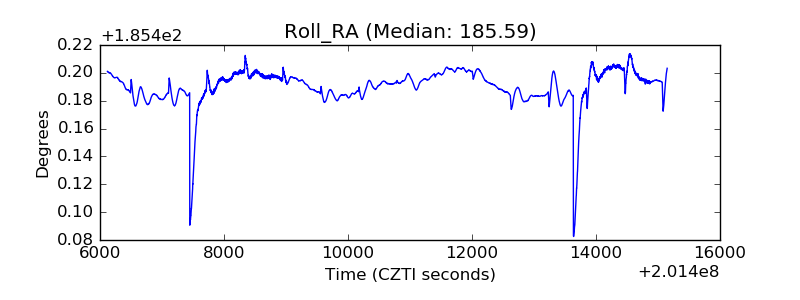 |
| Veto Counter | 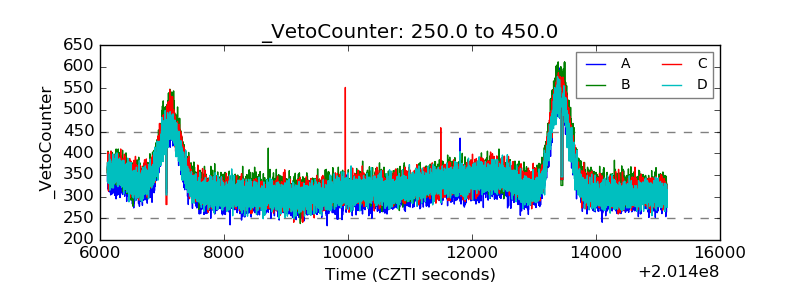 |