| Param | Original file | Final file |
|---|---|---|
| Filename | modeM0/AS1G05_211T01_9000000464_03483cztM0_level2.evt | modeM0/AS1G05_211T01_9000000464_03483cztM0_level2_quad_clean.evt |
| Size (bytes) | 511,646,400 | 72,290,880 |
| Size | 487.9 MB | 68.9 MB |
| Events in quadrant A | 3,889,220 | 438,631 |
| Events in quadrant B | 3,732,381 | 438,649 |
| Events in quadrant C | 4,327,779 | 412,476 |
| Events in quadrant D | 3,080,198 | 421,125 |
| Mode M9 | |||
|---|---|---|---|
| Quadrant | BADHDUFLAG | Total packets | Discarded packets |
| A | 0 | 12 | 0 |
| B | 0 | 12 | 0 |
| C | 0 | 12 | 0 |
| D | 0 | 13 | 0 |
| Mode M0 | |||
|---|---|---|---|
| Quadrant | BADHDUFLAG | Total packets | Discarded packets |
| A | 0 | 16481 | 3 |
| B | 0 | 15511 | 2 |
| C | 0 | 17678 | 2 |
| D | 0 | 14252 | 2 |
| Mode SS | |||
|---|---|---|---|
| Quadrant | BADHDUFLAG | Total packets | Discarded packets |
| A | 0 | 136 | 0 |
| B | 0 | 136 | 0 |
| C | 0 | 136 | 0 |
| D | 0 | 136 | 0 |
| Quadrant | Total seconds | Saturated seconds | Saturation percentage |
|---|---|---|---|
| A | 6868 | 265 | 3.858474% |
| B | 6868 | 135 | 1.965638% |
| C | 6868 | 441 | 6.421083% |
| D | 6868 | 90 | 1.310425% |
Noise dominated data is calculated using 1-second bins in cleaned event files. If a bin has >2000 counts, and if more than 50% of those come from <1% of pixels, then it is considered to be noise-dominated and hence unusable.
| Quadrant | # 1 sec bins | Bins with >0 counts | Bins with >2000 counts | High rate bins dominated by noise | Noise dominated (total time) | Noise dominated (detector-on time) | Marked lightcurve |
|---|---|---|---|---|---|---|---|
| A | 7778 | 6868 | 87 | 87 | 1.12% | 1.27% | 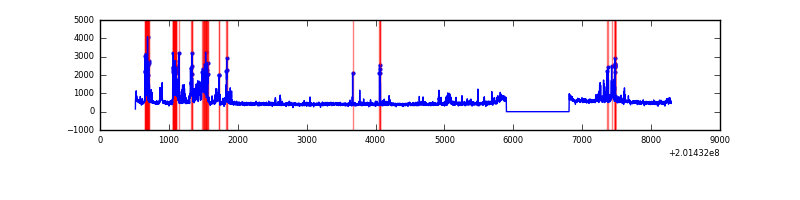 |
| B | 7778 | 6868 | 26 | 26 | 0.33% | 0.38% | 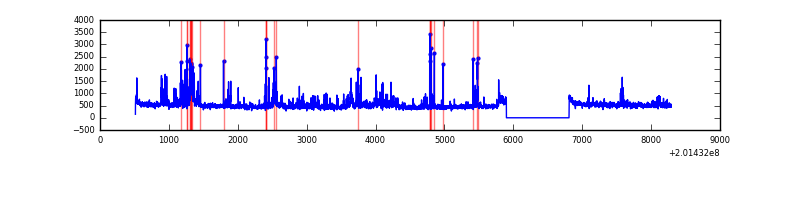 |
| C | 7778 | 6868 | 286 | 286 | 3.68% | 4.16% | 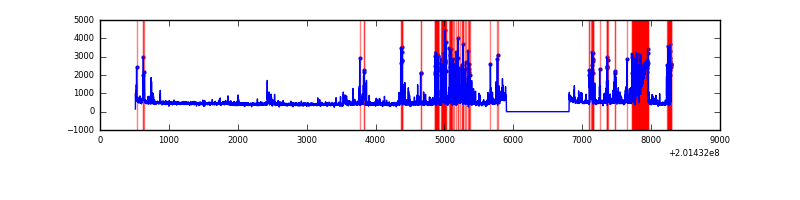 |
| D | 7778 | 6868 | 10 | 10 | 0.13% | 0.15% |  |
Top three noisy pixels from each quadrant. If the there are fewer than three noisy pixels in the level2.evt file, extra rows are filled as -1
| Pixel properties | Quadrant properties | ||||||
|---|---|---|---|---|---|---|---|
| Quadrant | DetID | PixID | Counts | Sigma | Mean | Median | Sigma |
| A | 0 | 50 | 677241 | 4176.59 | 786 | 768 | 162.0 |
| A | 0 | 118 | 86287 | 528.0 | 786 | 768 | 162.0 |
| A | 14 | 111 | 54887 | 334.13 | 786 | 768 | 162.0 |
| B | 15 | 204 | 281094 | 1787.39 | 800 | 780 | 156.8 |
| B | 2 | 249 | 143027 | 907.02 | 800 | 780 | 156.8 |
| B | 4 | 81 | 74176 | 468.0 | 800 | 780 | 156.8 |
| C | 7 | 220 | 1378360 | 7928.15 | 744 | 747 | 173.8 |
| C | 1 | 16 | 17250 | 94.97 | 744 | 747 | 173.8 |
| C | 6 | 80 | 9463 | 50.16 | 744 | 747 | 173.8 |
| D | 13 | 239 | 32267 | 170.56 | 767 | 743 | 184.8 |
| D | 6 | 17 | 31152 | 164.53 | 767 | 743 | 184.8 |
| D | 12 | 110 | 30907 | 163.2 | 767 | 743 | 184.8 |
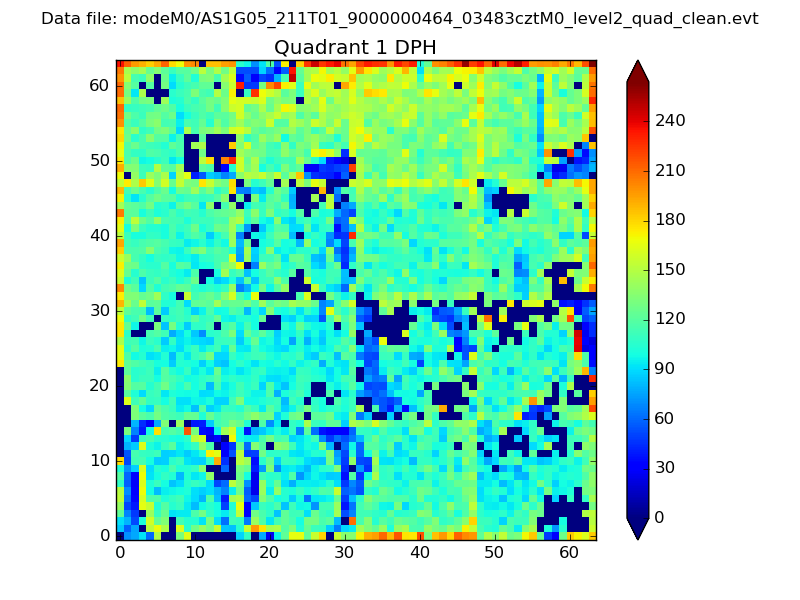
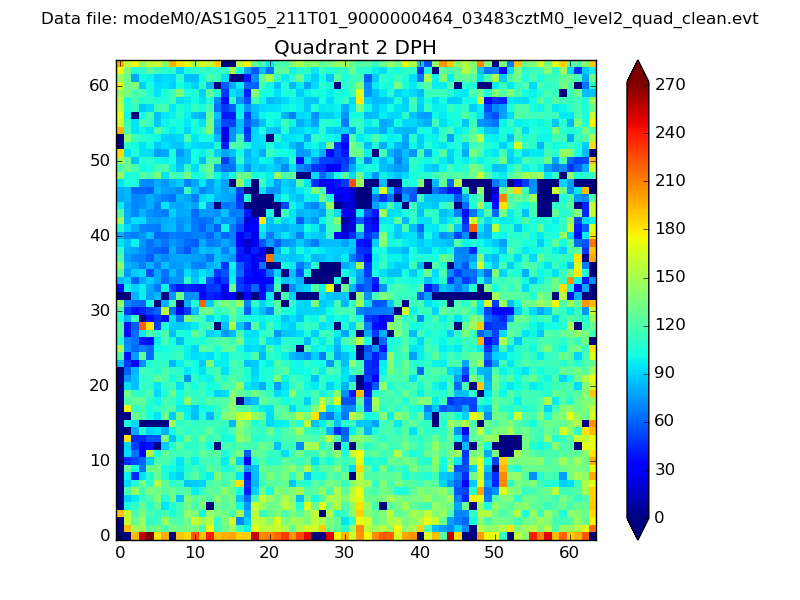
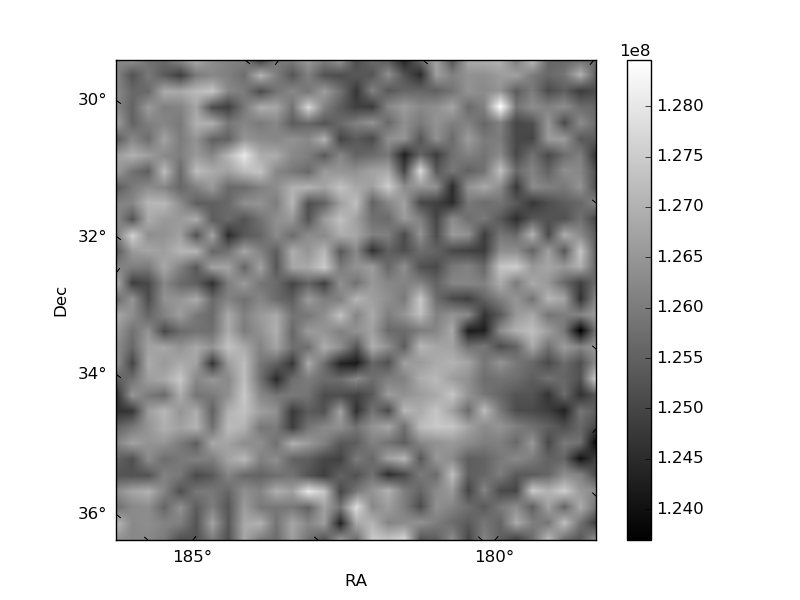
Histogram calculated using DETX and DETY for each event in the final _common_clean file
| Quadrant A | 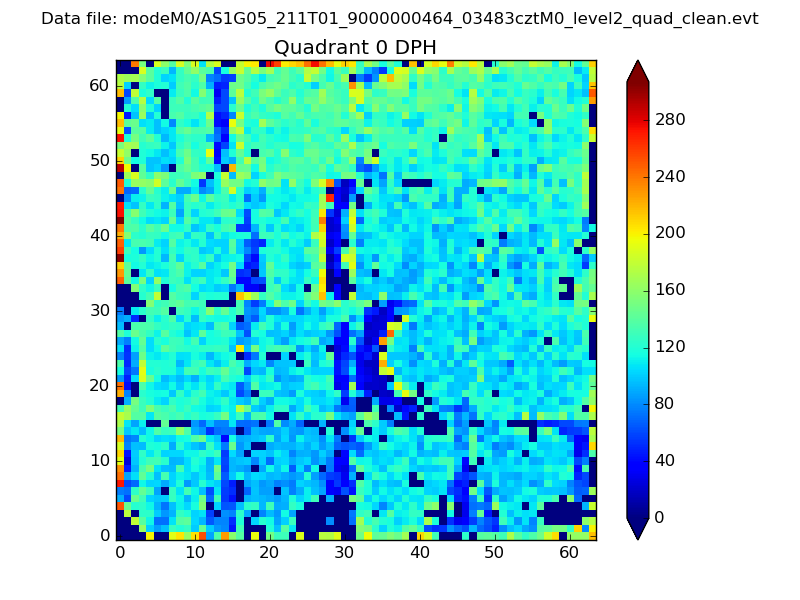 |
 |
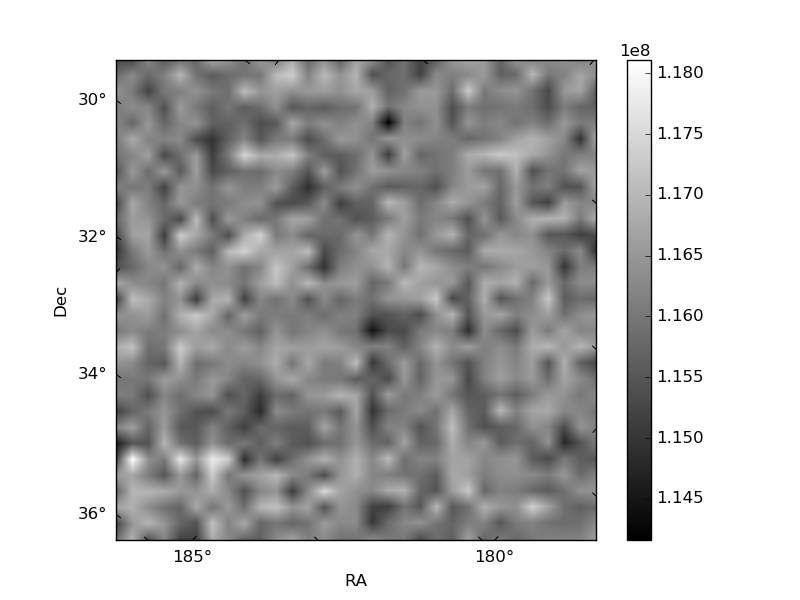
Quadrant B |
|---|---|---|---|
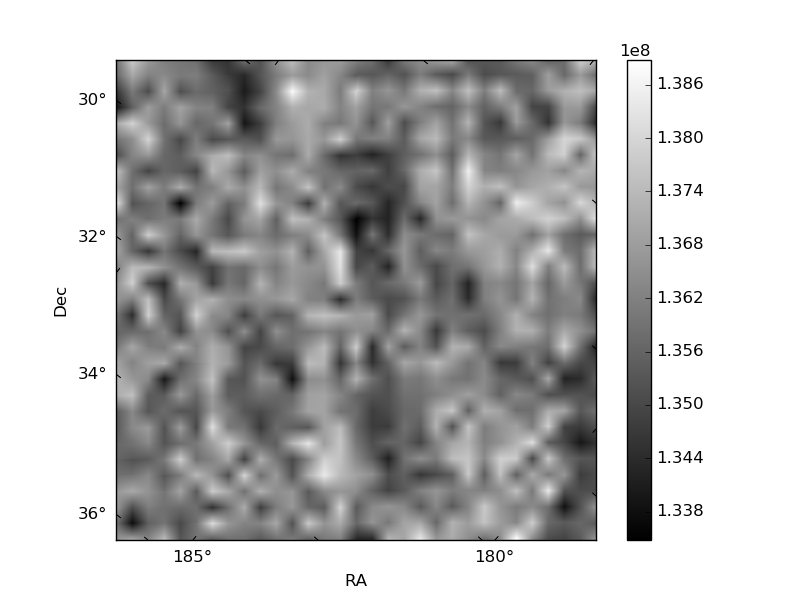
| Quadrant D | 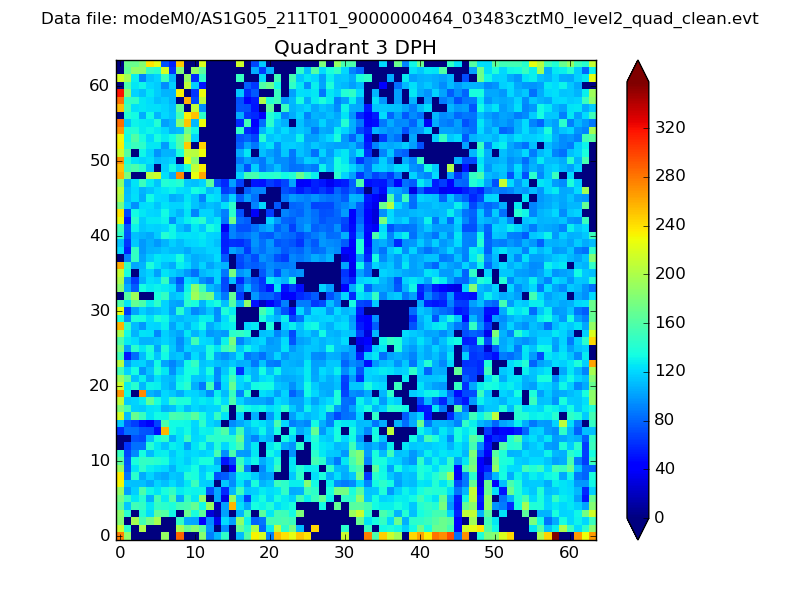 |
 |
Quadrant C |
| Plot type | Count rate plots | Images |
|---|---|---|
| Comparison with Poisson distribution Blue bars denote a histogram of data divided into 1 sec bins. Red curve is a Poisson curve with rate = median count rate of data. |
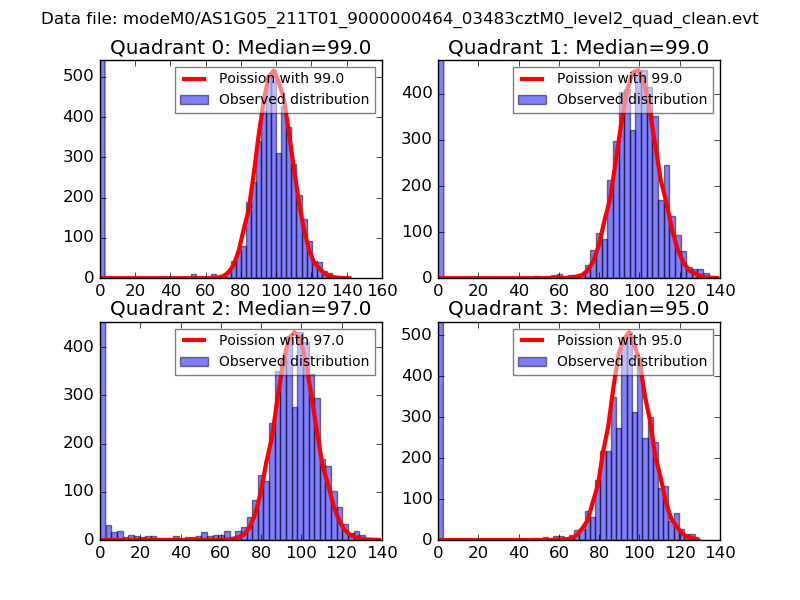 |
 |
| Quadrant-wise count rates Data is divided into 100 sec bins |
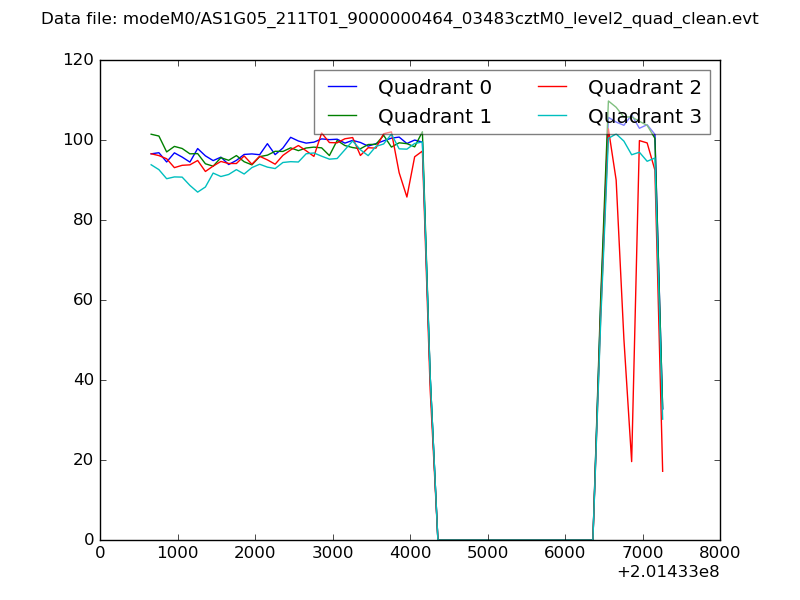 |
|
| Module-wise count rates for Quadrant A Data is divided into 100 sec bins |
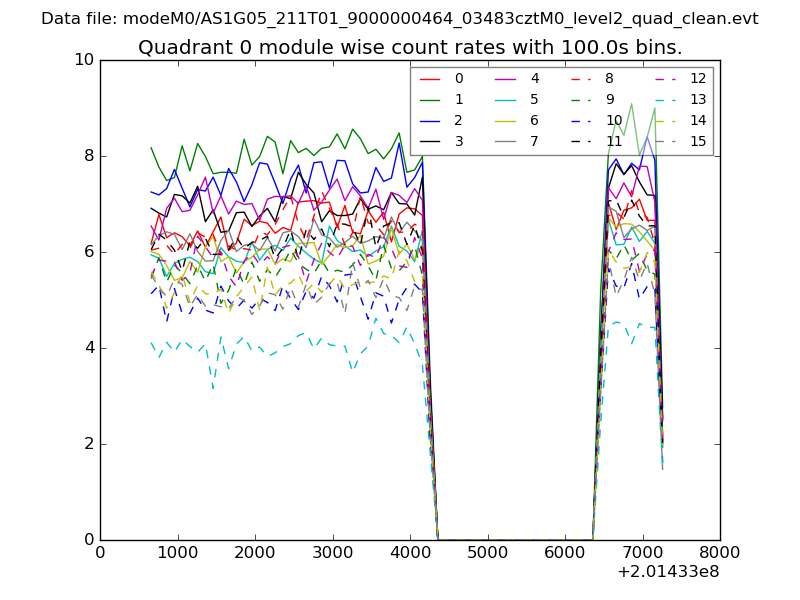 |
 |
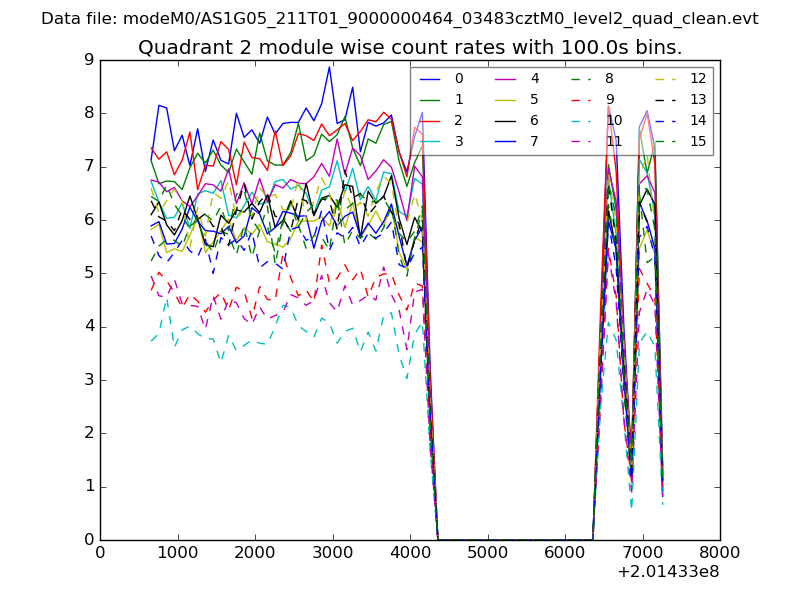
| Module-wise count rates for Quadrant B Data is divided into 100 sec bins |
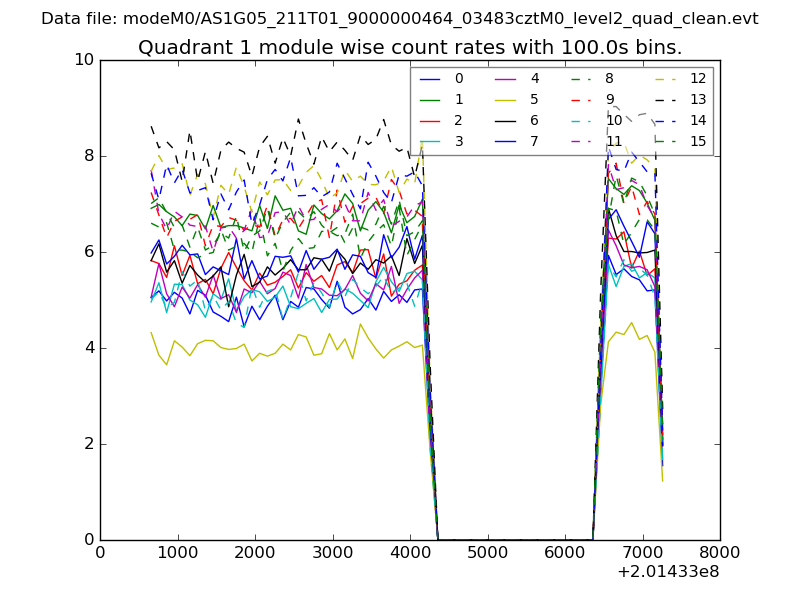 |
 |
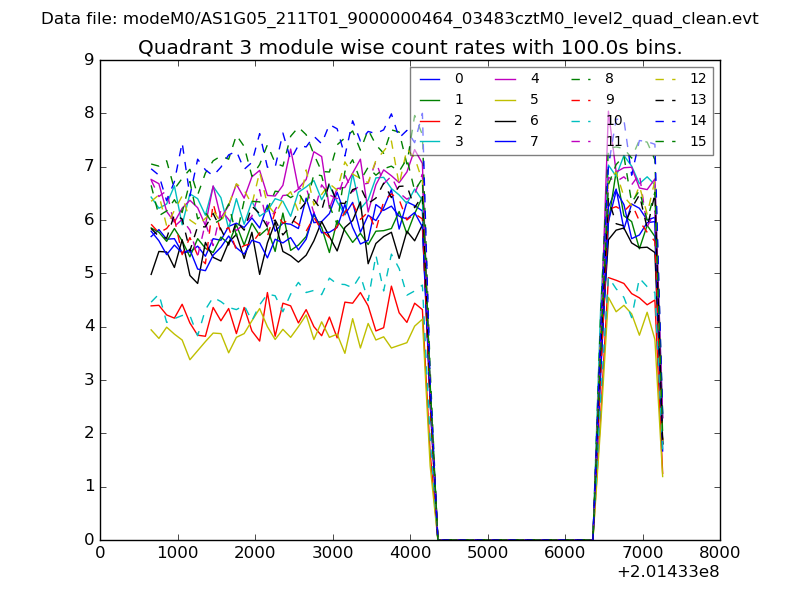
| Module-wise count rates for Quadrant C Data is divided into 100 sec bins |
 |
 |
| Module-wise count rates for Quadrant D Data is divided into 100 sec bins |
 |
 |
| Parameter | Plot |
|---|---|
| CZT HV Monitor | 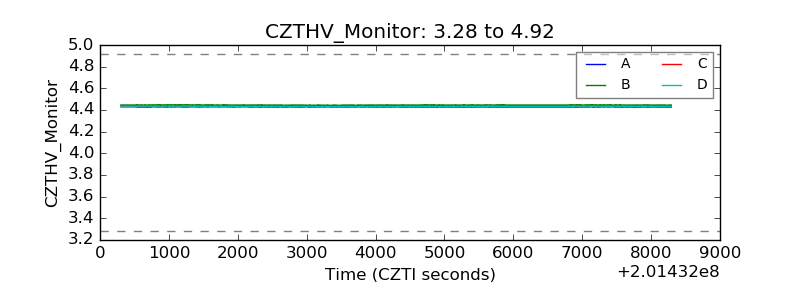 |
| D_VDD |  |
| Temperature 1 | 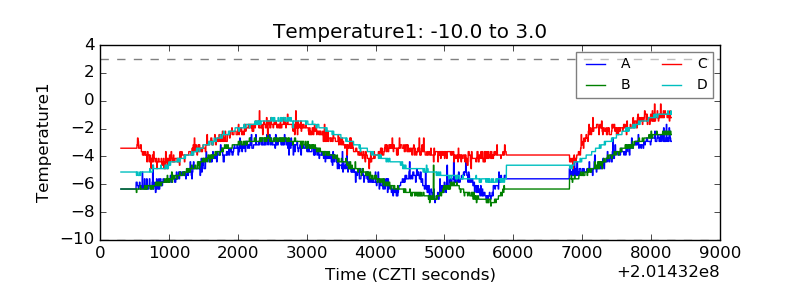 |
| Veto HV Monitor |  |
| Veto LLD | 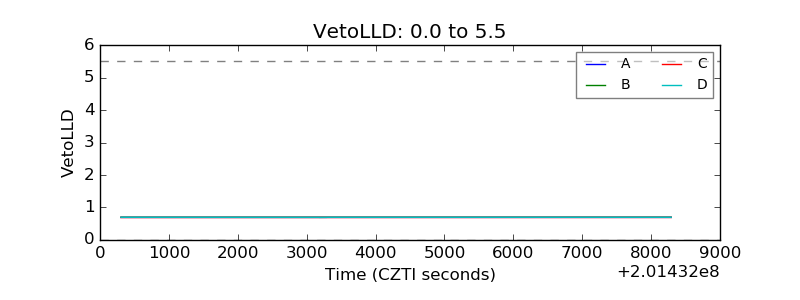 |
| Alpha Counter | 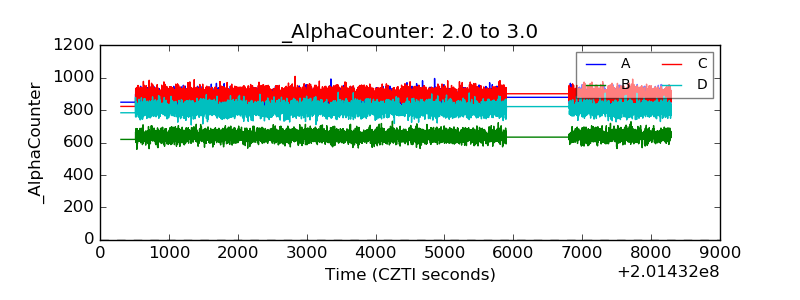 |
| _CPM_Rate | 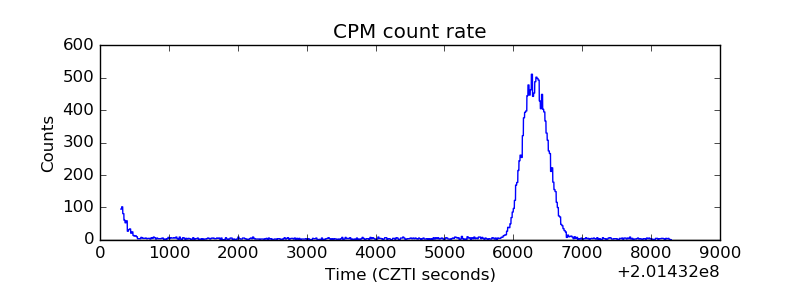 |
| CZT Counter |  |
| +2.5 Volts monitor |  |
| +5 Volts monitor |  |
| _ROLL_ROT | 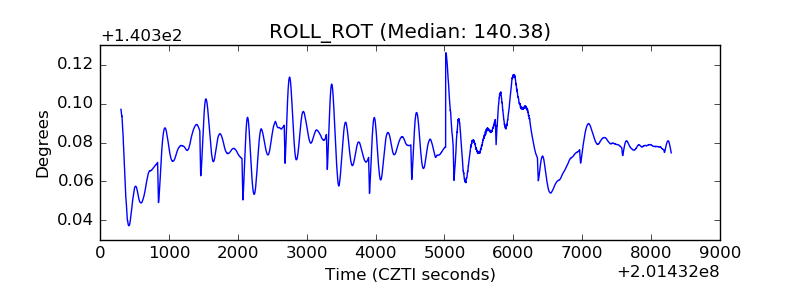 |
| _Roll_DEC | 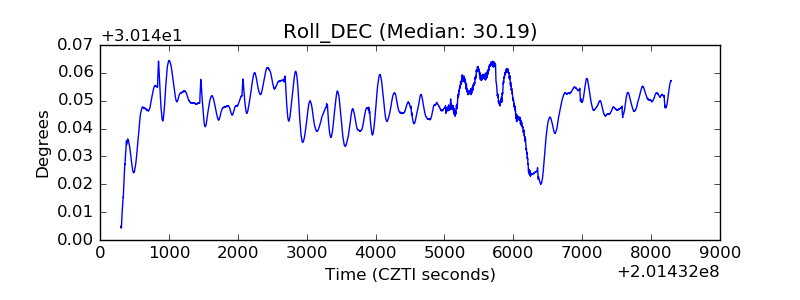 |
| _Roll_RA |  |
| Veto Counter | 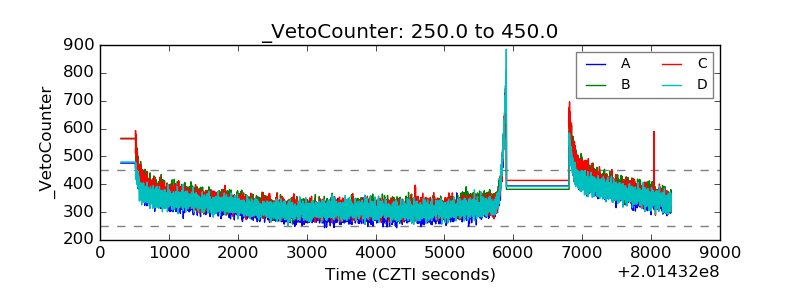 |