| Param | Original file | Final file |
|---|---|---|
| Filename | modeM0/AS1G05_211T01_9000000464_03487cztM0_level2.evt | modeM0/AS1G05_211T01_9000000464_03487cztM0_level2_quad_clean.evt |
| Size (bytes) | 518,860,800 | 87,906,240 |
| Size | 494.8 MB | 83.8 MB |
| Events in quadrant A | 3,027,722 | 569,713 |
| Events in quadrant B | 4,298,200 | 564,424 |
| Events in quadrant C | 4,687,069 | 545,761 |
| Events in quadrant D | 3,273,454 | 542,543 |
| Mode M9 | |||
|---|---|---|---|
| Quadrant | BADHDUFLAG | Total packets | Discarded packets |
| A | 0 | 13 | 0 |
| B | 0 | 13 | 0 |
| C | 0 | 13 | 0 |
| D | 0 | 14 | 0 |
| Mode M0 | |||
|---|---|---|---|
| Quadrant | BADHDUFLAG | Total packets | Discarded packets |
| A | 0 | 13326 | 3 |
| B | 0 | 17093 | 2 |
| C | 0 | 18177 | 2 |
| D | 0 | 14211 | 2 |
| Mode SS | |||
|---|---|---|---|
| Quadrant | BADHDUFLAG | Total packets | Discarded packets |
| A | 0 | 128 | 0 |
| B | 0 | 128 | 0 |
| C | 0 | 128 | 0 |
| D | 0 | 128 | 0 |
| Quadrant | Total seconds | Saturated seconds | Saturation percentage |
|---|---|---|---|
| A | 6298 | 71 | 1.127342% |
| B | 6298 | 154 | 2.445221% |
| C | 6298 | 585 | 9.288663% |
| D | 6298 | 115 | 1.825977% |
Noise dominated data is calculated using 1-second bins in cleaned event files. If a bin has >2000 counts, and if more than 50% of those come from <1% of pixels, then it is considered to be noise-dominated and hence unusable.
| Quadrant | # 1 sec bins | Bins with >0 counts | Bins with >2000 counts | High rate bins dominated by noise | Noise dominated (total time) | Noise dominated (detector-on time) | Marked lightcurve |
|---|---|---|---|---|---|---|---|
| A | 7568 | 6299 | 0 | 0 | 0.00% | 0.00% | 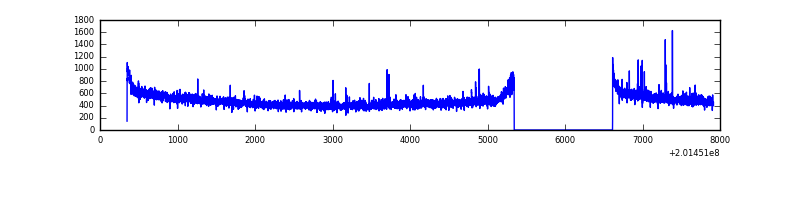 |
| B | 7568 | 6299 | 54 | 54 | 0.71% | 0.86% | 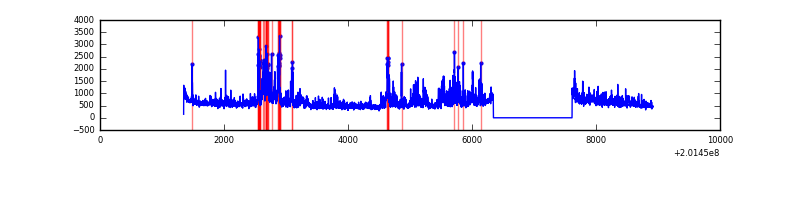 |
| C | 7568 | 6299 | 441 | 441 | 5.83% | 7.00% | 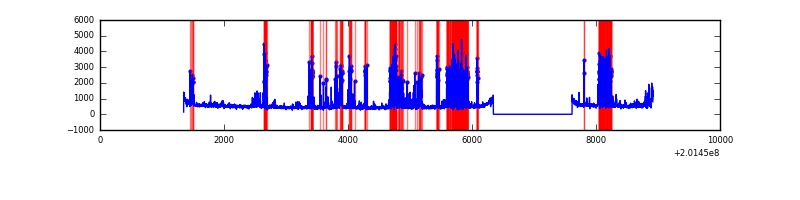 |
| D | 7568 | 6298 | 62 | 62 | 0.82% | 0.98% | 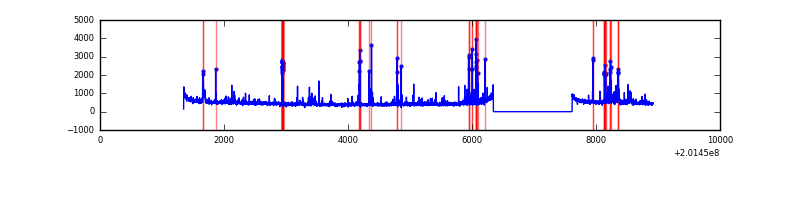 |
Top three noisy pixels from each quadrant. If the there are fewer than three noisy pixels in the level2.evt file, extra rows are filled as -1
| Pixel properties | Quadrant properties | ||||||
|---|---|---|---|---|---|---|---|
| Quadrant | DetID | PixID | Counts | Sigma | Mean | Median | Sigma |
| A | 0 | 118 | 28860 | 179.58 | 772 | 758 | 156.5 |
| A | 0 | 226 | 10615 | 62.99 | 772 | 758 | 156.5 |
| A | 12 | 194 | 8415 | 48.93 | 772 | 758 | 156.5 |
| B | 8 | 3 | 556962 | 3769.46 | 773 | 755 | 147.6 |
| B | 15 | 204 | 366465 | 2478.45 | 773 | 755 | 147.6 |
| B | 15 | 85 | 270860 | 1830.53 | 773 | 755 | 147.6 |
| C | 7 | 220 | 1569268 | 9385.04 | 722 | 727 | 167.1 |
| C | 1 | 192 | 195903 | 1167.8 | 722 | 727 | 167.1 |
| C | 1 | 16 | 69084 | 409.0 | 722 | 727 | 167.1 |
| D | 13 | 239 | 104206 | 571.97 | 750 | 729 | 180.9 |
| D | 14 | 34 | 99863 | 547.97 | 750 | 729 | 180.9 |
| D | 10 | 172 | 56839 | 310.15 | 750 | 729 | 180.9 |
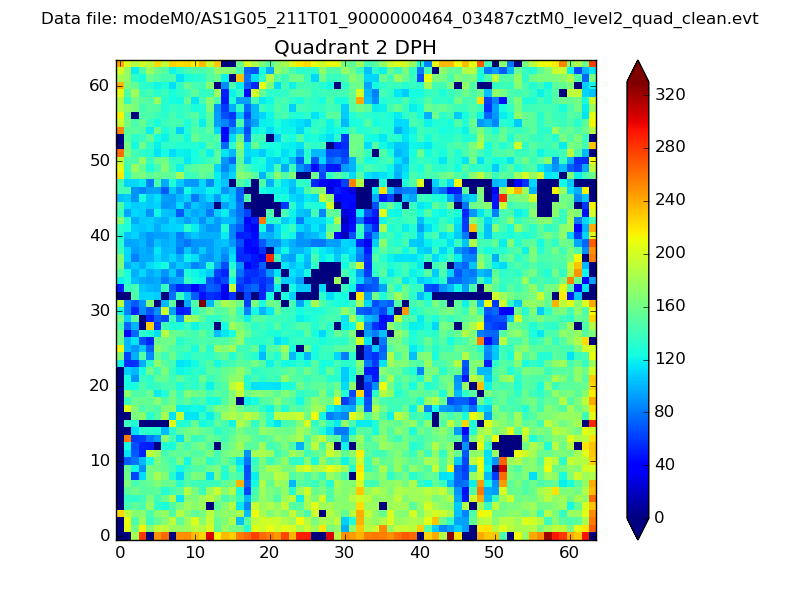
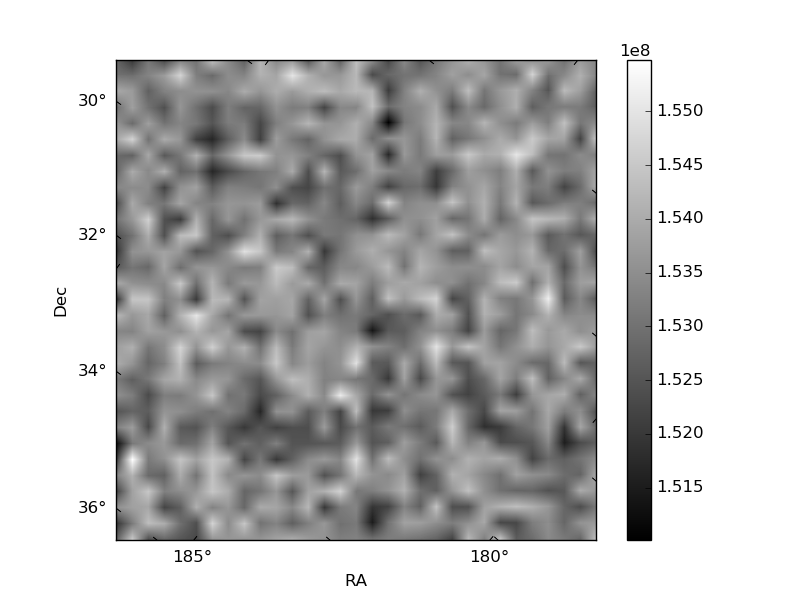
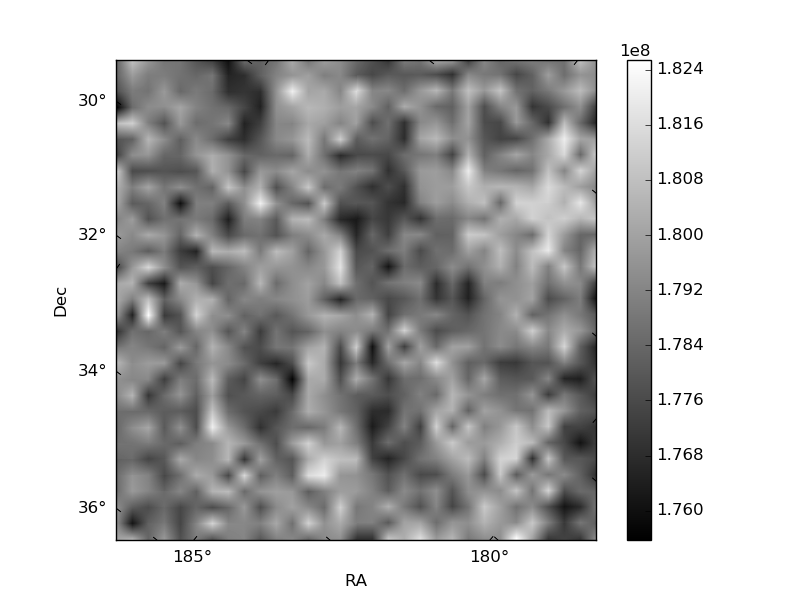
Histogram calculated using DETX and DETY for each event in the final _common_clean file
| Quadrant A | 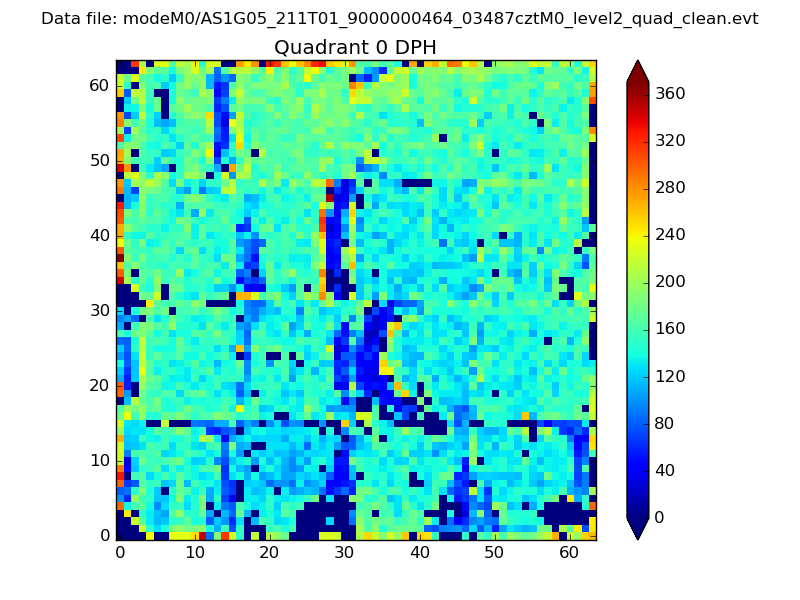 |
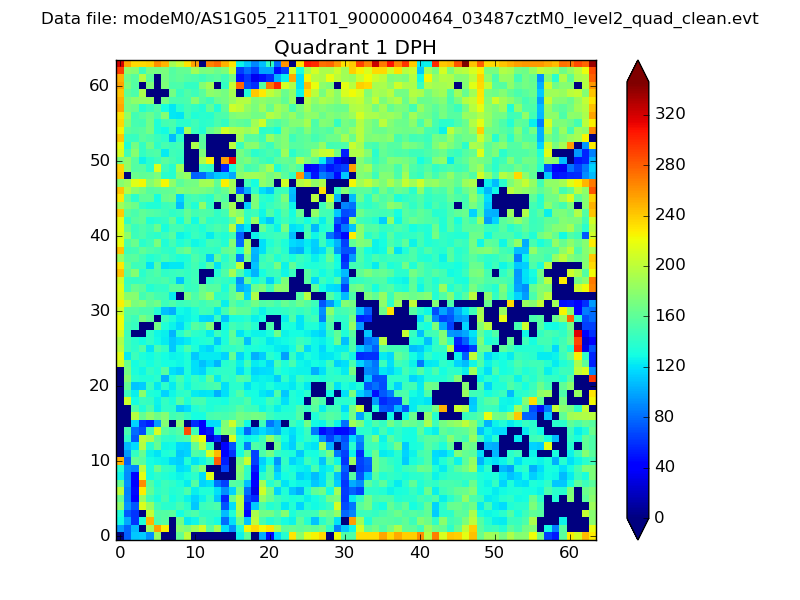 |
Quadrant B |
|---|---|---|---|
| Quadrant D | 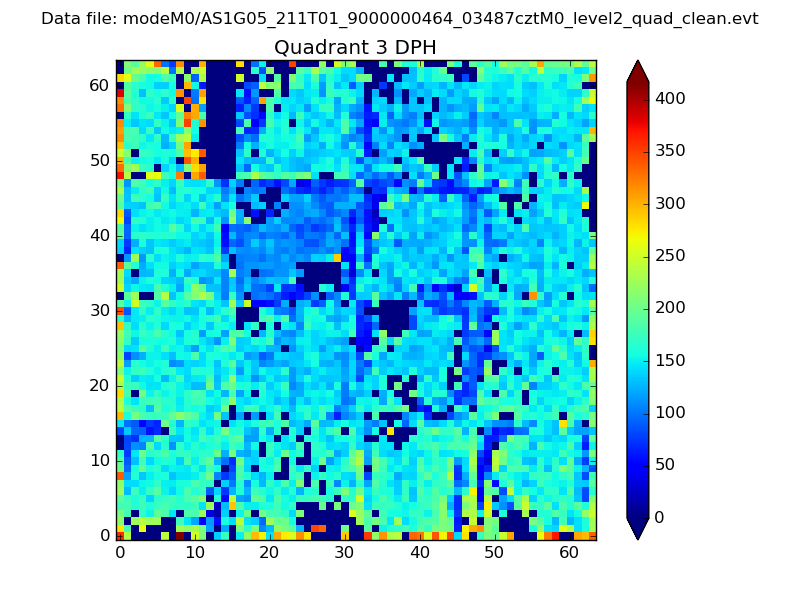 |
 |
Quadrant C |
| Plot type | Count rate plots | Images |
|---|---|---|
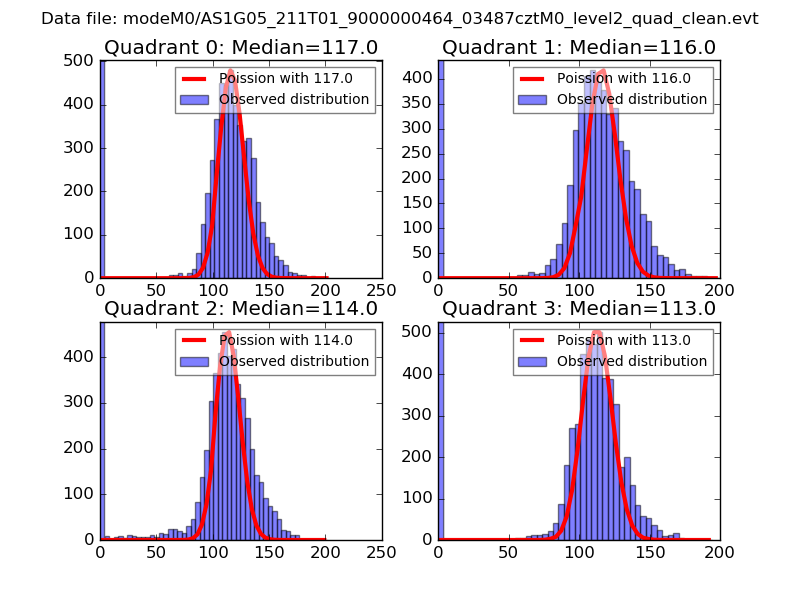
| Comparison with Poisson distribution Blue bars denote a histogram of data divided into 1 sec bins. Red curve is a Poisson curve with rate = median count rate of data. |
 |
 |
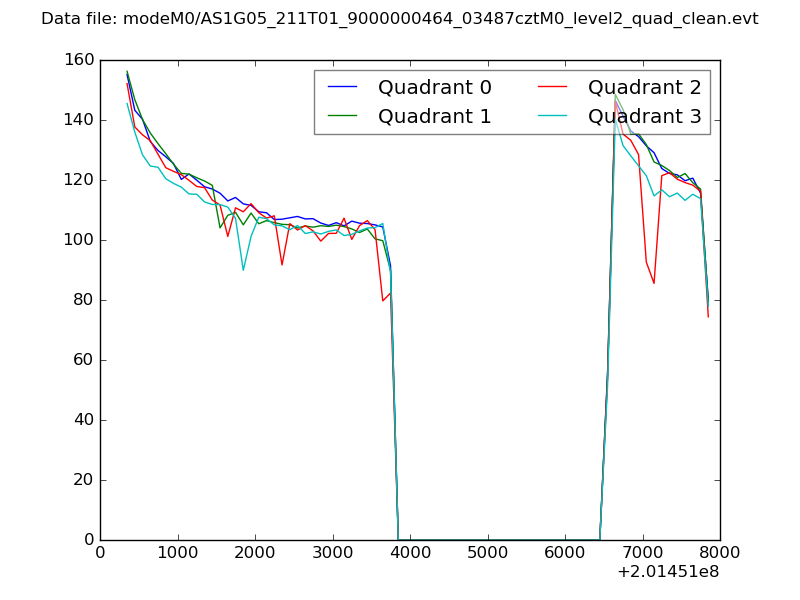
| Quadrant-wise count rates Data is divided into 100 sec bins |
 |
|
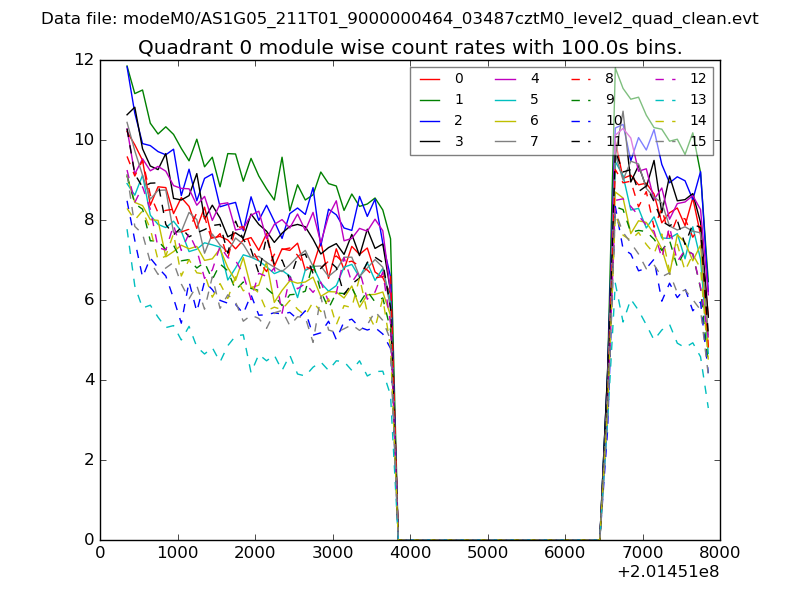
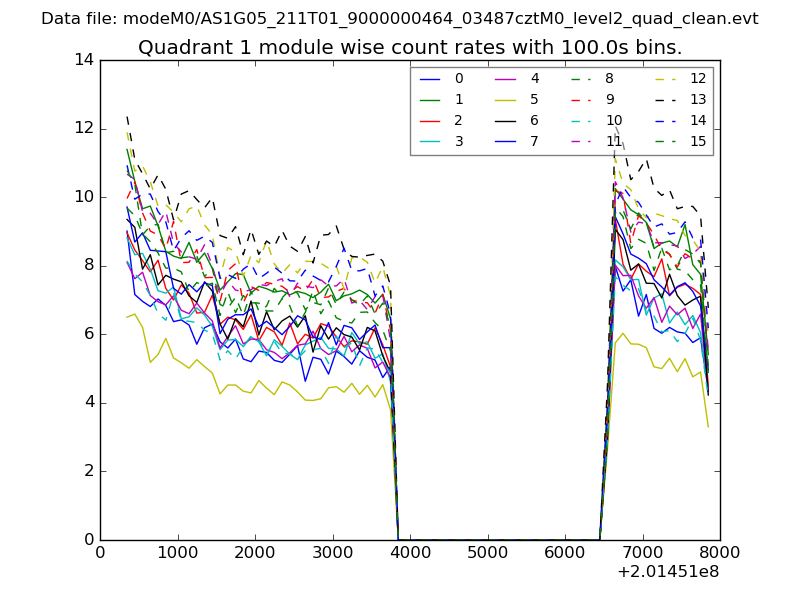
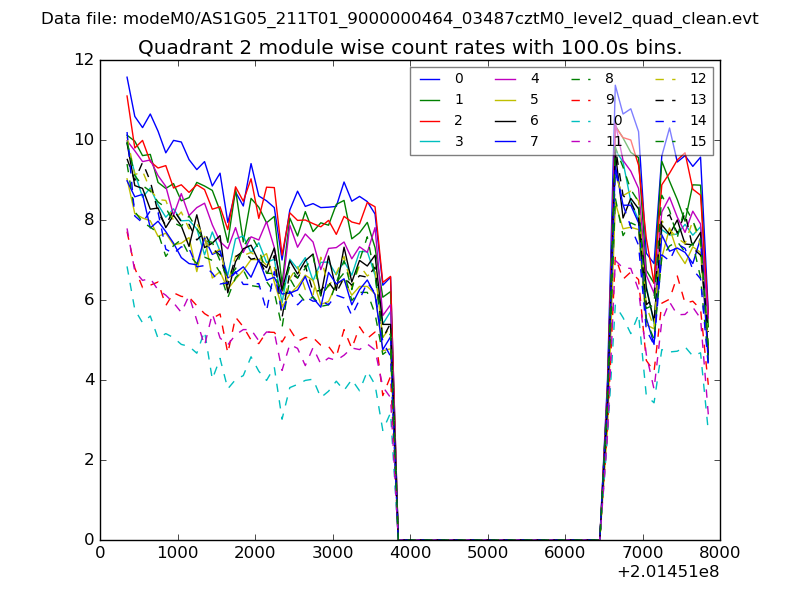
| Module-wise count rates for Quadrant A Data is divided into 100 sec bins |
 |
 |
| Module-wise count rates for Quadrant B Data is divided into 100 sec bins |
 |
 |
| Module-wise count rates for Quadrant C Data is divided into 100 sec bins |
 |
 |
| Module-wise count rates for Quadrant D Data is divided into 100 sec bins |
 |
 |
| Parameter | Plot |
|---|---|
| CZT HV Monitor |  |
| D_VDD | 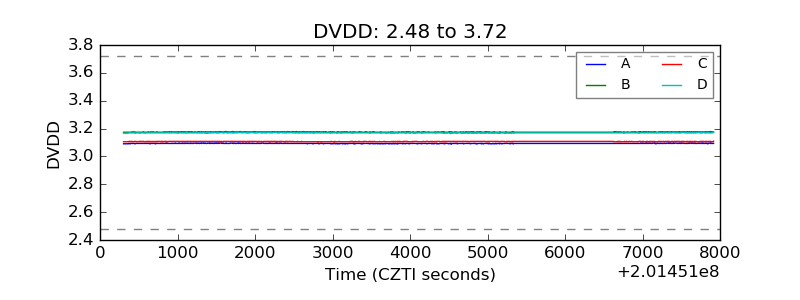 |
| Temperature 1 | 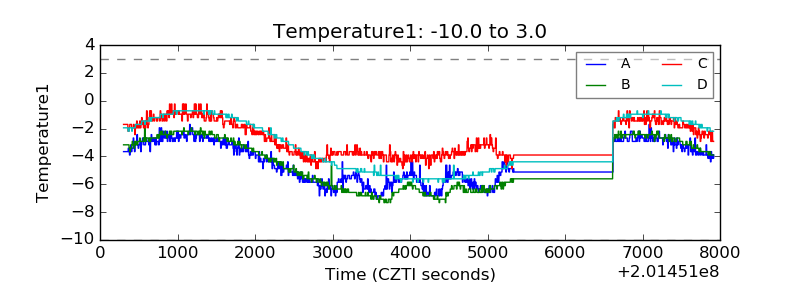 |
| Veto HV Monitor | 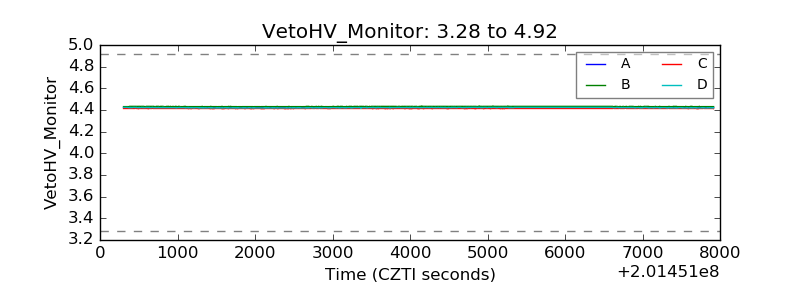 |
| Veto LLD | 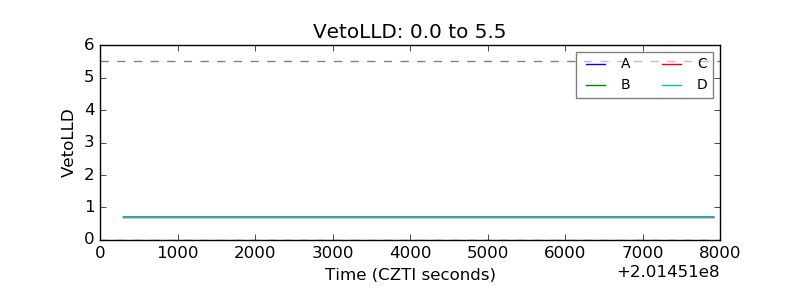 |
| Alpha Counter | 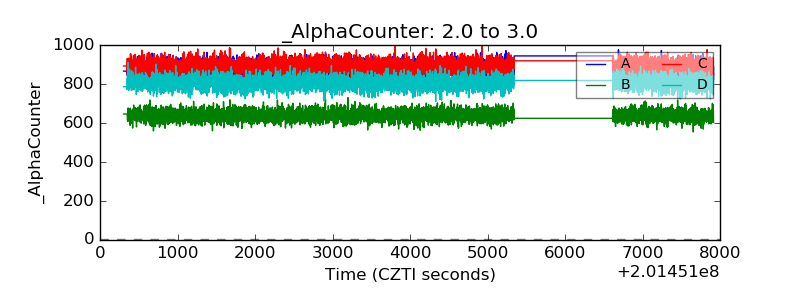 |
| _CPM_Rate | 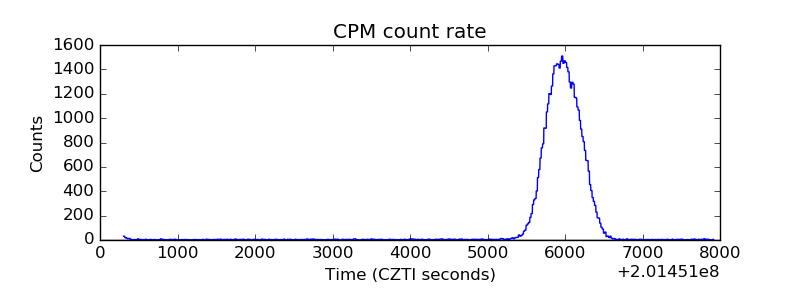 |
| CZT Counter | 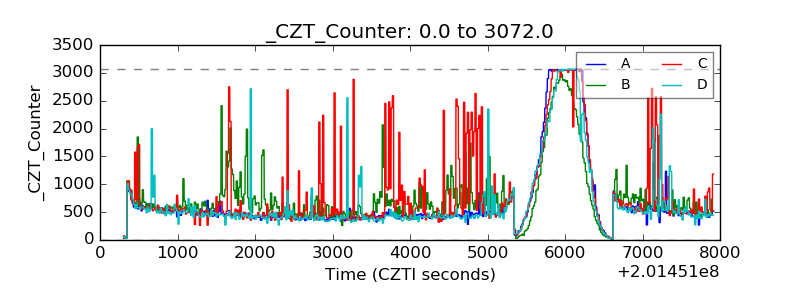 |
| +2.5 Volts monitor |  |
| +5 Volts monitor |  |
| _ROLL_ROT | 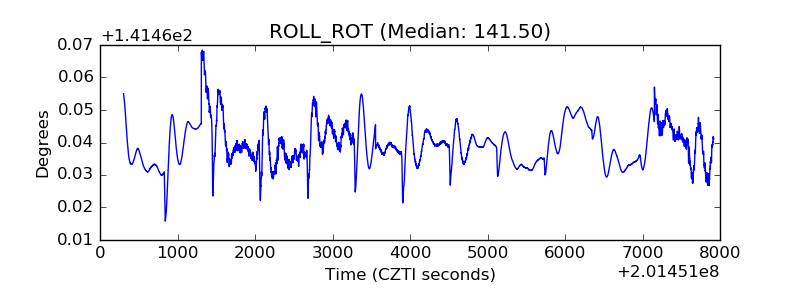 |
| _Roll_DEC | 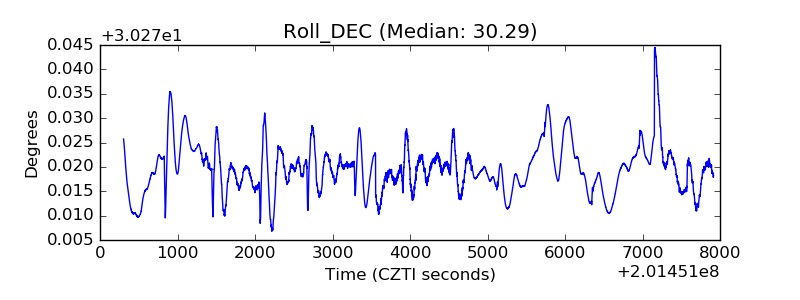 |
| _Roll_RA | 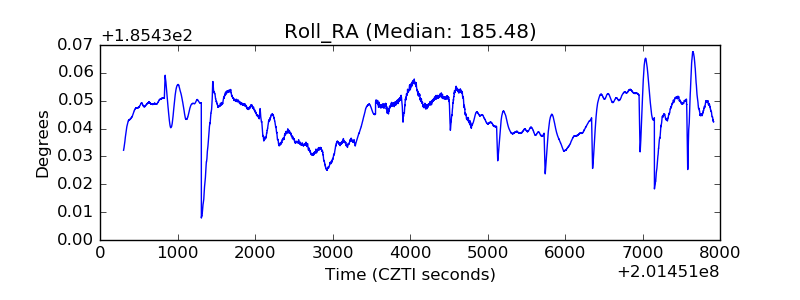 |
| Veto Counter | 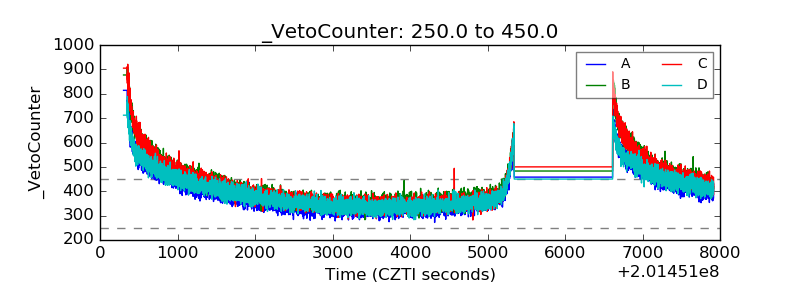 |