| Param | Original file | Final file |
|---|---|---|
| Filename | modeM0/AS1G05_211T01_9000000464_03488cztM0_level2.evt | modeM0/AS1G05_211T01_9000000464_03488cztM0_level2_quad_clean.evt |
| Size (bytes) | 505,031,040 | 81,489,600 |
| Size | 481.6 MB | 77.7 MB |
| Events in quadrant A | 3,303,034 | 520,657 |
| Events in quadrant B | 3,555,587 | 521,845 |
| Events in quadrant C | 4,835,065 | 489,683 |
| Events in quadrant D | 3,175,754 | 497,851 |
| Mode M9 | |||
|---|---|---|---|
| Quadrant | BADHDUFLAG | Total packets | Discarded packets |
| A | 0 | 13 | 0 |
| B | 0 | 13 | 0 |
| C | 0 | 13 | 0 |
| D | 0 | 14 | 0 |
| Mode M0 | |||
|---|---|---|---|
| Quadrant | BADHDUFLAG | Total packets | Discarded packets |
| A | 0 | 14070 | 3 |
| B | 0 | 14788 | 2 |
| C | 0 | 18716 | 2 |
| D | 0 | 13901 | 2 |
| Mode SS | |||
|---|---|---|---|
| Quadrant | BADHDUFLAG | Total packets | Discarded packets |
| A | 0 | 126 | 0 |
| B | 0 | 126 | 0 |
| C | 0 | 126 | 0 |
| D | 0 | 126 | 0 |
| Quadrant | Total seconds | Saturated seconds | Saturation percentage |
|---|---|---|---|
| A | 6274 | 137 | 2.183615% |
| B | 6274 | 76 | 1.211348% |
| C | 6274 | 515 | 8.208479% |
| D | 6274 | 90 | 1.434492% |
Noise dominated data is calculated using 1-second bins in cleaned event files. If a bin has >2000 counts, and if more than 50% of those come from <1% of pixels, then it is considered to be noise-dominated and hence unusable.
| Quadrant | # 1 sec bins | Bins with >0 counts | Bins with >2000 counts | High rate bins dominated by noise | Noise dominated (total time) | Noise dominated (detector-on time) | Marked lightcurve |
|---|---|---|---|---|---|---|---|
| A | 7579 | 6275 | 52 | 52 | 0.69% | 0.83% | 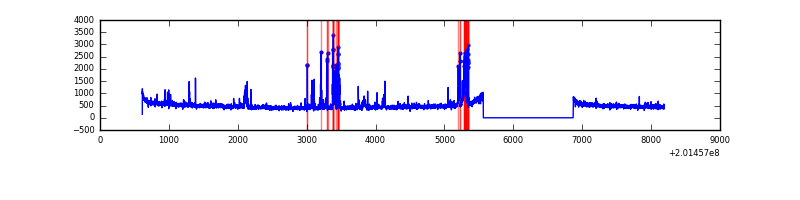 |
| B | 7579 | 6275 | 4 | 4 | 0.05% | 0.06% | 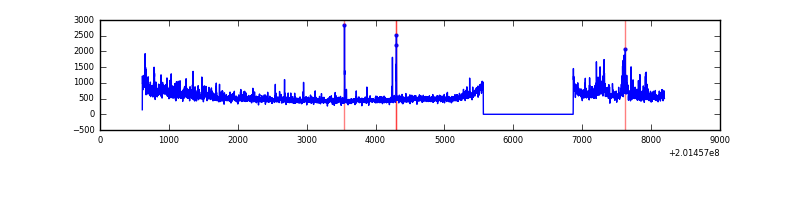 |
| C | 7579 | 6274 | 406 | 406 | 5.36% | 6.47% | 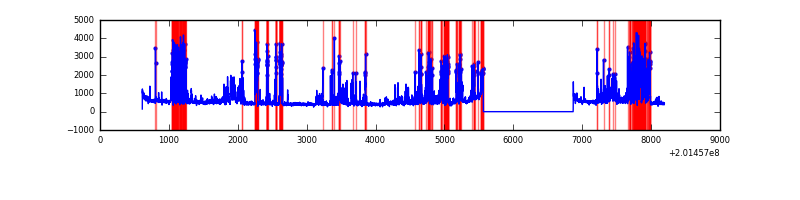 |
| D | 7579 | 6275 | 36 | 36 | 0.47% | 0.57% |  |
Top three noisy pixels from each quadrant. If the there are fewer than three noisy pixels in the level2.evt file, extra rows are filled as -1
| Pixel properties | Quadrant properties | ||||||
|---|---|---|---|---|---|---|---|
| Quadrant | DetID | PixID | Counts | Sigma | Mean | Median | Sigma |
| A | 0 | 118 | 184846 | 1197.94 | 758 | 745 | 153.7 |
| A | 0 | 50 | 170218 | 1102.76 | 758 | 745 | 153.7 |
| A | 0 | 226 | 24977 | 157.68 | 758 | 745 | 153.7 |
| B | 15 | 204 | 438375 | 2979.34 | 768 | 750 | 146.9 |
| B | 8 | 3 | 34332 | 228.63 | 768 | 750 | 146.9 |
| B | 4 | 81 | 26306 | 173.98 | 768 | 750 | 146.9 |
| C | 7 | 220 | 1950740 | 11721.66 | 718 | 722 | 166.4 |
| C | 1 | 16 | 25573 | 149.38 | 718 | 722 | 166.4 |
| C | 1 | 192 | 17934 | 103.46 | 718 | 722 | 166.4 |
| D | 14 | 34 | 126372 | 708.07 | 741 | 723 | 177.5 |
| D | 13 | 239 | 75948 | 423.91 | 741 | 723 | 177.5 |
| D | 2 | 37 | 39865 | 220.58 | 741 | 723 | 177.5 |
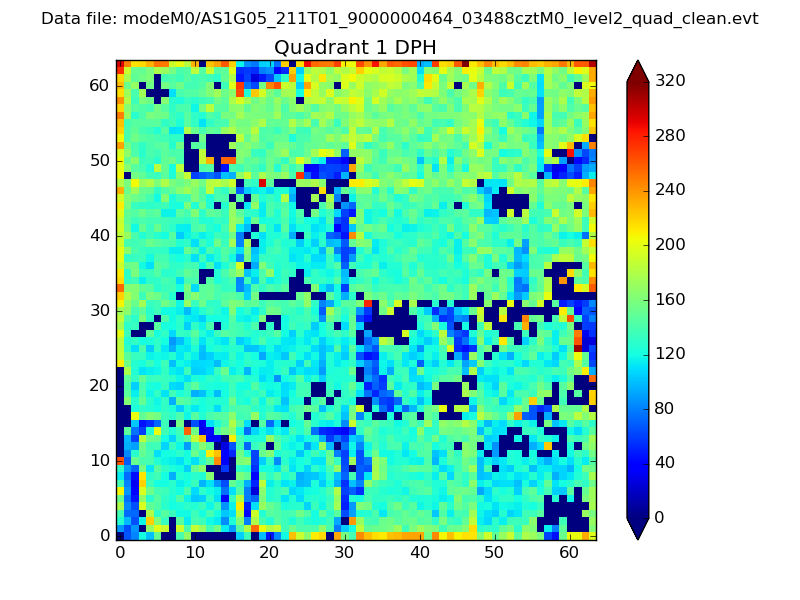
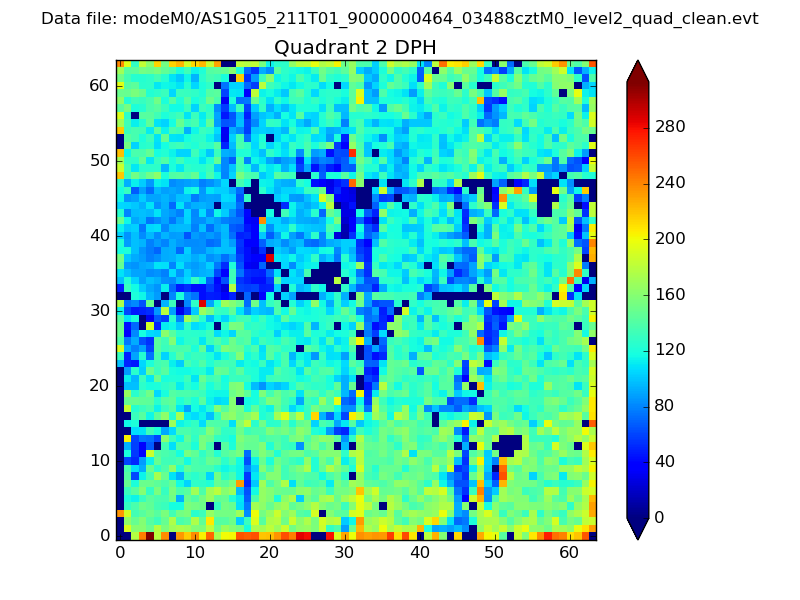
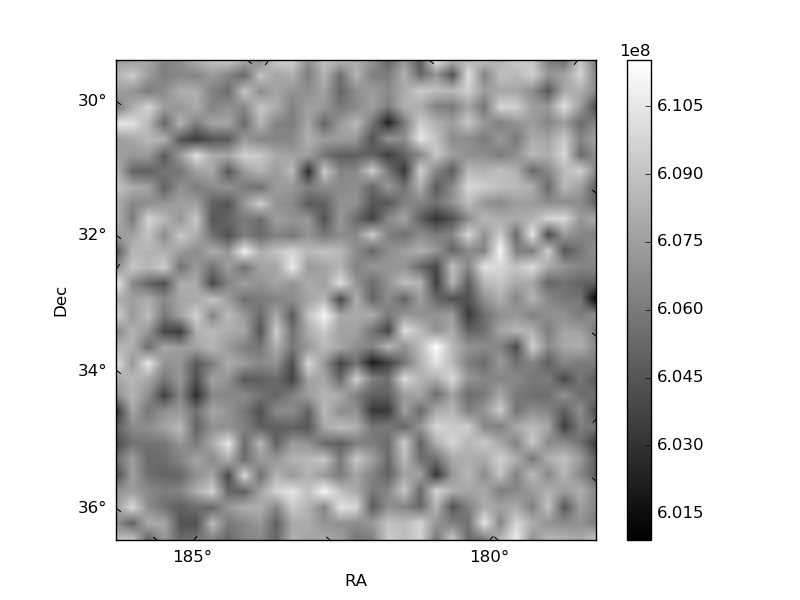
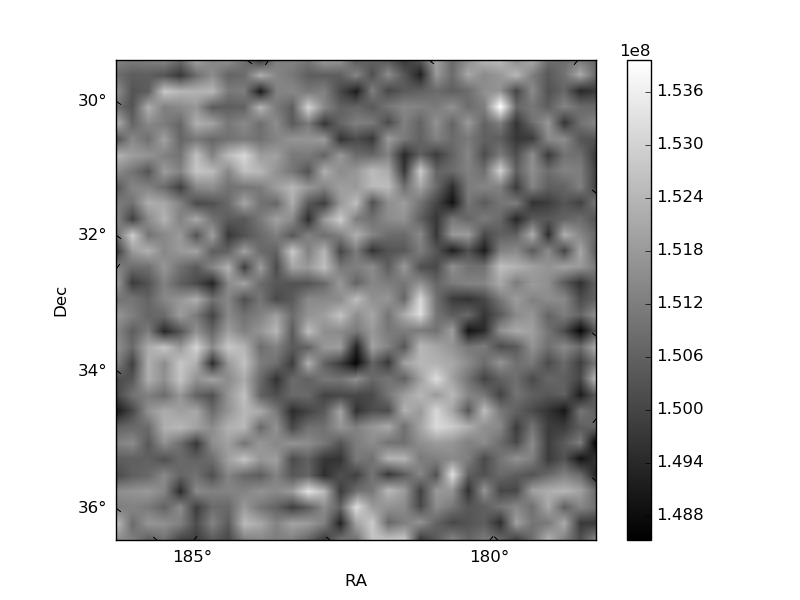
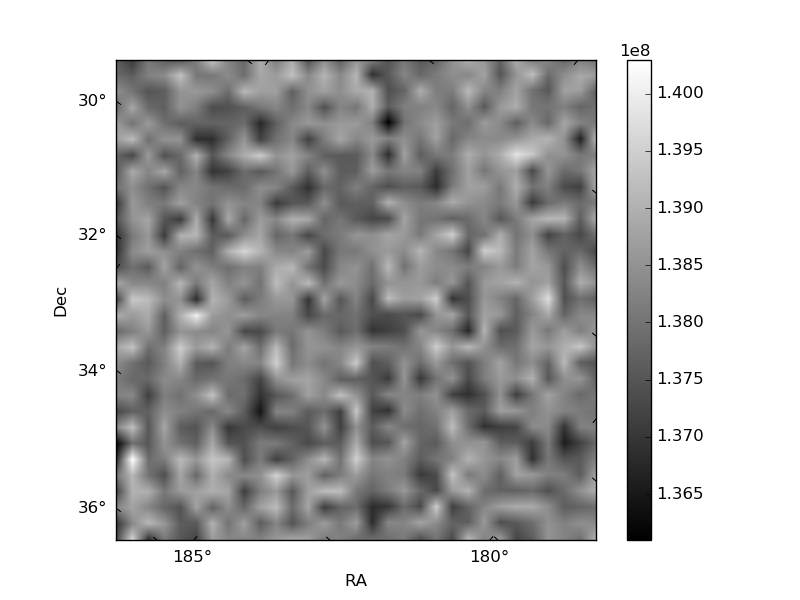
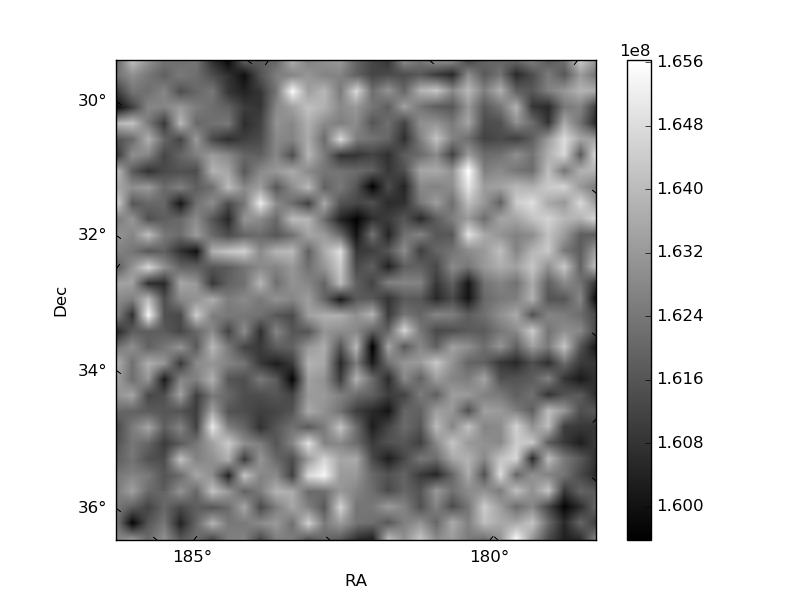
Histogram calculated using DETX and DETY for each event in the final _common_clean file
| Quadrant A | 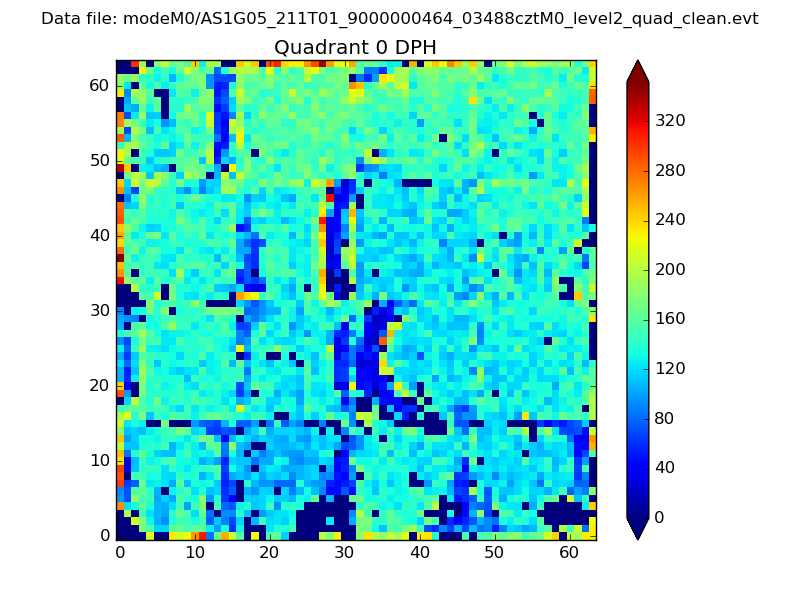 |
 |
Quadrant B |
|---|---|---|---|
| Quadrant D | 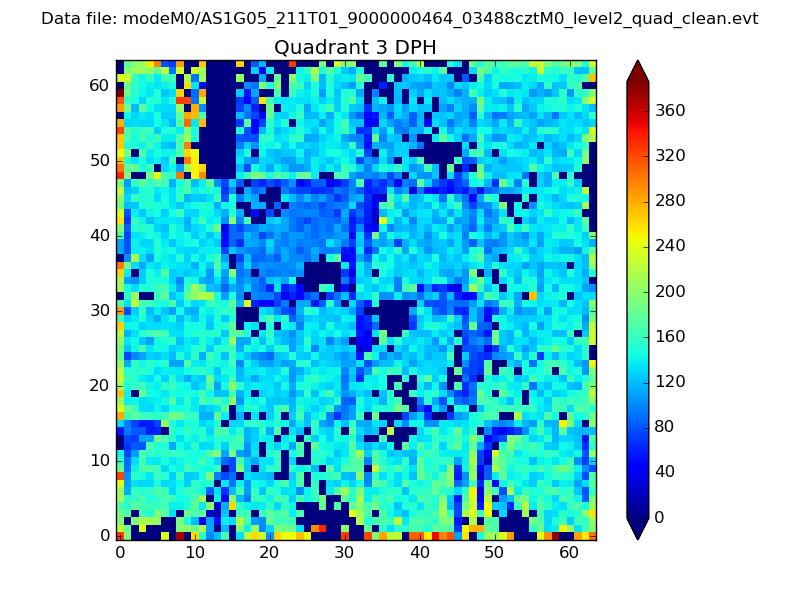 |
 |
Quadrant C |
| Plot type | Count rate plots | Images |
|---|---|---|
| Comparison with Poisson distribution Blue bars denote a histogram of data divided into 1 sec bins. Red curve is a Poisson curve with rate = median count rate of data. |
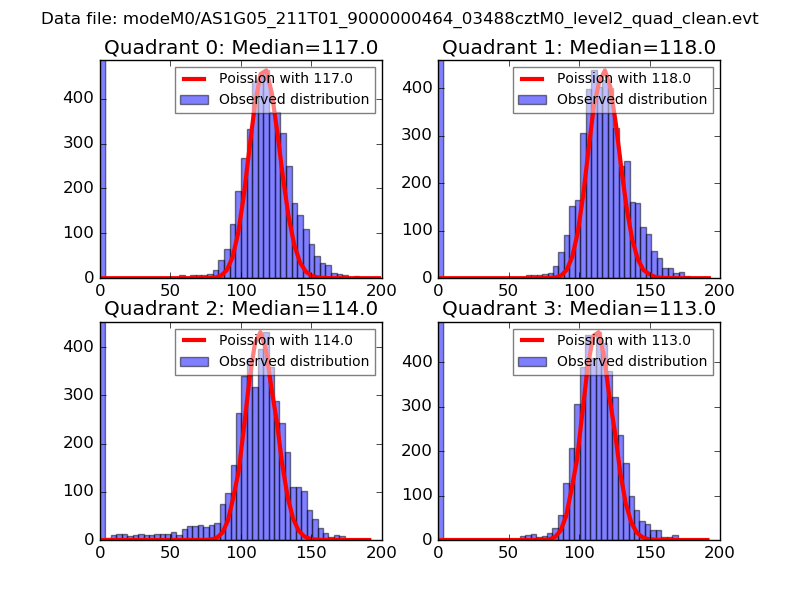 |
 |
| Quadrant-wise count rates Data is divided into 100 sec bins |
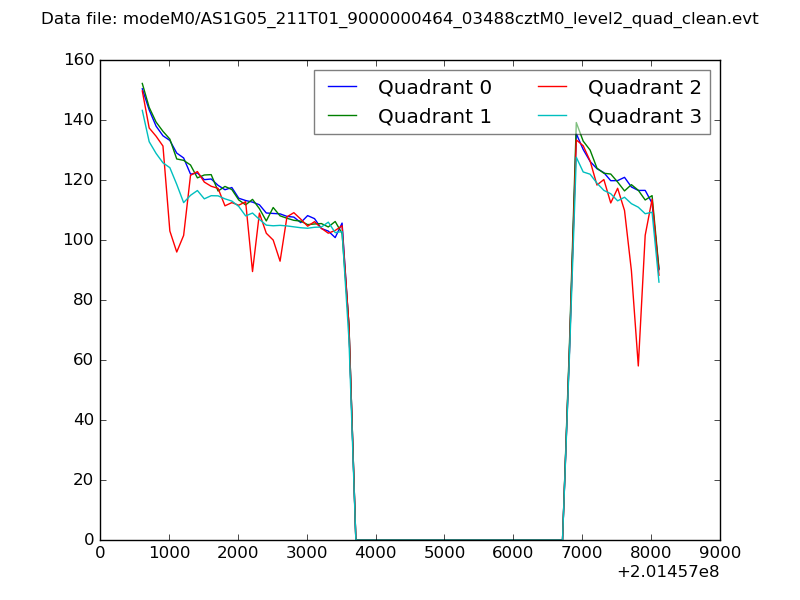 |
|
| Module-wise count rates for Quadrant A Data is divided into 100 sec bins |
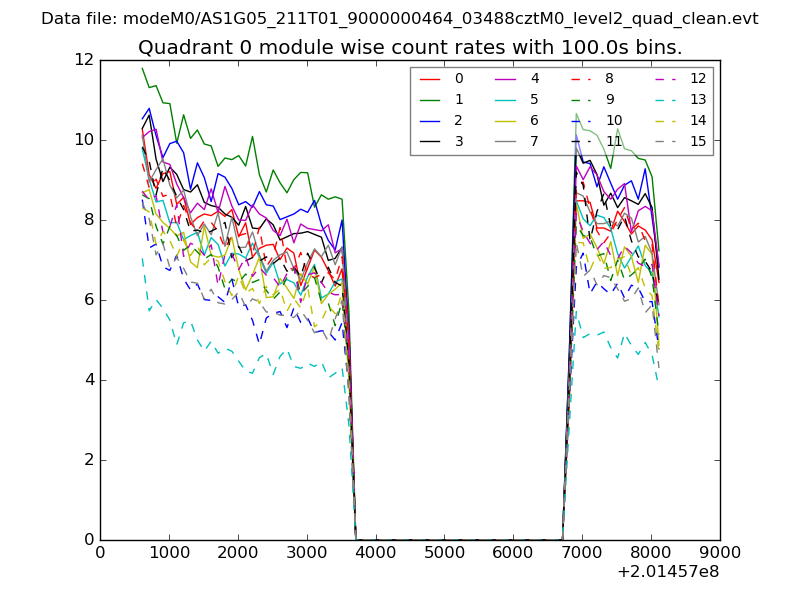 |
 |
| Module-wise count rates for Quadrant B Data is divided into 100 sec bins |
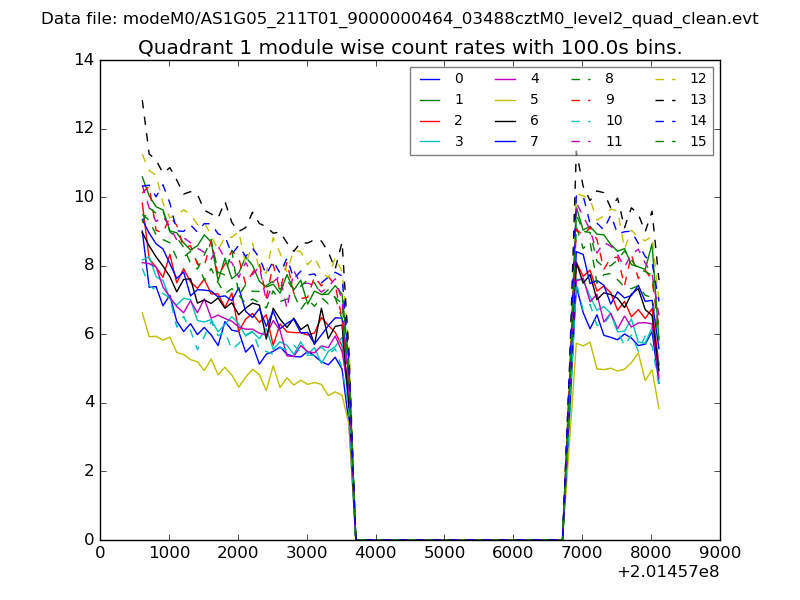 |
 |
| Module-wise count rates for Quadrant C Data is divided into 100 sec bins |
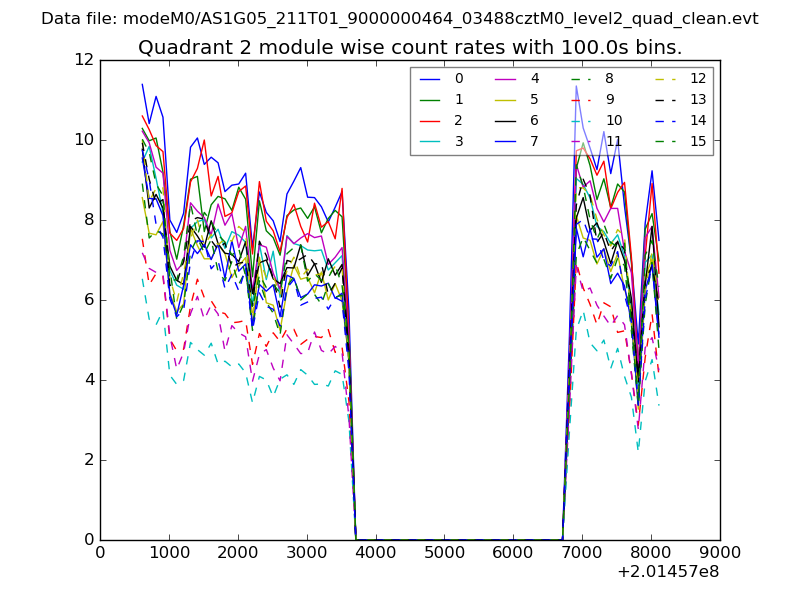 |
 |
| Module-wise count rates for Quadrant D Data is divided into 100 sec bins |
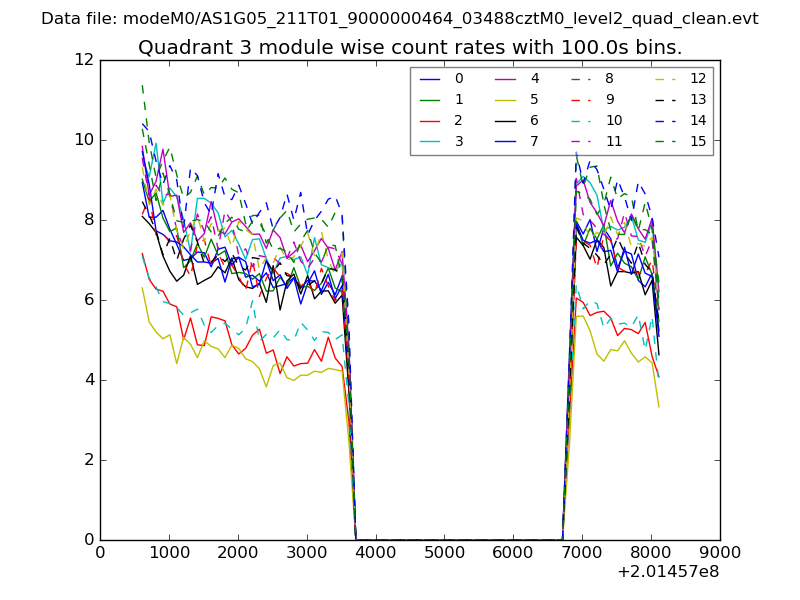 |
 |
| Parameter | Plot |
|---|---|
| CZT HV Monitor | 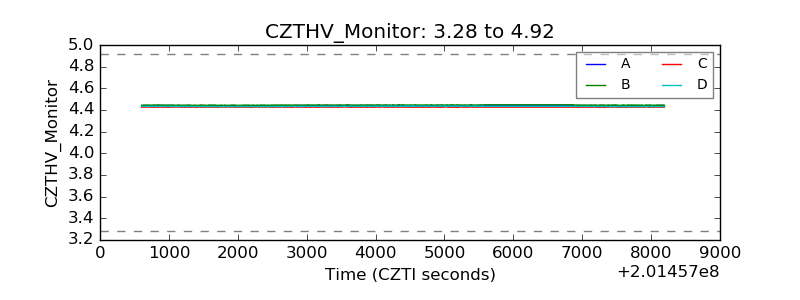 |
| D_VDD | 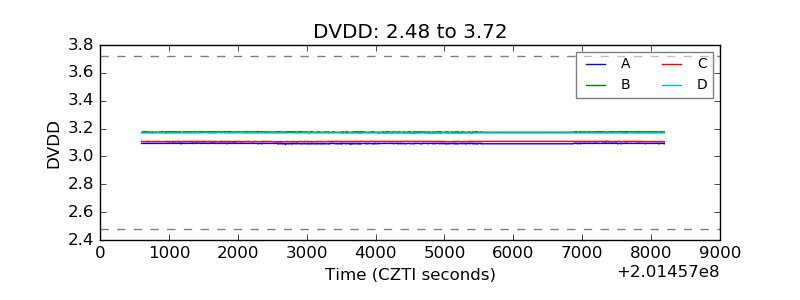 |
| Temperature 1 | 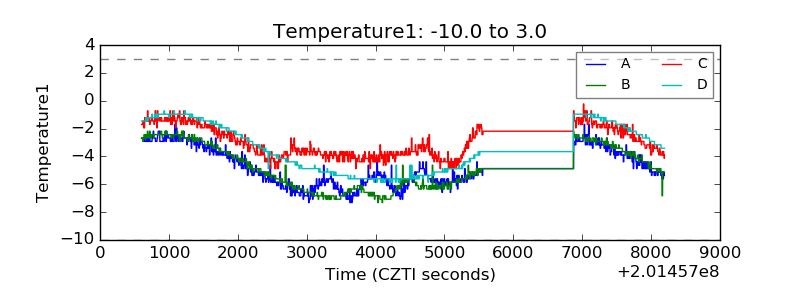 |
| Veto HV Monitor | 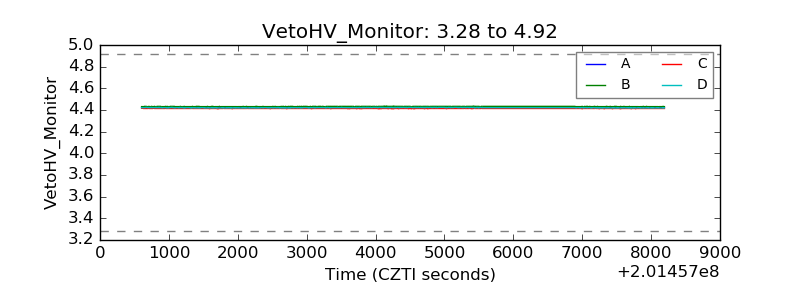 |
| Veto LLD | 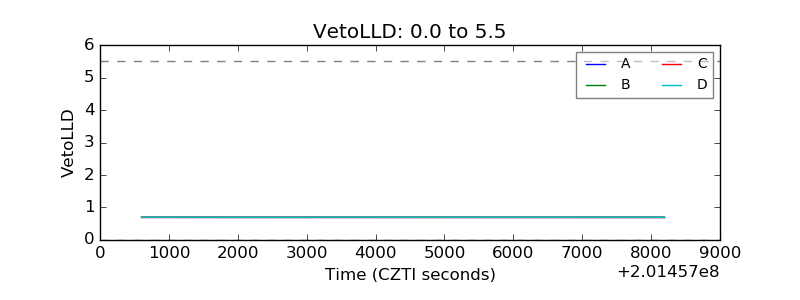 |
| Alpha Counter | 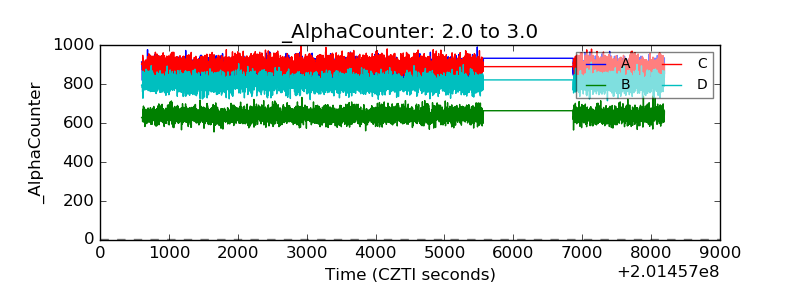 |
| _CPM_Rate | 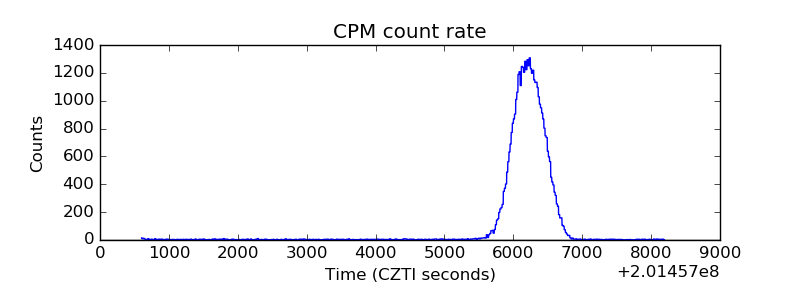 |
| CZT Counter | 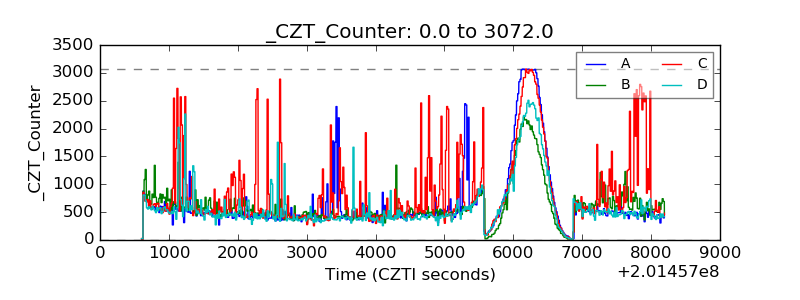 |
| +2.5 Volts monitor |  |
| +5 Volts monitor |  |
| _ROLL_ROT | 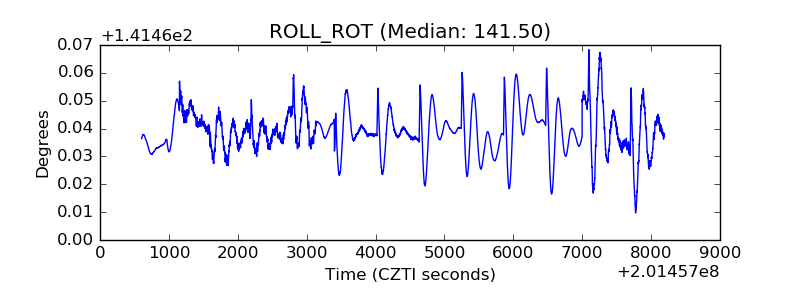 |
| _Roll_DEC | 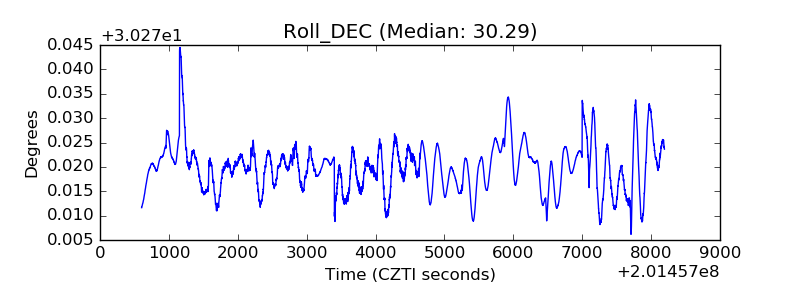 |
| _Roll_RA |  |
| Veto Counter | 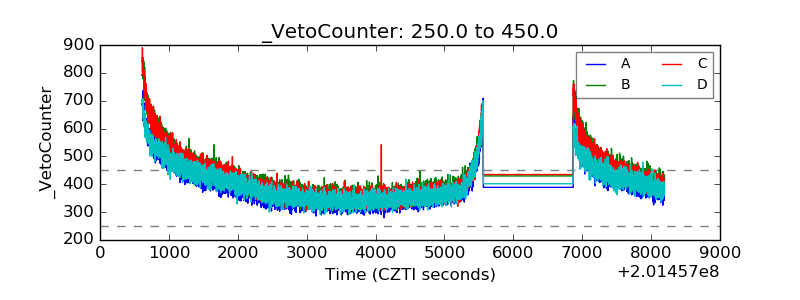 |