| Param | Original file | Final file |
|---|---|---|
| Filename | modeM0/AS1G05_211T01_9000000464_03489cztM0_level2.evt | modeM0/AS1G05_211T01_9000000464_03489cztM0_level2_quad_clean.evt |
| Size (bytes) | 473,777,280 | 74,485,440 |
| Size | 451.8 MB | 71.0 MB |
| Events in quadrant A | 3,162,618 | 462,264 |
| Events in quadrant B | 3,414,682 | 465,245 |
| Events in quadrant C | 4,455,343 | 443,887 |
| Events in quadrant D | 2,889,039 | 445,374 |
| Mode M9 | |||
|---|---|---|---|
| Quadrant | BADHDUFLAG | Total packets | Discarded packets |
| A | 0 | 12 | 0 |
| B | 0 | 12 | 0 |
| C | 0 | 12 | 0 |
| D | 0 | 13 | 0 |
| Mode M0 | |||
|---|---|---|---|
| Quadrant | BADHDUFLAG | Total packets | Discarded packets |
| A | 0 | 13794 | 3 |
| B | 0 | 14399 | 2 |
| C | 0 | 17487 | 2 |
| D | 0 | 13205 | 2 |
| Mode SS | |||
|---|---|---|---|
| Quadrant | BADHDUFLAG | Total packets | Discarded packets |
| A | 0 | 130 | 0 |
| B | 0 | 130 | 0 |
| C | 0 | 130 | 0 |
| D | 0 | 130 | 0 |
| Quadrant | Total seconds | Saturated seconds | Saturation percentage |
|---|---|---|---|
| A | 6275 | 87 | 1.386454% |
| B | 6275 | 34 | 0.541833% |
| C | 6275 | 329 | 5.243028% |
| D | 6275 | 32 | 0.509960% |
Noise dominated data is calculated using 1-second bins in cleaned event files. If a bin has >2000 counts, and if more than 50% of those come from <1% of pixels, then it is considered to be noise-dominated and hence unusable.
| Quadrant | # 1 sec bins | Bins with >0 counts | Bins with >2000 counts | High rate bins dominated by noise | Noise dominated (total time) | Noise dominated (detector-on time) | Marked lightcurve |
|---|---|---|---|---|---|---|---|
| A | 7550 | 6276 | 39 | 39 | 0.52% | 0.62% |  |
| B | 7550 | 6275 | 1 | 1 | 0.01% | 0.02% | 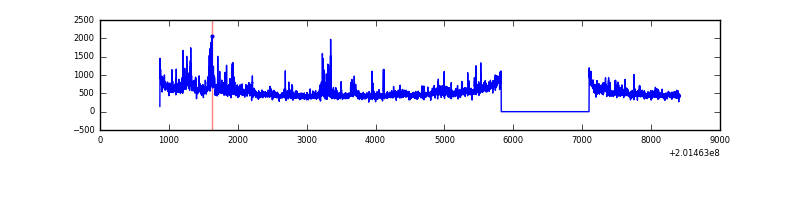 |
| C | 7550 | 6276 | 299 | 299 | 3.96% | 4.76% | 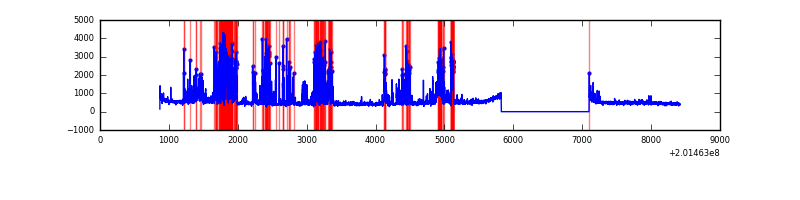 |
| D | 7550 | 6276 | 11 | 11 | 0.15% | 0.18% | 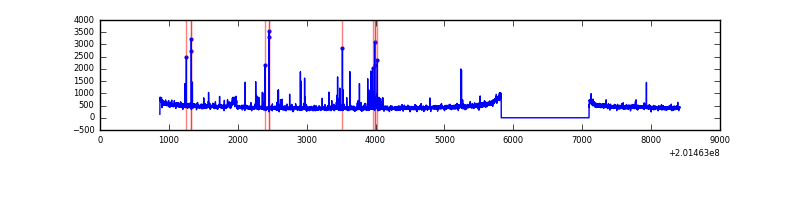 |
Top three noisy pixels from each quadrant. If the there are fewer than three noisy pixels in the level2.evt file, extra rows are filled as -1
| Pixel properties | Quadrant properties | ||||||
|---|---|---|---|---|---|---|---|
| Quadrant | DetID | PixID | Counts | Sigma | Mean | Median | Sigma |
| A | 0 | 50 | 323553 | 2166.71 | 732 | 716 | 149.0 |
| A | 8 | 15 | 12441 | 78.69 | 732 | 716 | 149.0 |
| A | 0 | 226 | 8194 | 50.18 | 732 | 716 | 149.0 |
| B | 15 | 204 | 401195 | 2810.73 | 745 | 728 | 142.5 |
| B | 2 | 249 | 45417 | 313.66 | 745 | 728 | 142.5 |
| B | 15 | 85 | 29910 | 204.82 | 745 | 728 | 142.5 |
| C | 7 | 220 | 1486766 | 9010.82 | 707 | 712 | 164.9 |
| C | 1 | 16 | 88606 | 532.95 | 707 | 712 | 164.9 |
| C | 1 | 192 | 71574 | 429.68 | 707 | 712 | 164.9 |
| D | 13 | 239 | 54841 | 311.44 | 717 | 695 | 173.9 |
| D | 5 | 233 | 37644 | 212.52 | 717 | 695 | 173.9 |
| D | 13 | 223 | 36358 | 205.13 | 717 | 695 | 173.9 |
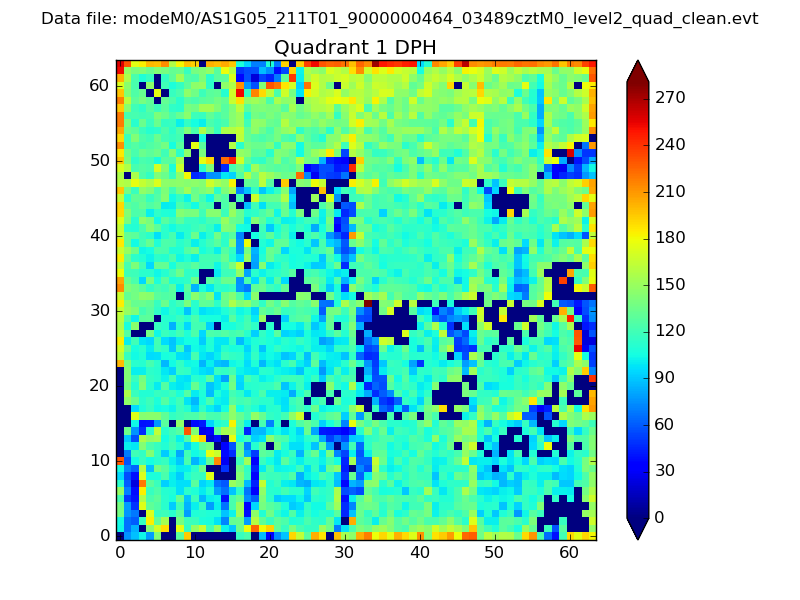
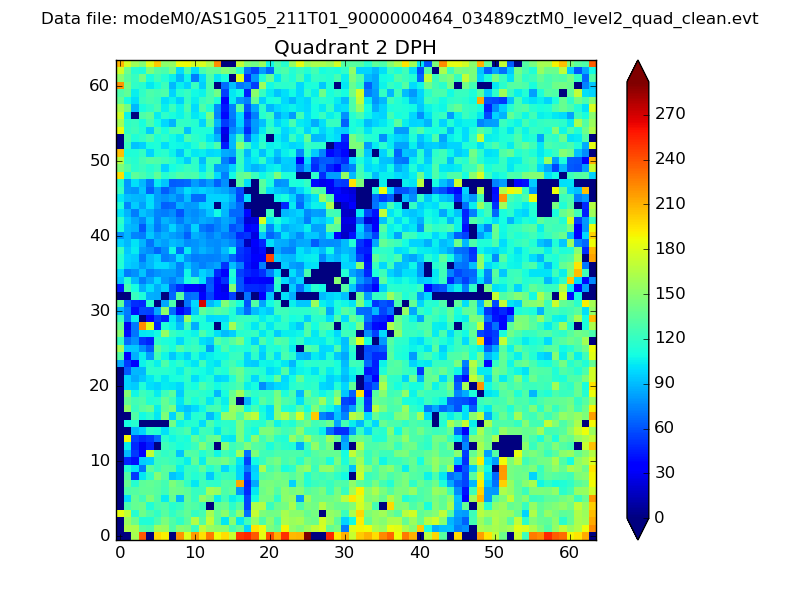
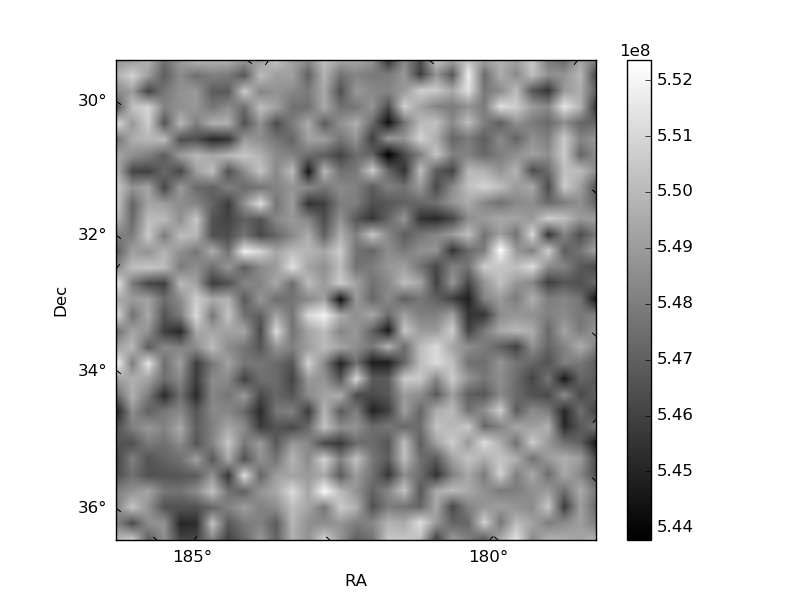
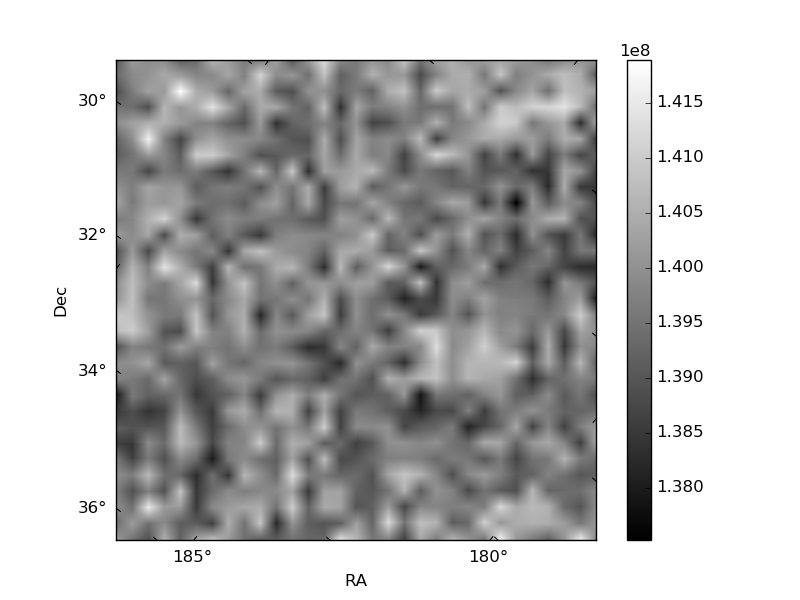
Histogram calculated using DETX and DETY for each event in the final _common_clean file
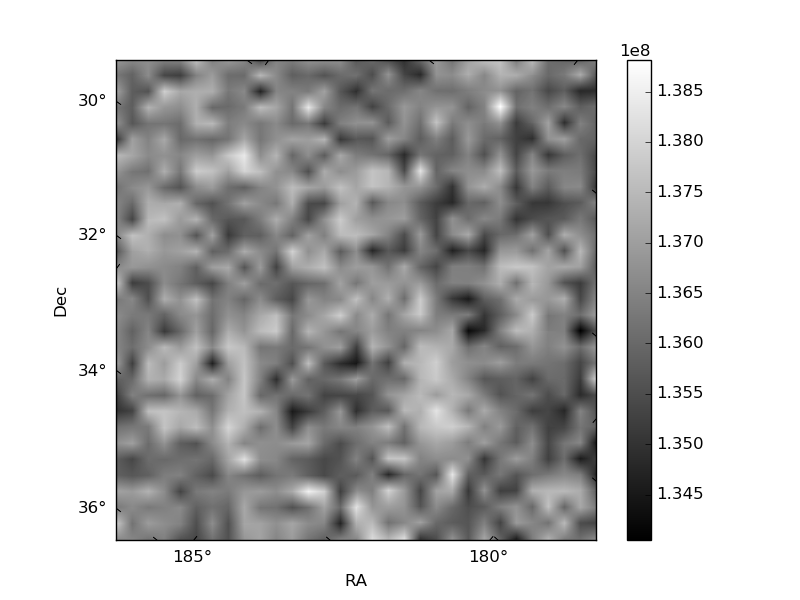
| Quadrant A | 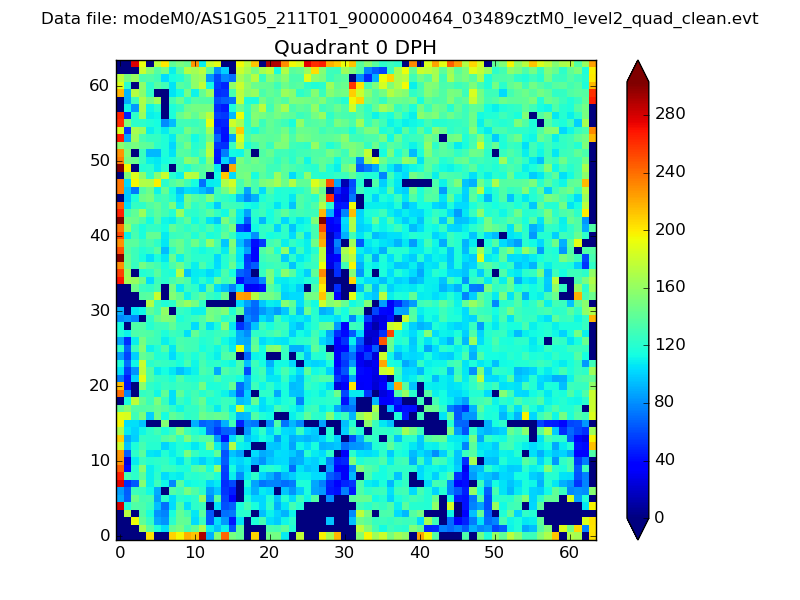 |
 |
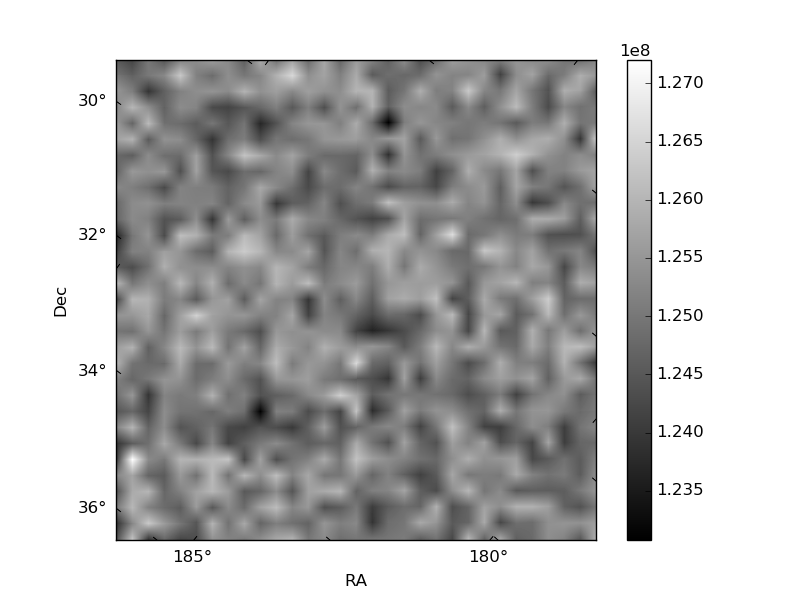
Quadrant B |
|---|---|---|---|
| Quadrant D | 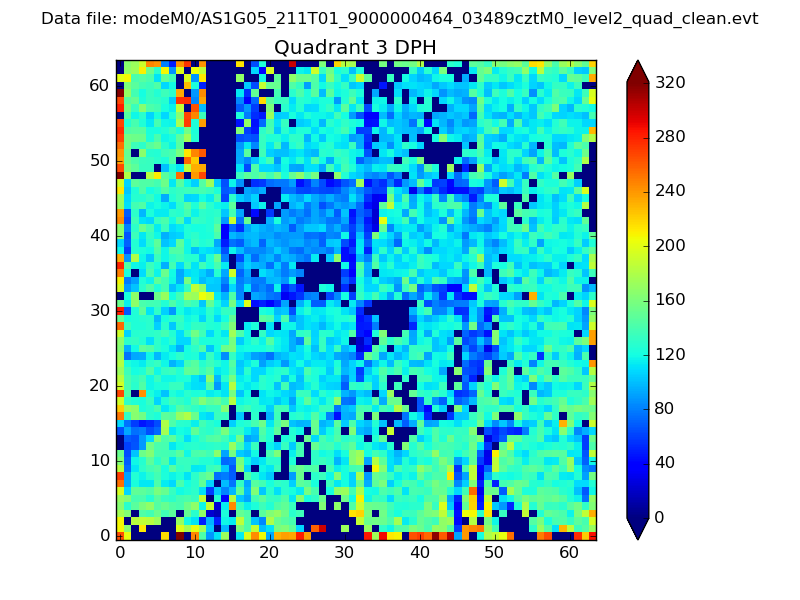 |
 |
Quadrant C |
| Plot type | Count rate plots | Images |
|---|---|---|
| Comparison with Poisson distribution Blue bars denote a histogram of data divided into 1 sec bins. Red curve is a Poisson curve with rate = median count rate of data. |
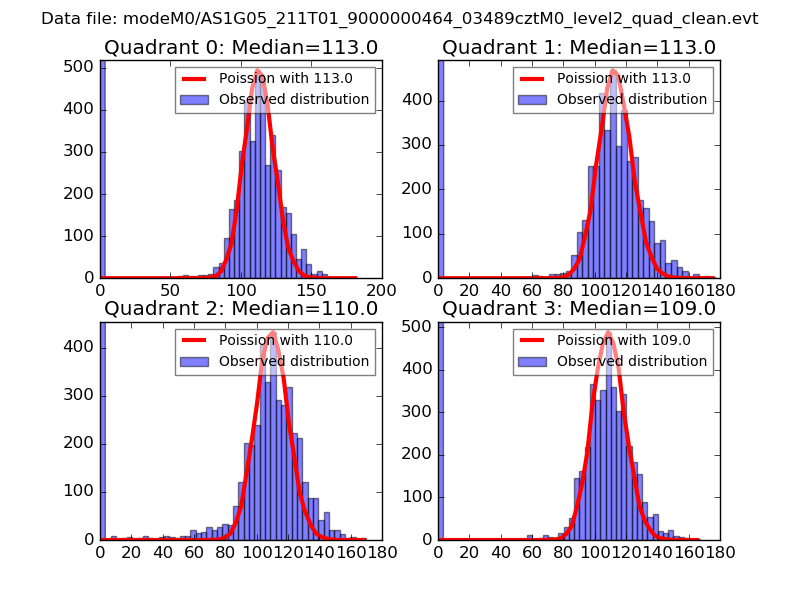 |
 |
| Quadrant-wise count rates Data is divided into 100 sec bins |
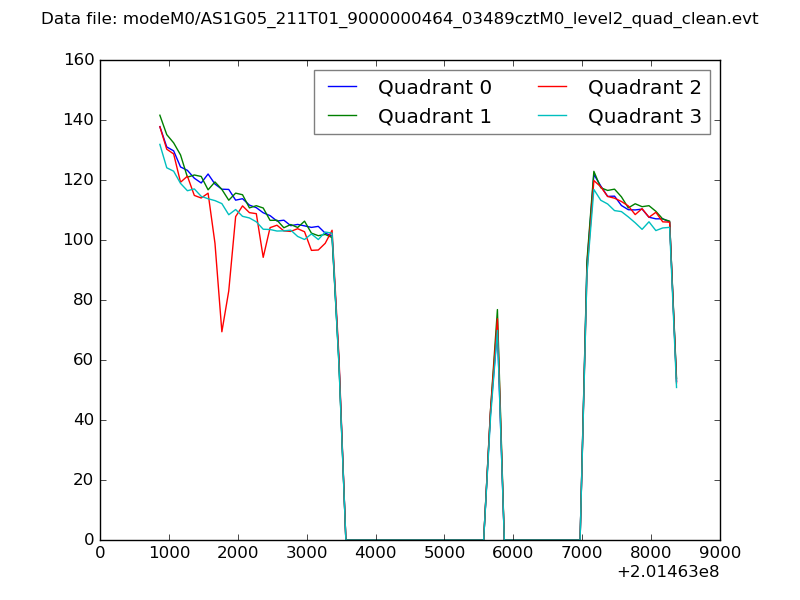 |
|
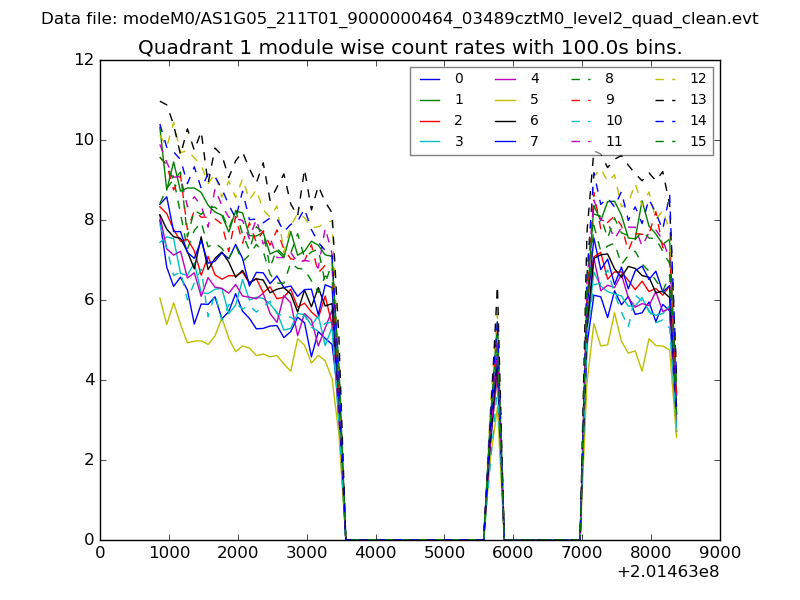
| Module-wise count rates for Quadrant A Data is divided into 100 sec bins |
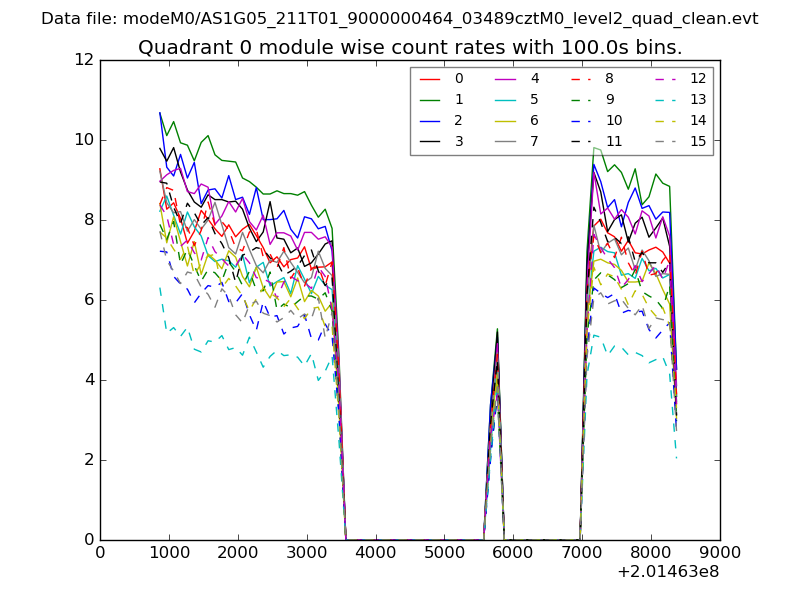 |
 |
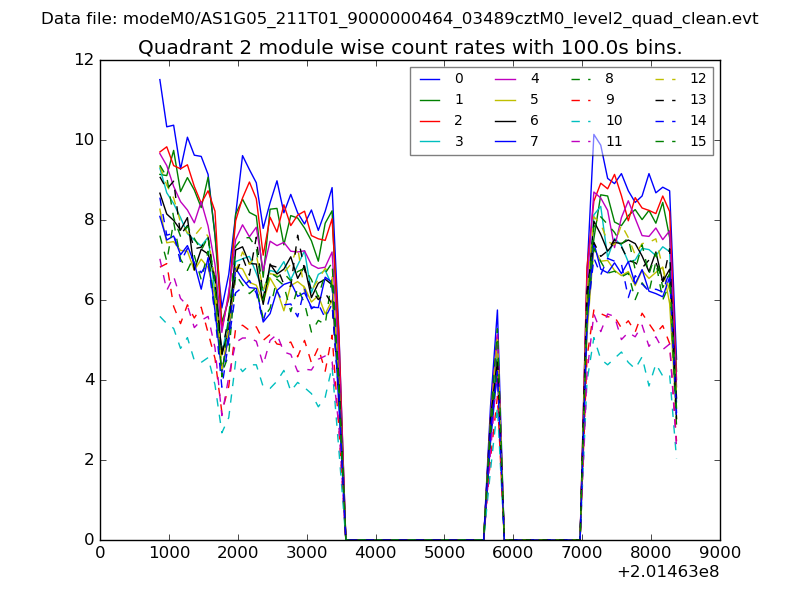
| Module-wise count rates for Quadrant B Data is divided into 100 sec bins |
 |
 |
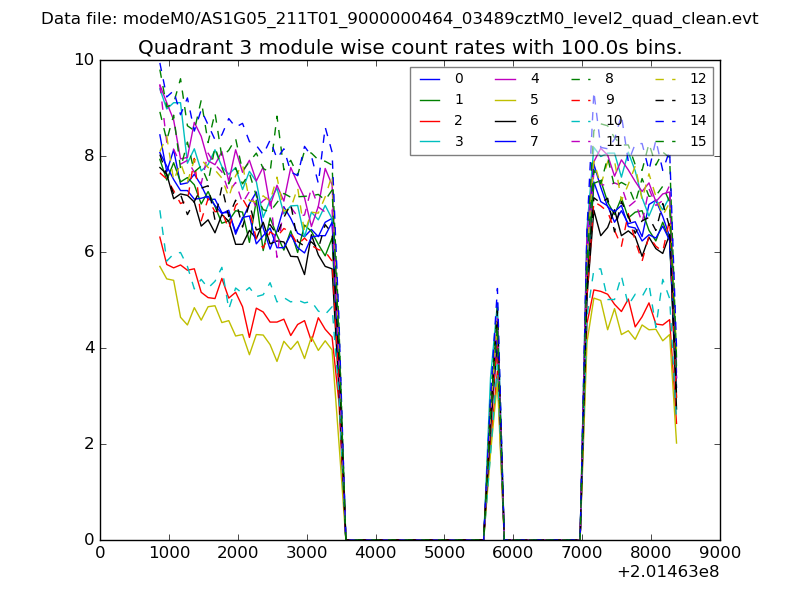
| Module-wise count rates for Quadrant C Data is divided into 100 sec bins |
 |
 |
| Module-wise count rates for Quadrant D Data is divided into 100 sec bins |
 |
 |
| Parameter | Plot |
|---|---|
| CZT HV Monitor | 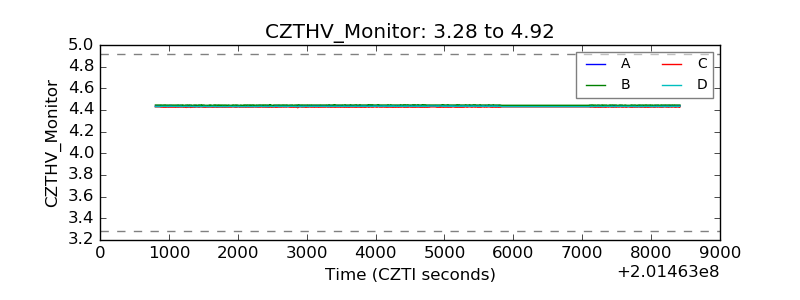 |
| D_VDD |  |
| Temperature 1 | 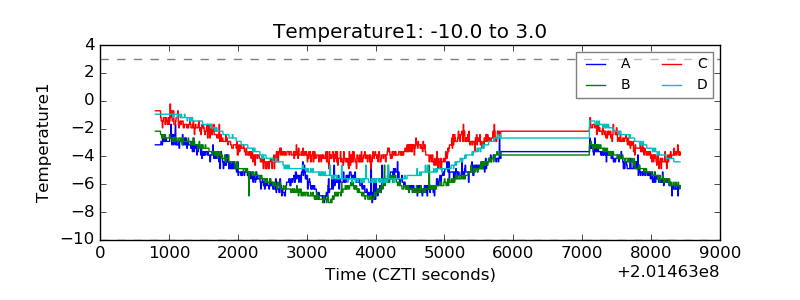 |
| Veto HV Monitor | 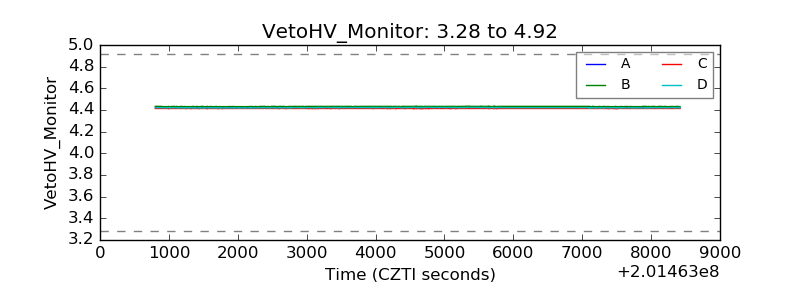 |
| Veto LLD | 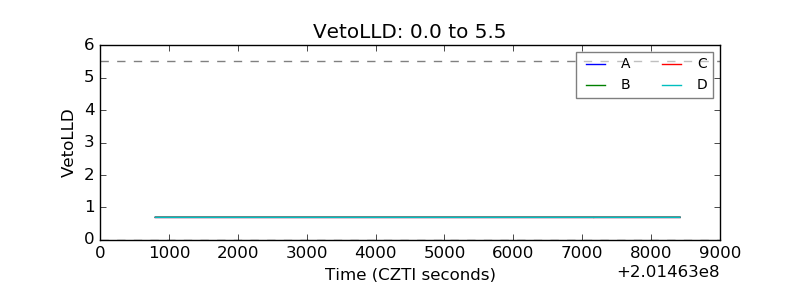 |
| Alpha Counter | 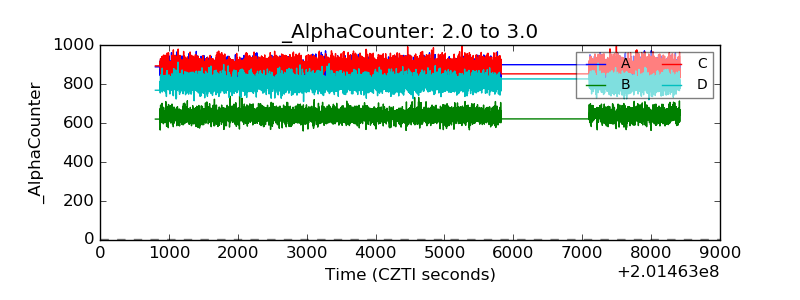 |
| _CPM_Rate | 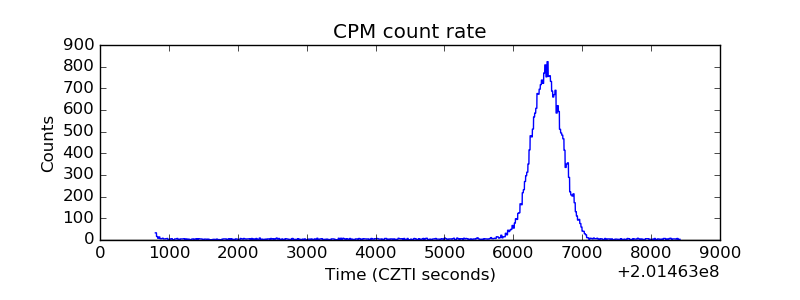 |
| CZT Counter | 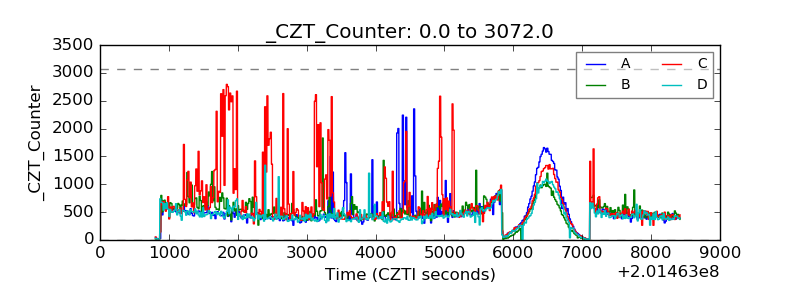 |
| +2.5 Volts monitor |  |
| +5 Volts monitor |  |
| _ROLL_ROT | 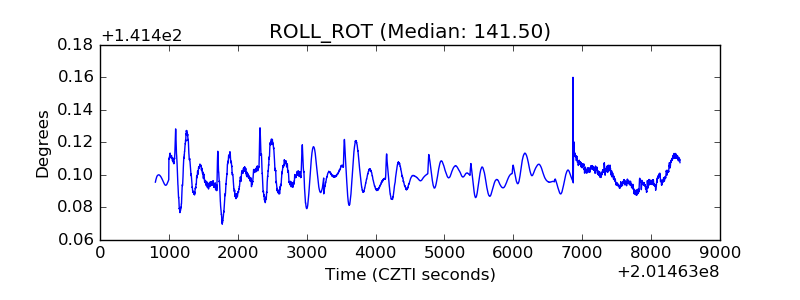 |
| _Roll_DEC | 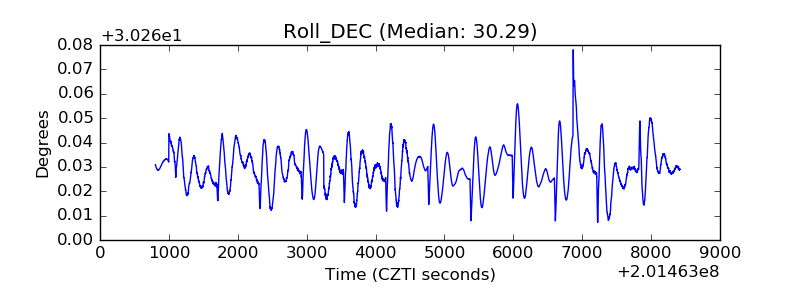 |
| _Roll_RA | 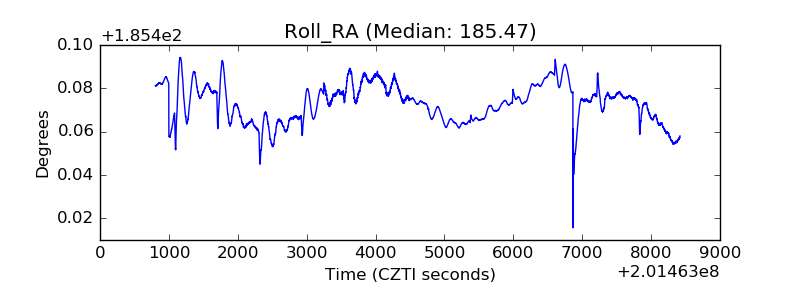 |
| Veto Counter | 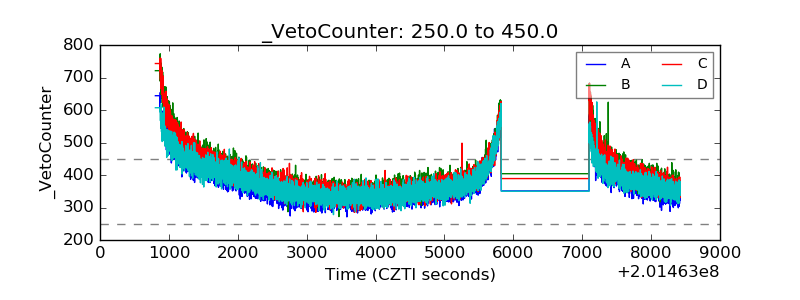 |