| Param | Original file | Final file |
|---|---|---|
| Filename | modeM0/AS1G05_211T01_9000000464_03491cztM0_level2.evt | modeM0/AS1G05_211T01_9000000464_03491cztM0_level2_quad_clean.evt |
| Size (bytes) | 496,264,320 | 80,663,040 |
| Size | 473.3 MB | 76.9 MB |
| Events in quadrant A | 3,773,665 | 492,414 |
| Events in quadrant B | 3,525,033 | 496,236 |
| Events in quadrant C | 4,233,030 | 485,416 |
| Events in quadrant D | 3,023,733 | 482,346 |
| Mode M9 | |||
|---|---|---|---|
| Quadrant | BADHDUFLAG | Total packets | Discarded packets |
| A | 0 | 11 | 0 |
| B | 0 | 11 | 0 |
| C | 0 | 11 | 0 |
| D | 0 | 12 | 0 |
| Mode M0 | |||
|---|---|---|---|
| Quadrant | BADHDUFLAG | Total packets | Discarded packets |
| A | 0 | 16234 | 3 |
| B | 0 | 15233 | 2 |
| C | 0 | 17640 | 2 |
| D | 0 | 14541 | 2 |
| Mode SS | |||
|---|---|---|---|
| Quadrant | BADHDUFLAG | Total packets | Discarded packets |
| A | 0 | 142 | 0 |
| B | 0 | 142 | 0 |
| C | 0 | 142 | 0 |
| D | 0 | 142 | 0 |
| Quadrant | Total seconds | Saturated seconds | Saturation percentage |
|---|---|---|---|
| A | 6975 | 162 | 2.322581% |
| B | 6975 | 33 | 0.473118% |
| C | 6975 | 344 | 4.931900% |
| D | 6975 | 28 | 0.401434% |
Noise dominated data is calculated using 1-second bins in cleaned event files. If a bin has >2000 counts, and if more than 50% of those come from <1% of pixels, then it is considered to be noise-dominated and hence unusable.
| Quadrant | # 1 sec bins | Bins with >0 counts | Bins with >2000 counts | High rate bins dominated by noise | Noise dominated (total time) | Noise dominated (detector-on time) | Marked lightcurve |
|---|---|---|---|---|---|---|---|
| A | 7695 | 6976 | 144 | 144 | 1.87% | 2.06% | 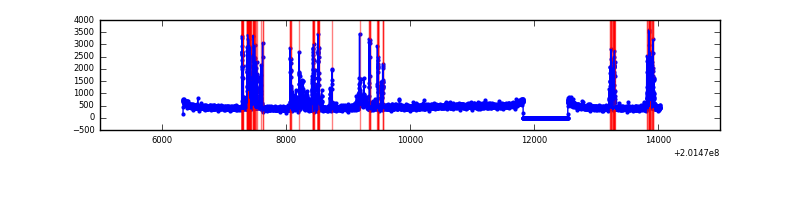 |
| B | 7695 | 6976 | 12 | 12 | 0.16% | 0.17% | 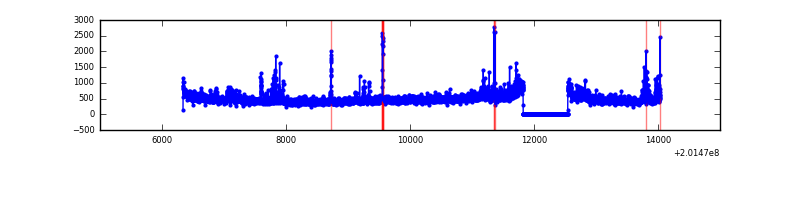 |
| C | 7695 | 6976 | 318 | 318 | 4.13% | 4.56% |  |
| D | 7695 | 6976 | 21 | 21 | 0.27% | 0.30% | 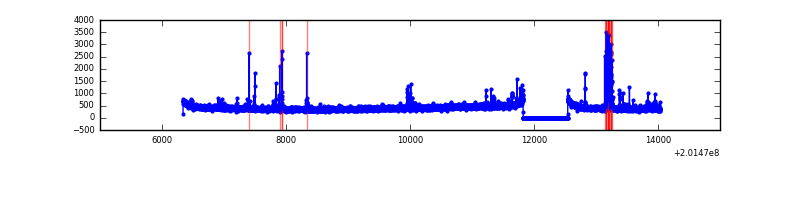 |
Top three noisy pixels from each quadrant. If the there are fewer than three noisy pixels in the level2.evt file, extra rows are filled as -1
| Pixel properties | Quadrant properties | ||||||
|---|---|---|---|---|---|---|---|
| Quadrant | DetID | PixID | Counts | Sigma | Mean | Median | Sigma |
| A | 0 | 50 | 800241 | 5061.52 | 767 | 749 | 158.0 |
| A | 0 | 118 | 11705 | 69.36 | 767 | 749 | 158.0 |
| A | 0 | 226 | 8836 | 51.2 | 767 | 749 | 158.0 |
| B | 15 | 204 | 298750 | 1961.38 | 783 | 765 | 151.9 |
| B | 4 | 81 | 96848 | 632.43 | 783 | 765 | 151.9 |
| B | 2 | 249 | 30882 | 198.23 | 783 | 765 | 151.9 |
| C | 7 | 220 | 1283870 | 7398.73 | 742 | 746 | 173.4 |
| C | 1 | 192 | 10169 | 54.33 | 742 | 746 | 173.4 |
| C | 15 | 208 | 8333 | 43.75 | 742 | 746 | 173.4 |
| D | 13 | 223 | 106336 | 574.96 | 750 | 726 | 183.7 |
| D | 13 | 239 | 44165 | 236.49 | 750 | 726 | 183.7 |
| D | 4 | 160 | 16639 | 86.63 | 750 | 726 | 183.7 |
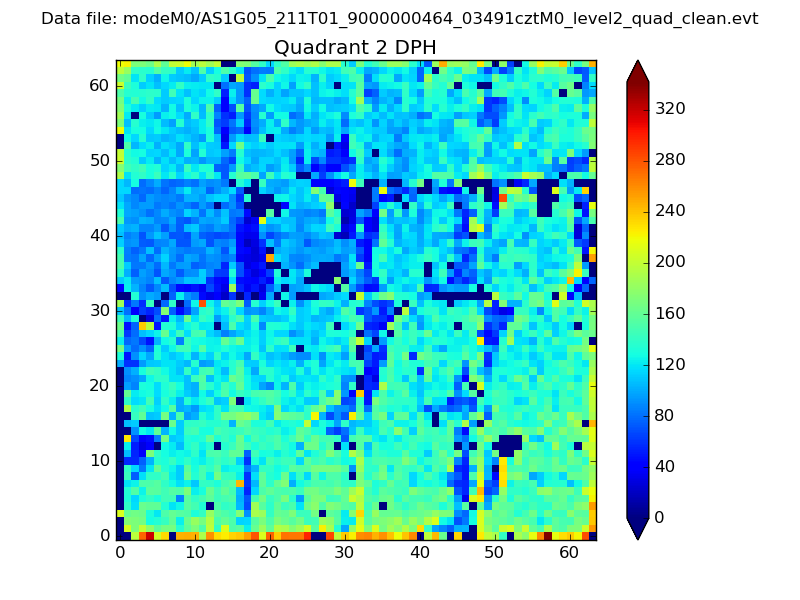
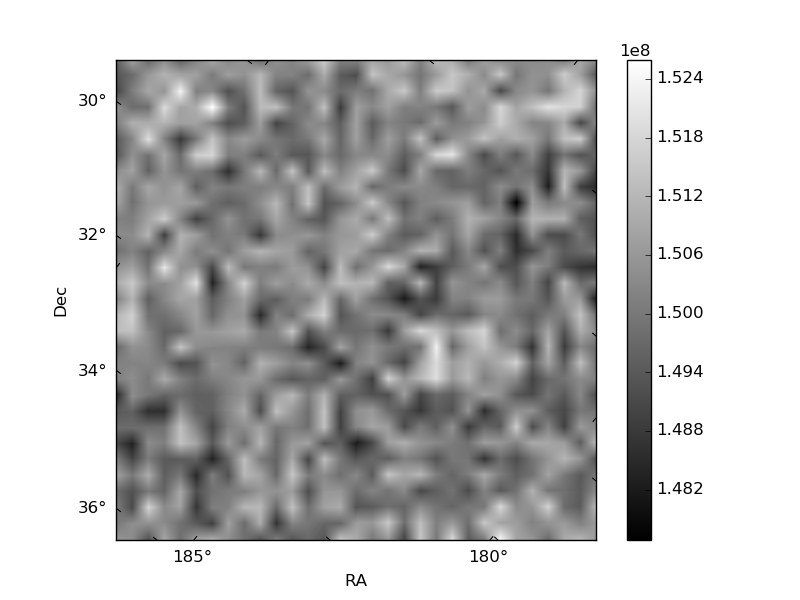
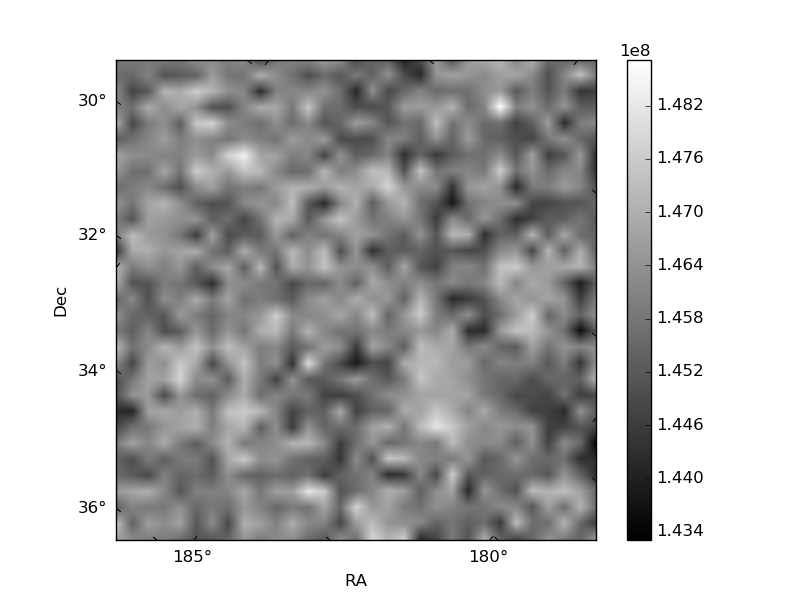
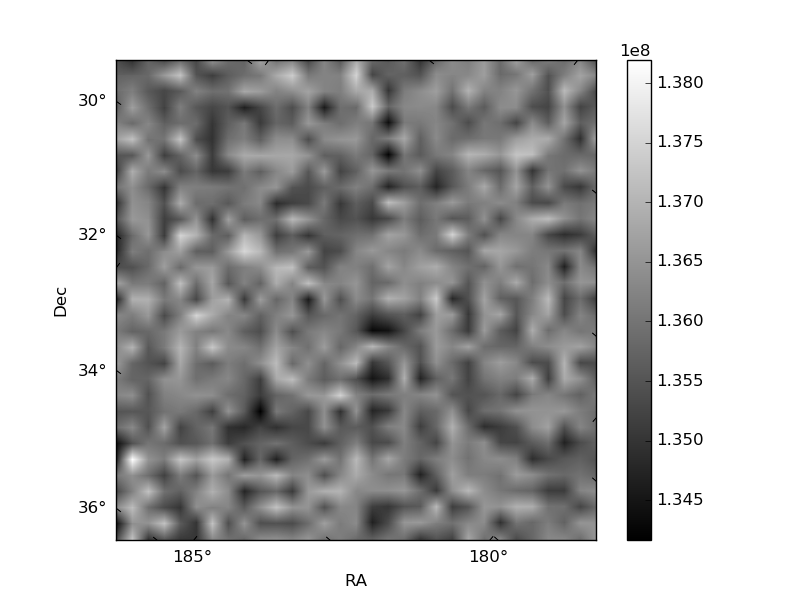
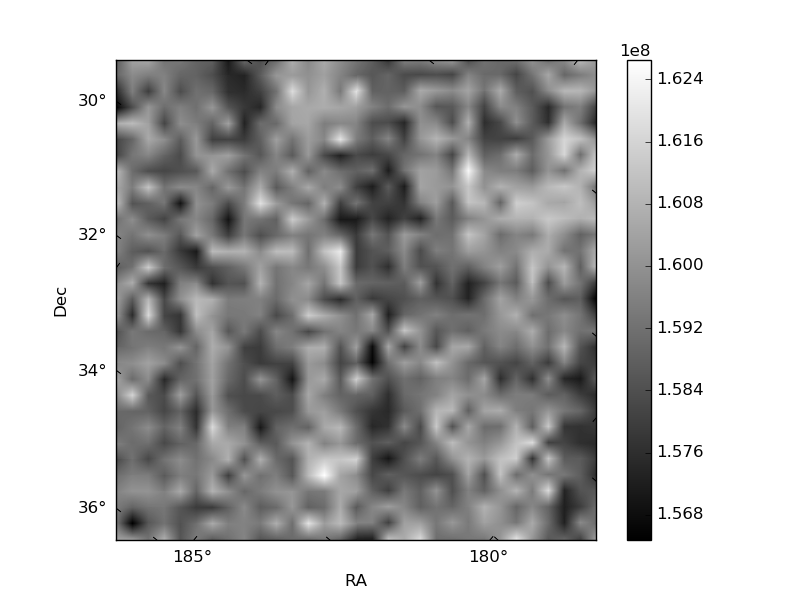
Histogram calculated using DETX and DETY for each event in the final _common_clean file
| Quadrant A | 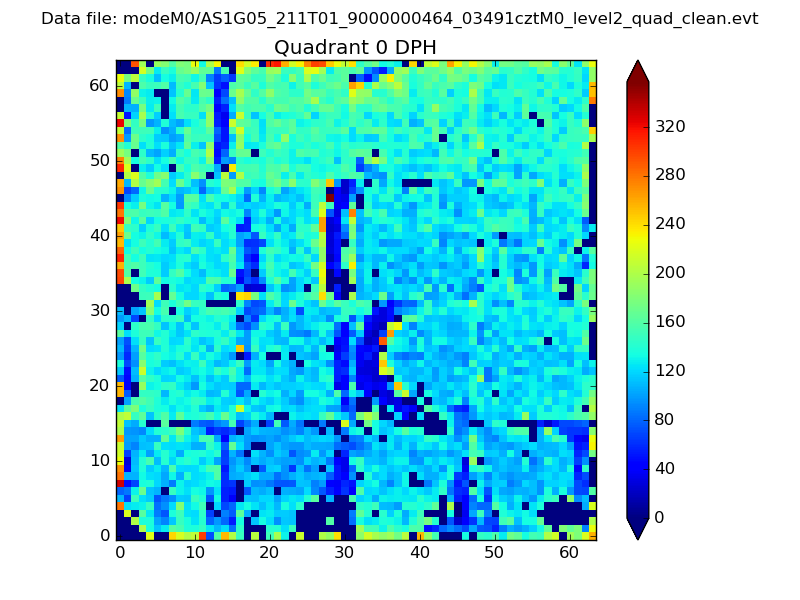 |
 |
Quadrant B |
|---|---|---|---|
| Quadrant D | 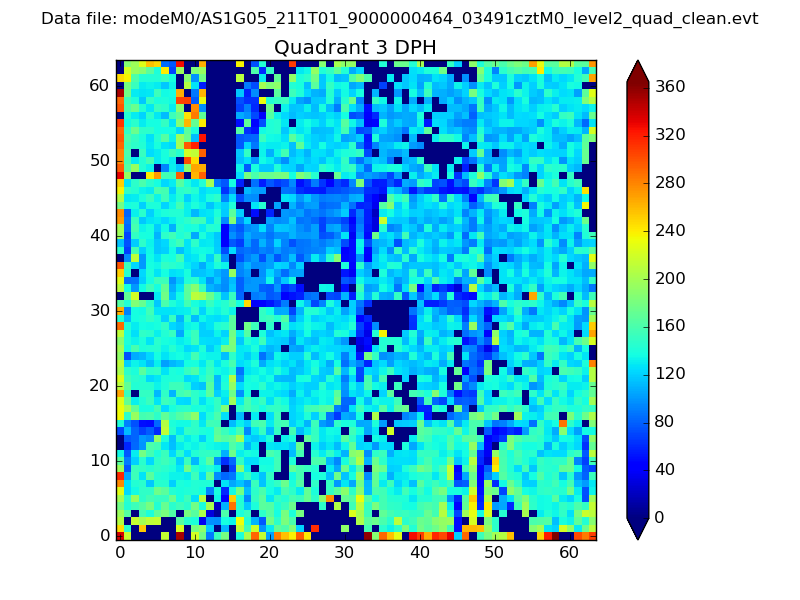 |
 |
Quadrant C |
| Plot type | Count rate plots | Images |
|---|---|---|
| Comparison with Poisson distribution Blue bars denote a histogram of data divided into 1 sec bins. Red curve is a Poisson curve with rate = median count rate of data. |
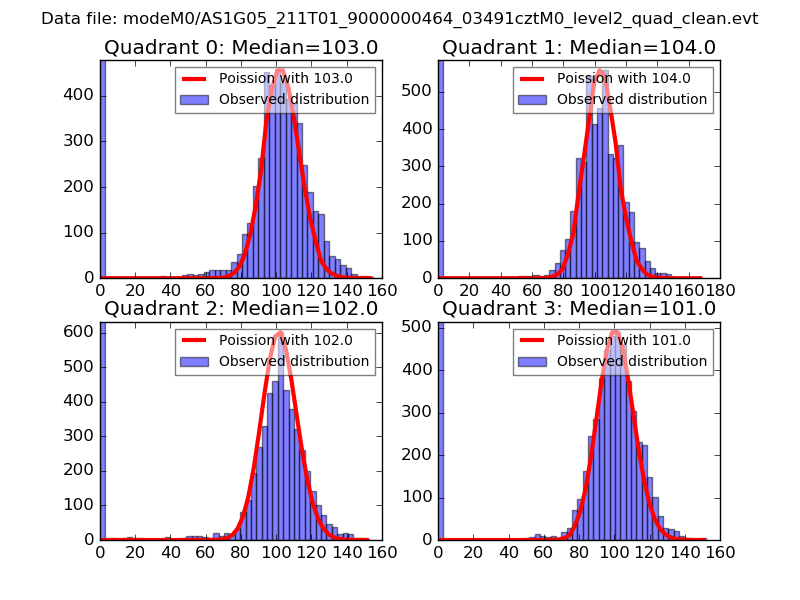 |
 |
| Quadrant-wise count rates Data is divided into 100 sec bins |
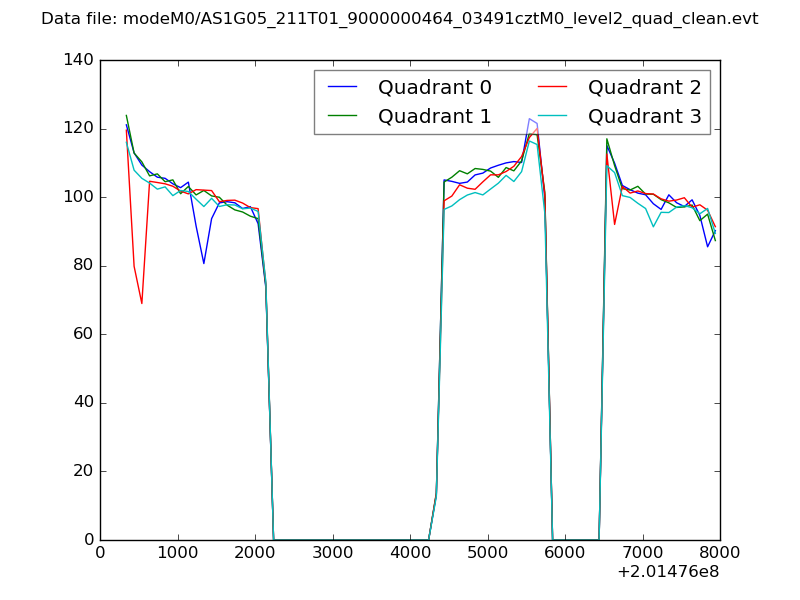 |
|
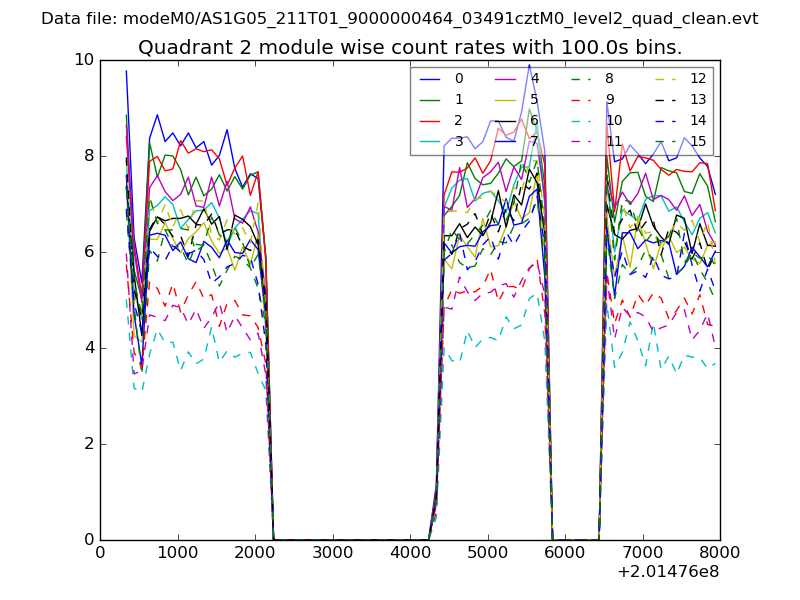
| Module-wise count rates for Quadrant A Data is divided into 100 sec bins |
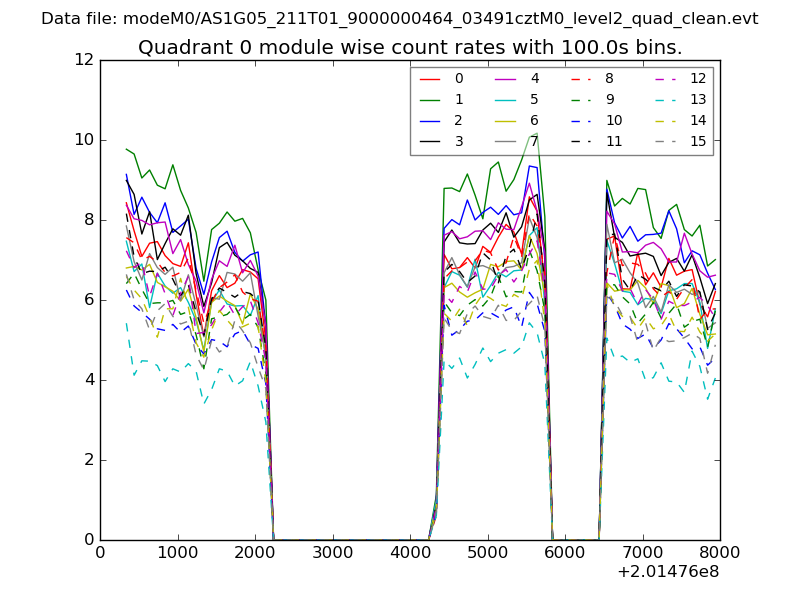 |
 |
| Module-wise count rates for Quadrant B Data is divided into 100 sec bins |
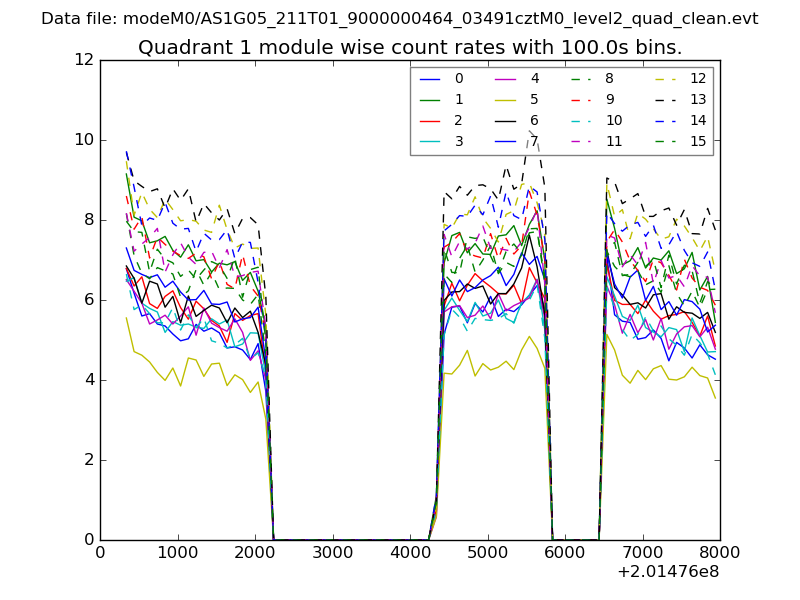 |
 |
| Module-wise count rates for Quadrant C Data is divided into 100 sec bins |
 |
 |
| Module-wise count rates for Quadrant D Data is divided into 100 sec bins |
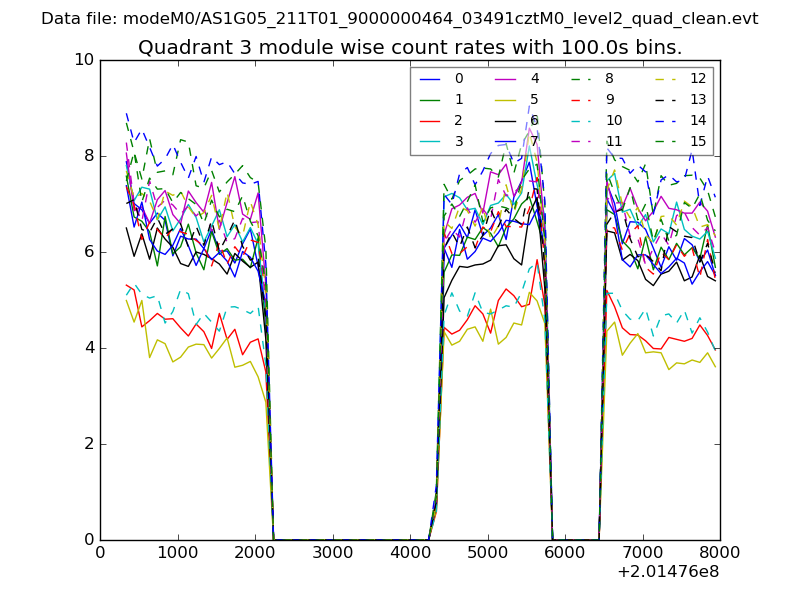 |
 |
| Parameter | Plot |
|---|---|
| CZT HV Monitor | 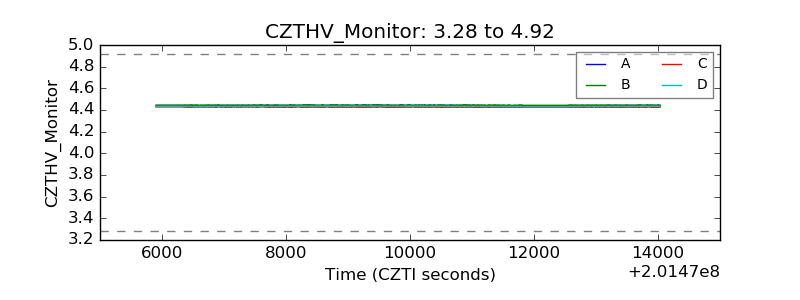 |
| D_VDD | 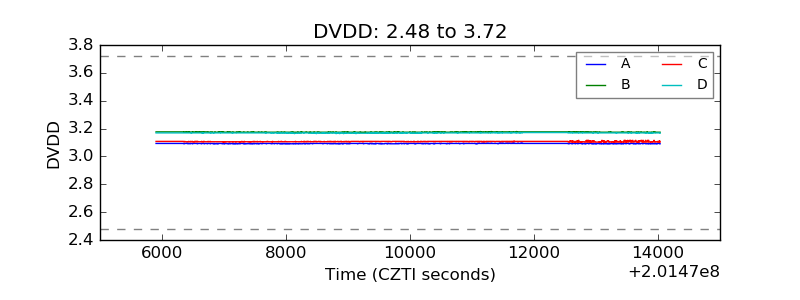 |
| Temperature 1 | 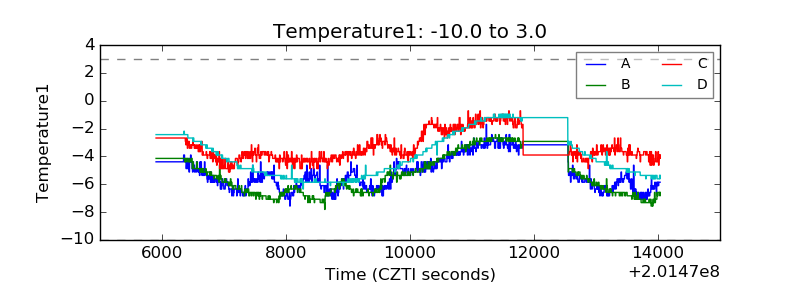 |
| Veto HV Monitor | 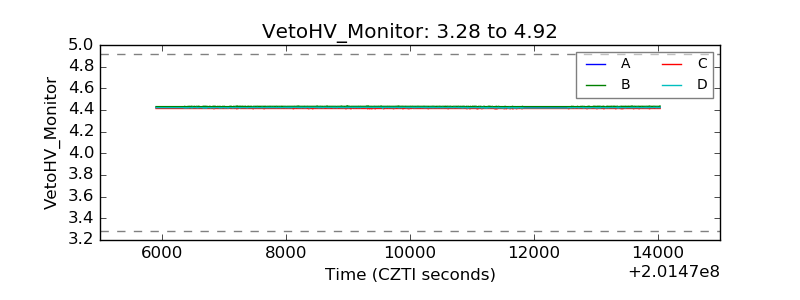 |
| Veto LLD | 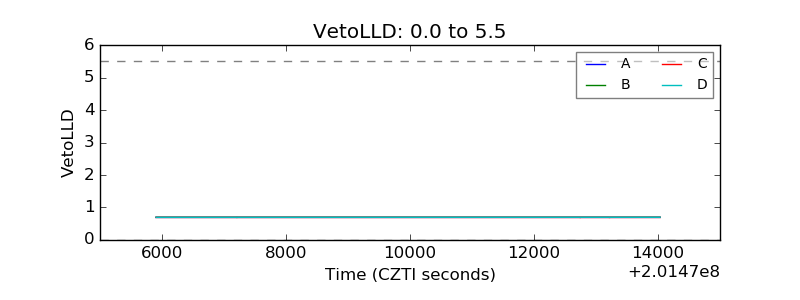 |
| Alpha Counter | 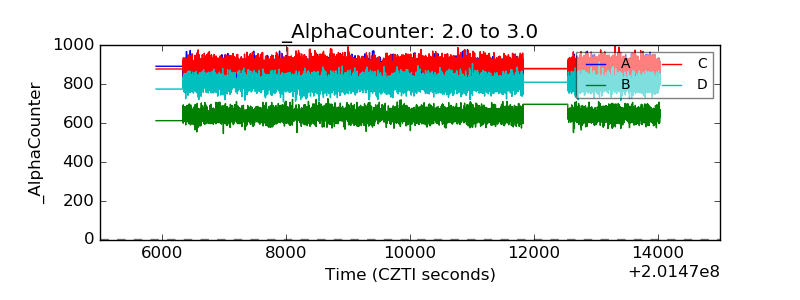 |
| _CPM_Rate | 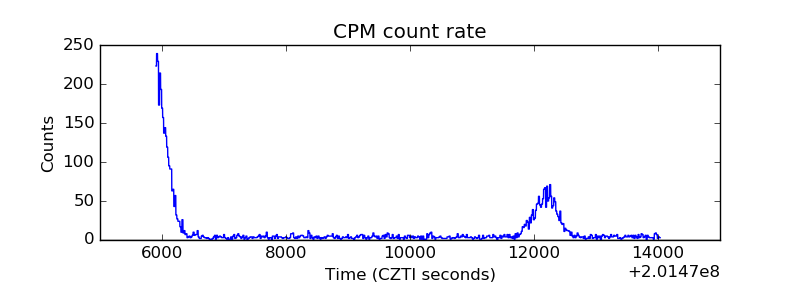 |
| CZT Counter | 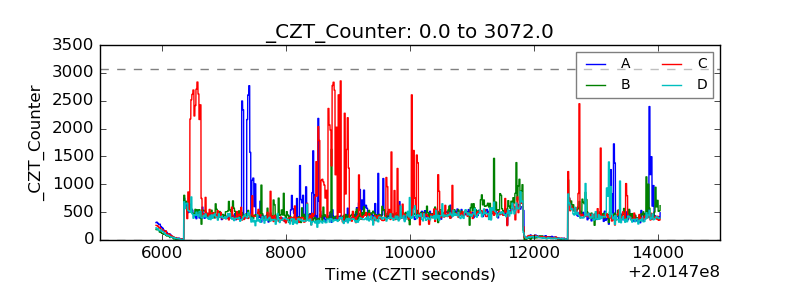 |
| +2.5 Volts monitor |  |
| +5 Volts monitor | 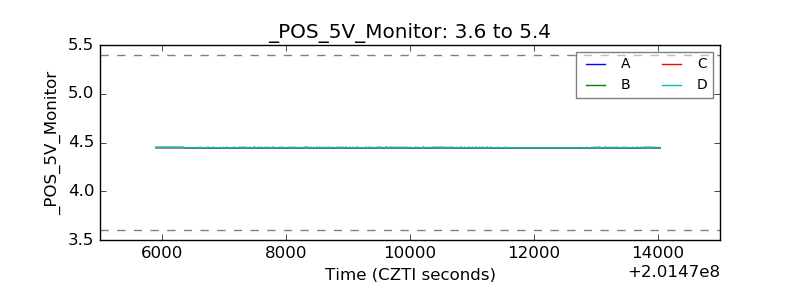 |
| Veto Counter | 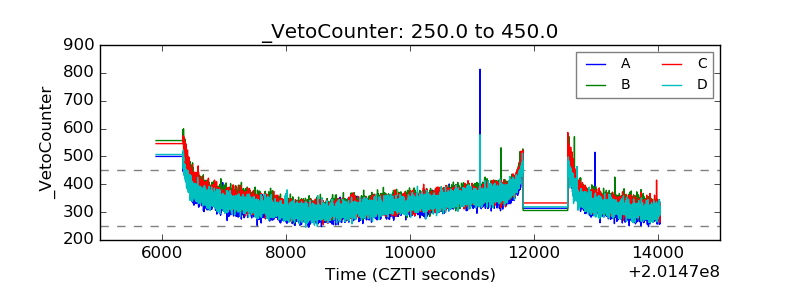 |