| Param | Original file | Final file |
|---|---|---|
| Filename | modeM0/AS1G05_211T01_9000000464_03493cztM0_level2.evt | modeM0/AS1G05_211T01_9000000464_03493cztM0_level2_quad_clean.evt |
| Size (bytes) | 557,320,320 | 82,607,040 |
| Size | 531.5 MB | 78.8 MB |
| Events in quadrant A | 5,165,087 | 489,411 |
| Events in quadrant B | 3,988,827 | 493,701 |
| Events in quadrant C | 3,876,729 | 492,811 |
| Events in quadrant D | 3,316,102 | 480,734 |
| Mode M0 | |||
|---|---|---|---|
| Quadrant | BADHDUFLAG | Total packets | Discarded packets |
| A | 0 | 20879 | 4 |
| B | 0 | 17077 | 3 |
| C | 0 | 17217 | 3 |
| D | 0 | 16175 | 3 |
| Mode SS | |||
|---|---|---|---|
| Quadrant | BADHDUFLAG | Total packets | Discarded packets |
| A | 0 | 158 | 0 |
| B | 0 | 158 | 0 |
| C | 0 | 158 | 0 |
| D | 0 | 158 | 0 |
| Quadrant | Total seconds | Saturated seconds | Saturation percentage |
|---|---|---|---|
| A | 7828 | 367 | 4.688298% |
| B | 7828 | 187 | 2.388861% |
| C | 7828 | 111 | 1.417987% |
| D | 7829 | 19 | 0.242687% |
Noise dominated data is calculated using 1-second bins in cleaned event files. If a bin has >2000 counts, and if more than 50% of those come from <1% of pixels, then it is considered to be noise-dominated and hence unusable.
| Quadrant | # 1 sec bins | Bins with >0 counts | Bins with >2000 counts | High rate bins dominated by noise | Noise dominated (total time) | Noise dominated (detector-on time) | Marked lightcurve |
|---|---|---|---|---|---|---|---|
| A | 7893 | 7830 | 231 | 231 | 2.93% | 2.95% | 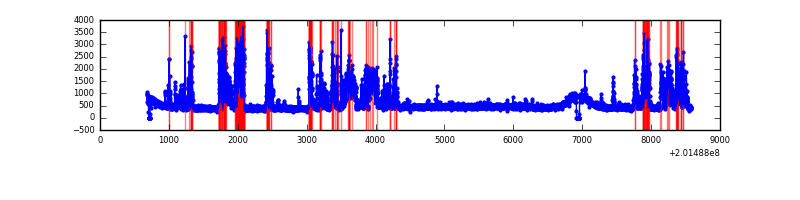 |
| B | 7893 | 7830 | 23 | 23 | 0.29% | 0.29% | 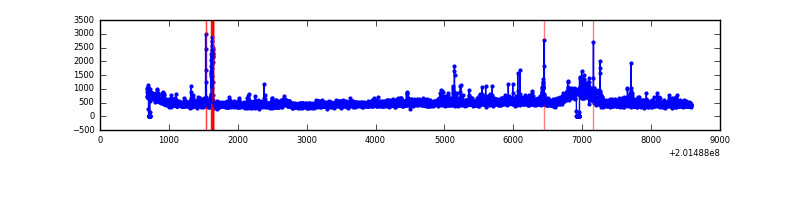 |
| C | 7893 | 7830 | 58 | 58 | 0.73% | 0.74% | 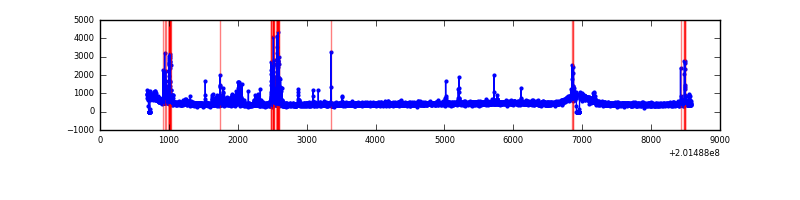 |
| D | 7894 | 7831 | 2 | 2 | 0.03% | 0.03% | 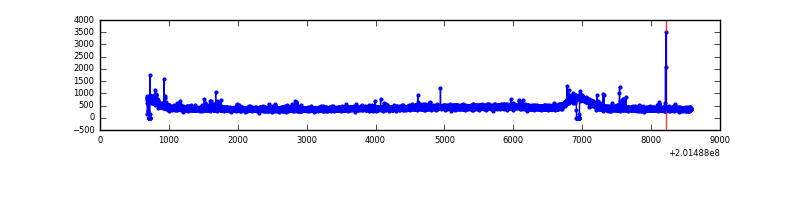 |
Top three noisy pixels from each quadrant. If the there are fewer than three noisy pixels in the level2.evt file, extra rows are filled as -1
| Pixel properties | Quadrant properties | ||||||
|---|---|---|---|---|---|---|---|
| Quadrant | DetID | PixID | Counts | Sigma | Mean | Median | Sigma |
| A | 0 | 50 | 1717952 | 9460.63 | 879 | 858 | 181.5 |
| A | 8 | 15 | 38727 | 208.65 | 879 | 858 | 181.5 |
| A | 0 | 118 | 9928 | 49.97 | 879 | 858 | 181.5 |
| B | 15 | 204 | 260016 | 1458.28 | 903 | 879 | 177.7 |
| B | 4 | 81 | 131195 | 733.35 | 903 | 879 | 177.7 |
| B | 4 | 200 | 57786 | 320.24 | 903 | 879 | 177.7 |
| C | 7 | 220 | 235784 | 1147.24 | 870 | 872 | 204.8 |
| C | 1 | 16 | 89701 | 433.82 | 870 | 872 | 204.8 |
| C | 1 | 192 | 51796 | 248.7 | 870 | 872 | 204.8 |
| D | 5 | 233 | 19450 | 87.24 | 864 | 838 | 213.4 |
| D | 13 | 239 | 12315 | 53.79 | 864 | 838 | 213.4 |
| D | 2 | 31 | 10606 | 45.78 | 864 | 838 | 213.4 |
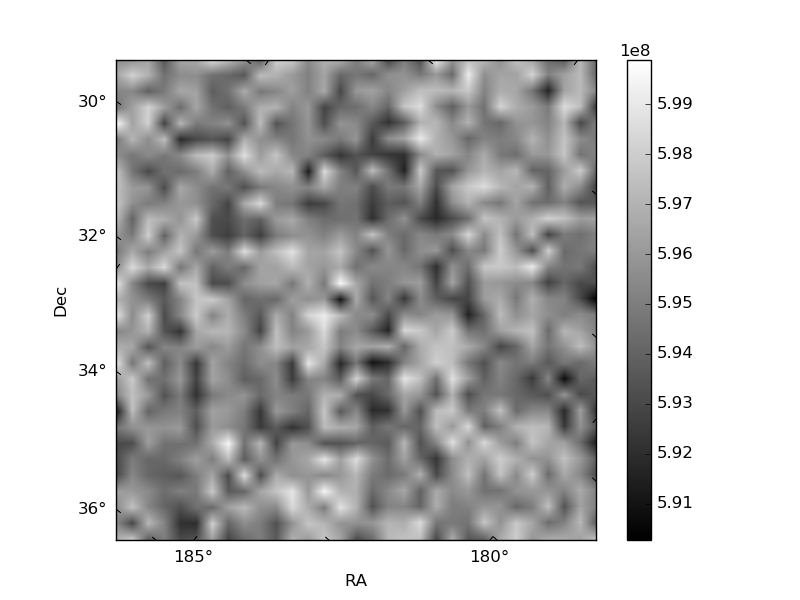
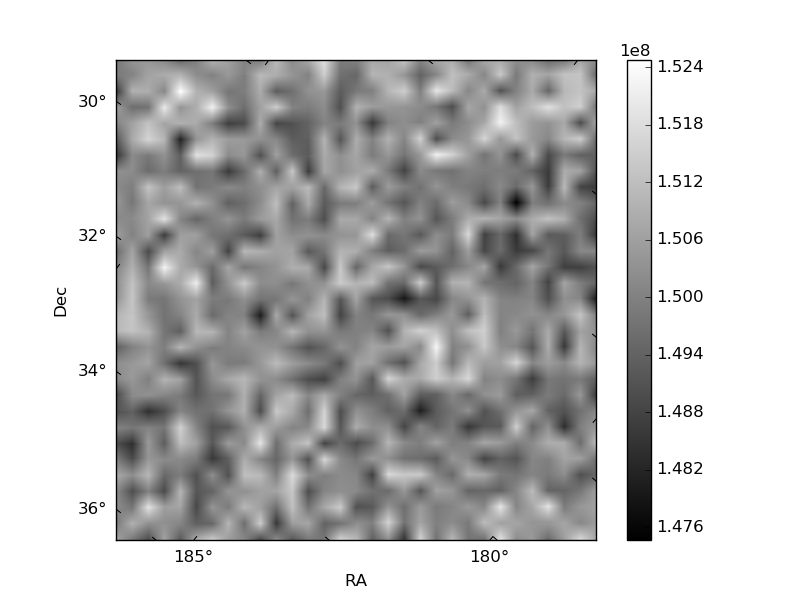
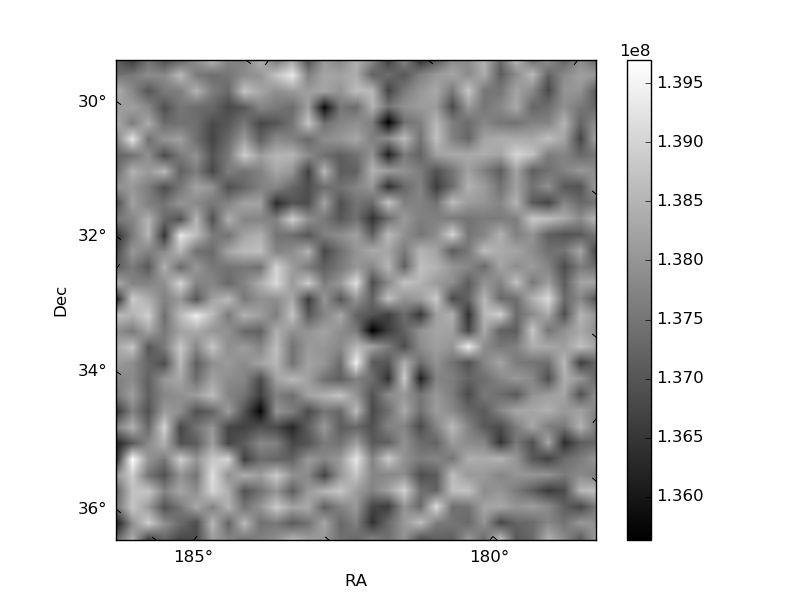
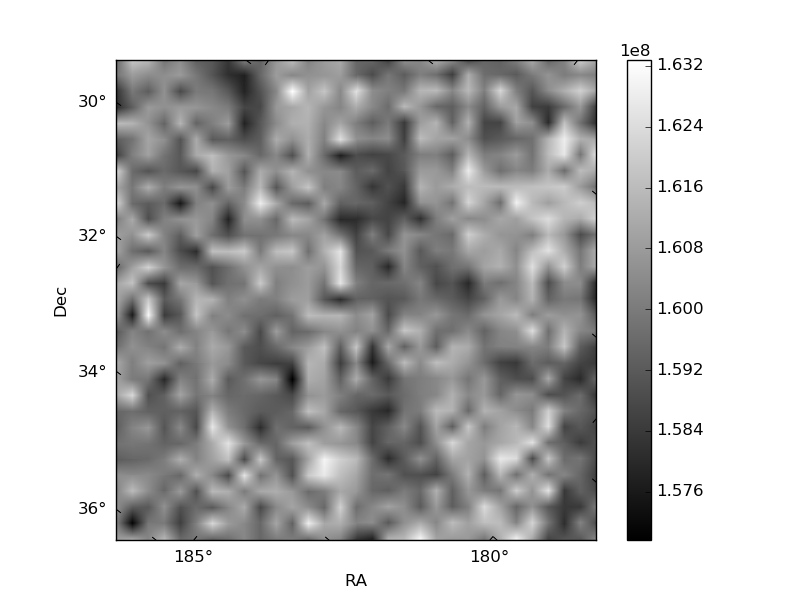
Histogram calculated using DETX and DETY for each event in the final _common_clean file
| Quadrant A | 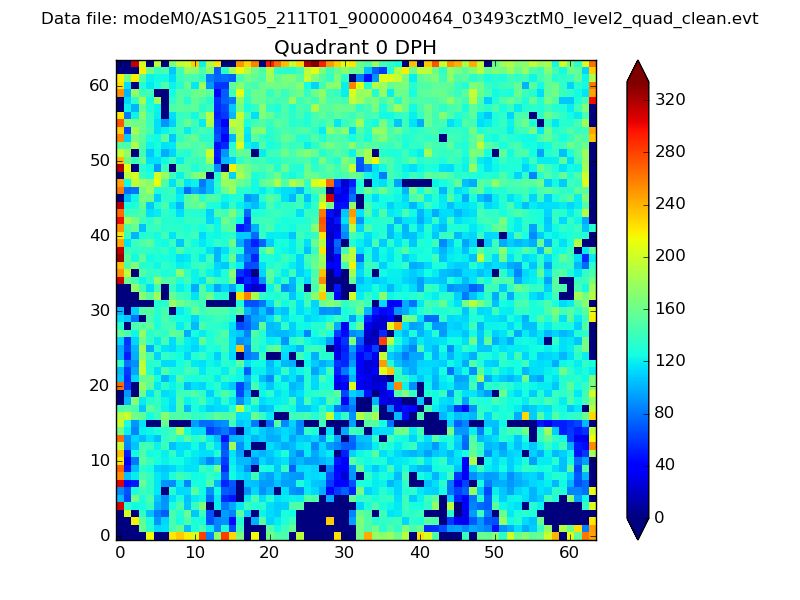 |
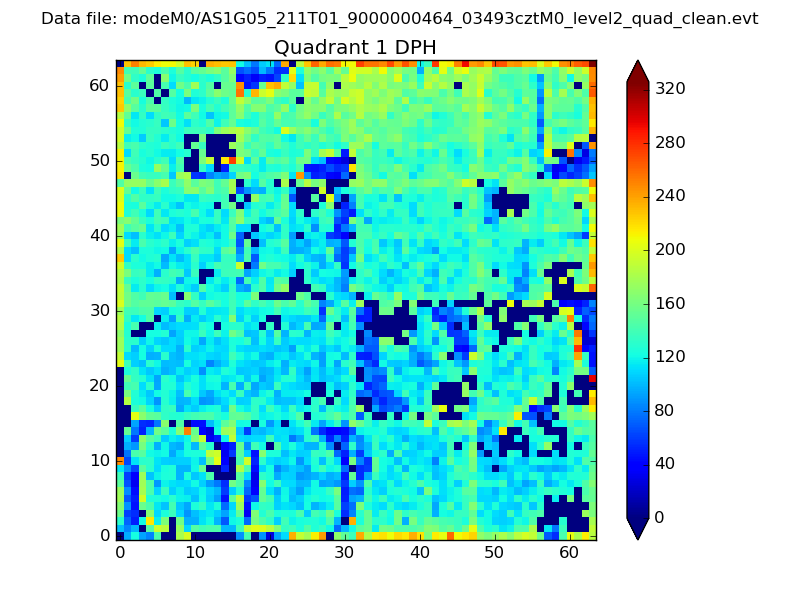 |
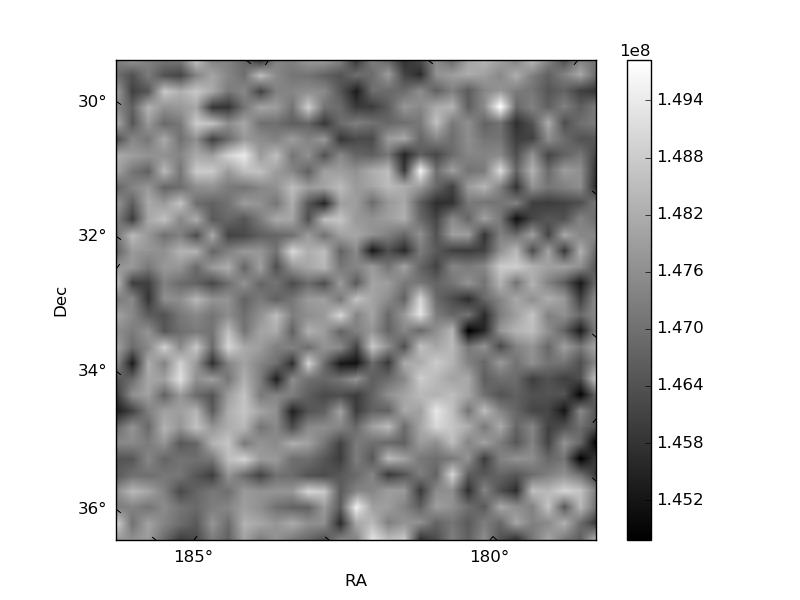
Quadrant B |
|---|---|---|---|
| Quadrant D | 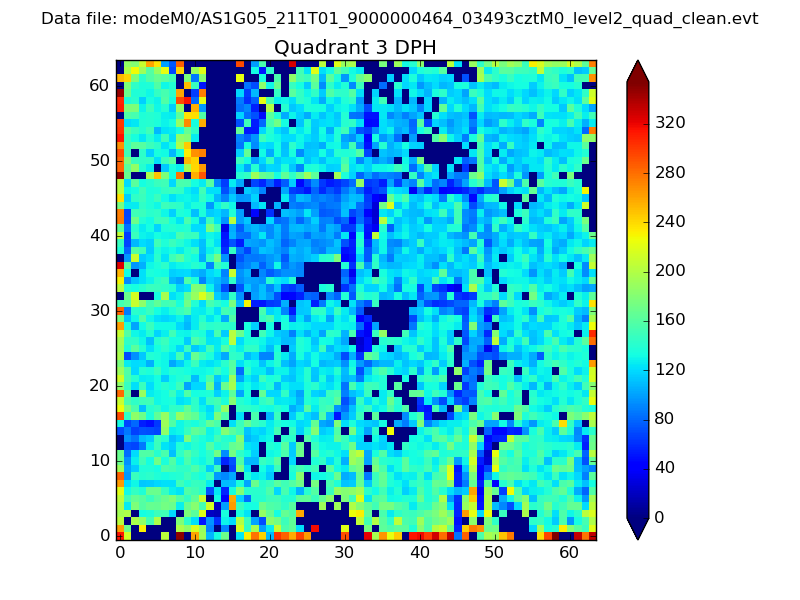 |
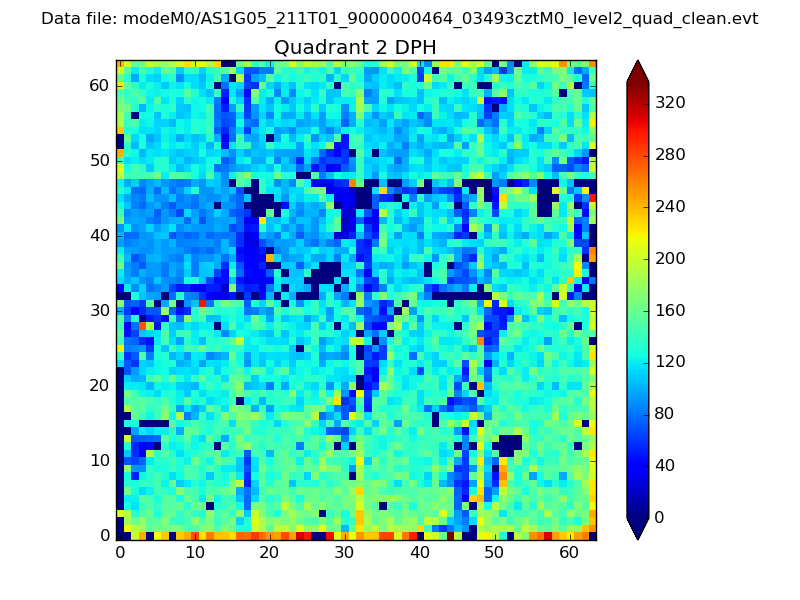 |
Quadrant C |
| Plot type | Count rate plots | Images |
|---|---|---|
| Comparison with Poisson distribution Blue bars denote a histogram of data divided into 1 sec bins. Red curve is a Poisson curve with rate = median count rate of data. |
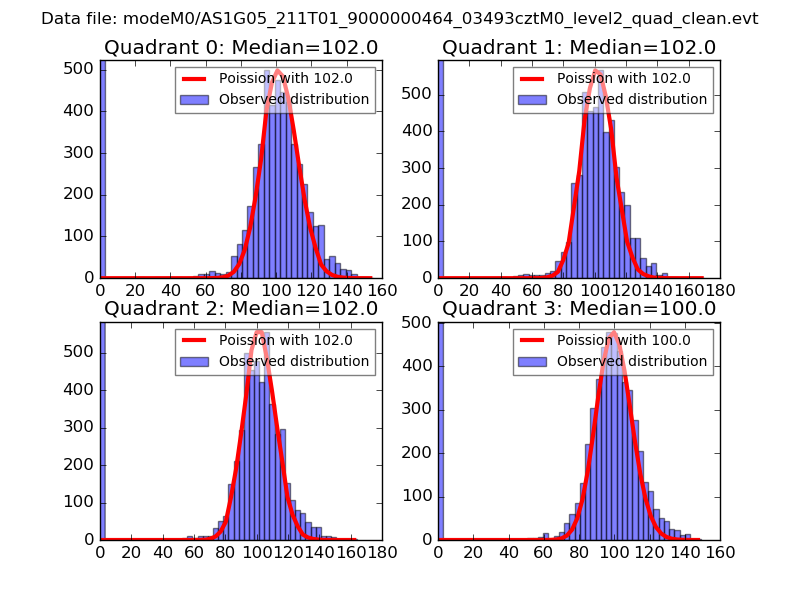 |
 |
| Quadrant-wise count rates Data is divided into 100 sec bins |
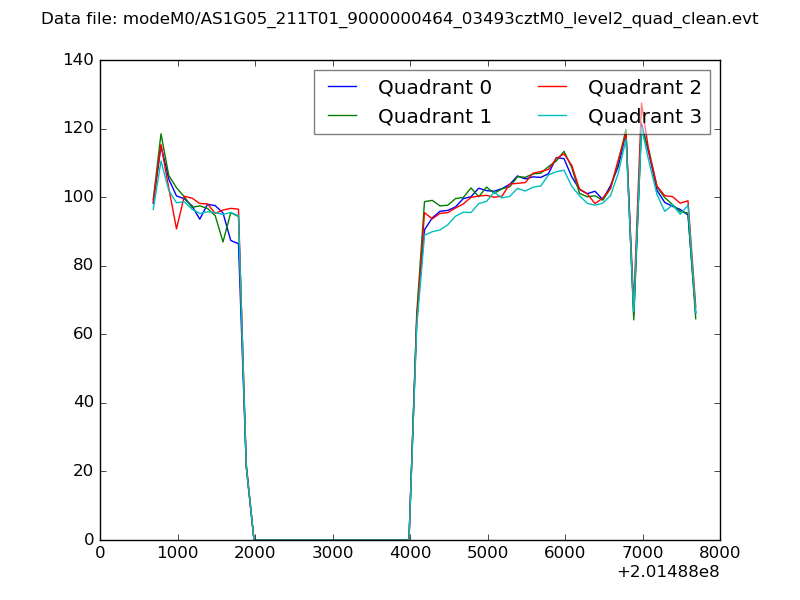 |
|
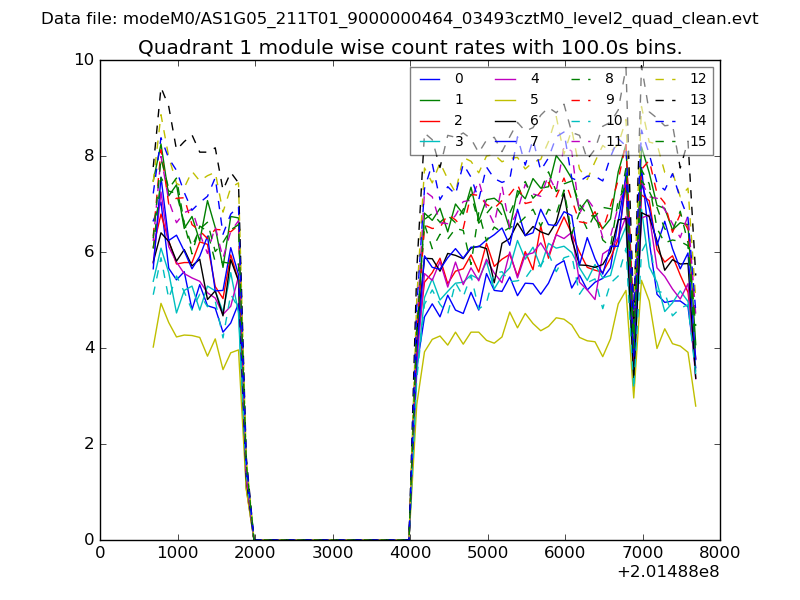
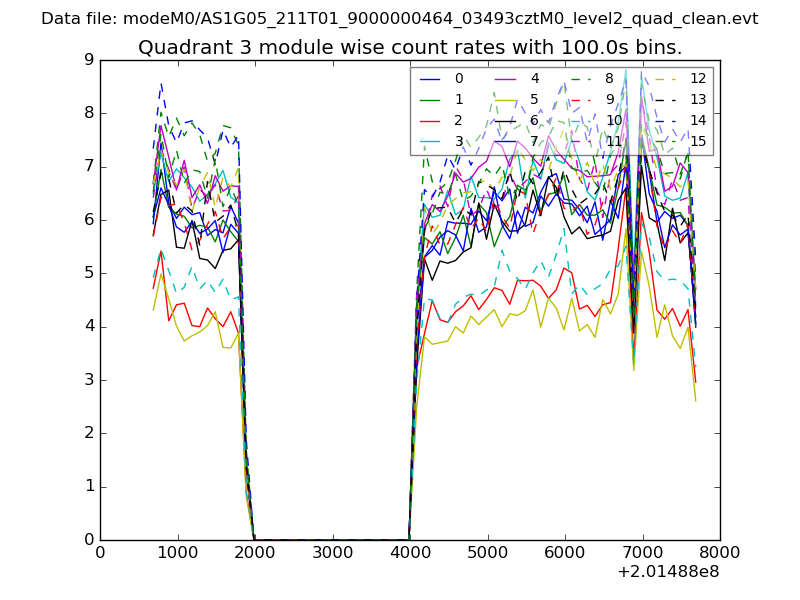
| Module-wise count rates for Quadrant A Data is divided into 100 sec bins |
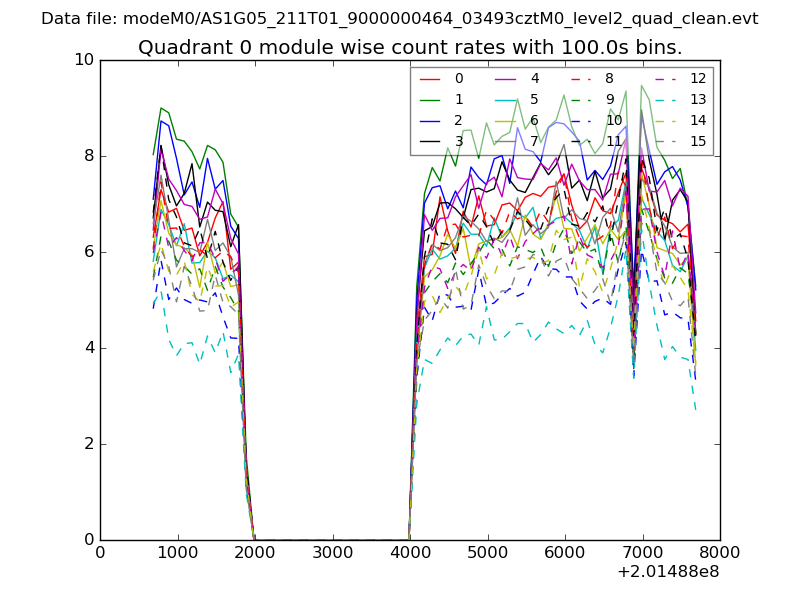 |
 |
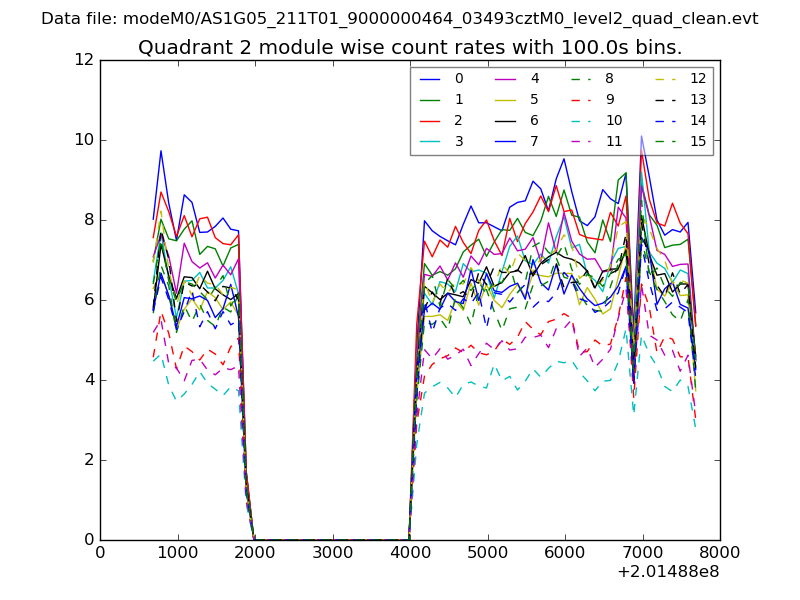
| Module-wise count rates for Quadrant B Data is divided into 100 sec bins |
 |
 |
| Module-wise count rates for Quadrant C Data is divided into 100 sec bins |
 |
 |
| Module-wise count rates for Quadrant D Data is divided into 100 sec bins |
 |
 |
| Parameter | Plot |
|---|---|
| CZT HV Monitor | 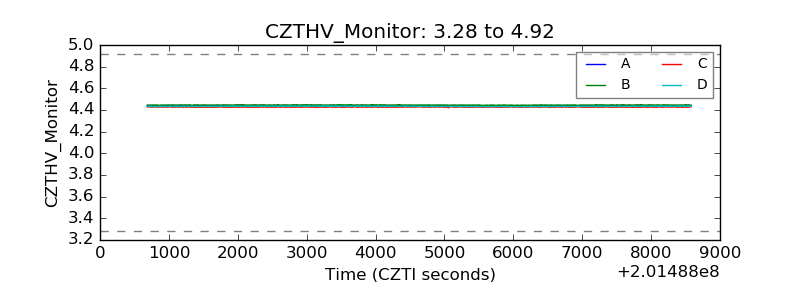 |
| D_VDD | 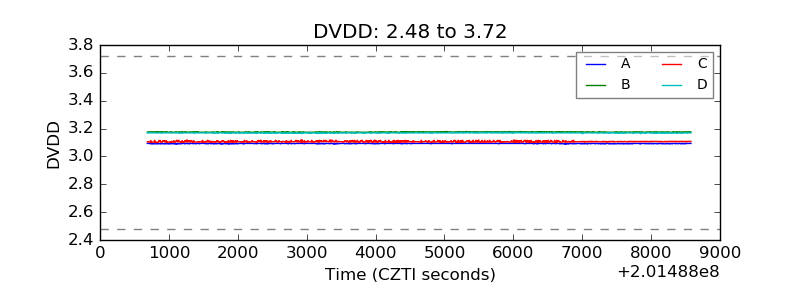 |
| Temperature 1 | 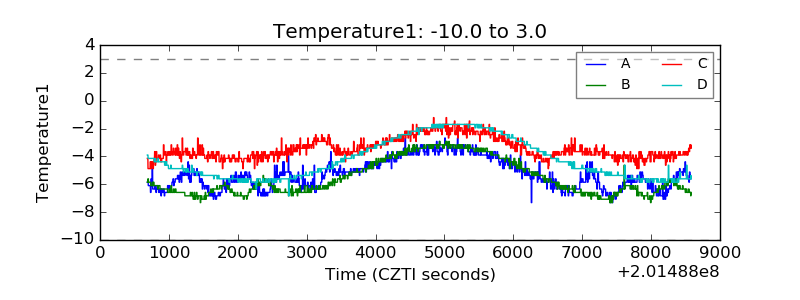 |
| Veto HV Monitor | 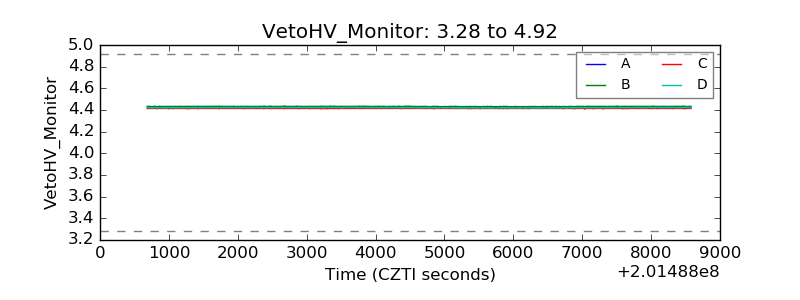 |
| Veto LLD | 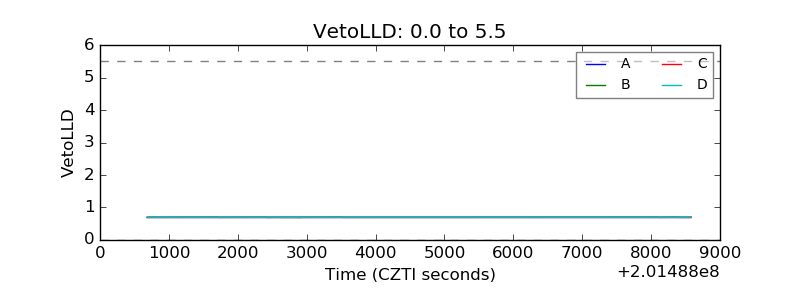 |
| Alpha Counter | 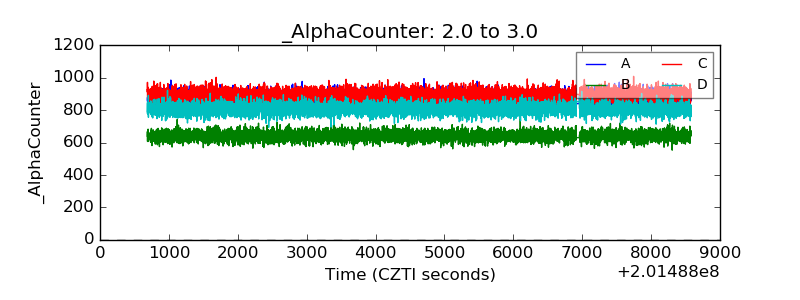 |
| _CPM_Rate | 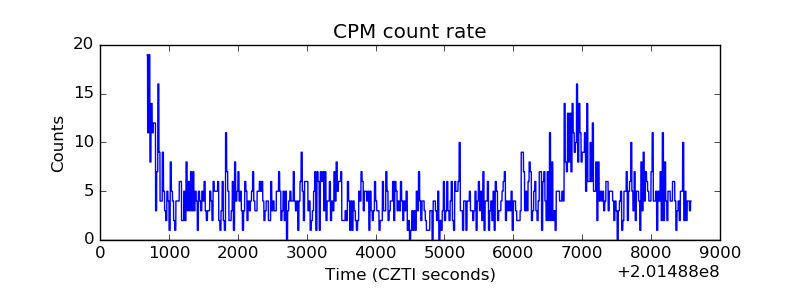 |
| CZT Counter | 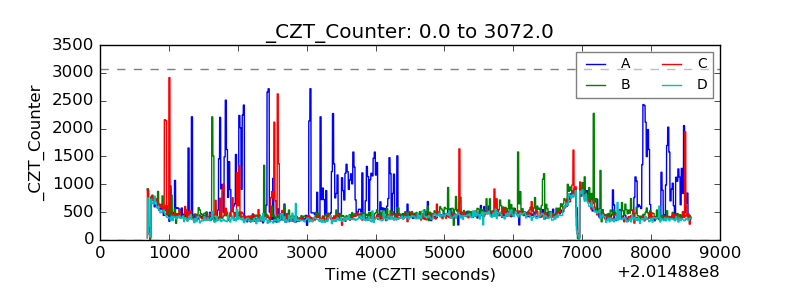 |
| +2.5 Volts monitor |  |
| +5 Volts monitor |  |
| Veto Counter | 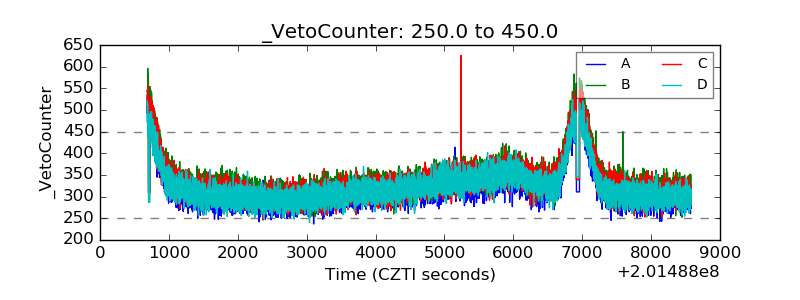 |