| Param | Original file | Final file |
|---|---|---|
| Filename | modeM0/AS1G05_211T01_9000000464_03496cztM0_level2.evt | modeM0/AS1G05_211T01_9000000464_03496cztM0_level2_quad_clean.evt |
| Size (bytes) | 1,058,244,480 | 131,739,840 |
| Size | 1009.2 MB | 125.6 MB |
| Events in quadrant A | 7,045,941 | 778,051 |
| Events in quadrant B | 7,290,019 | 780,053 |
| Events in quadrant C | 10,862,323 | 731,652 |
| Events in quadrant D | 5,930,434 | 759,396 |
| Mode M9 | |||
|---|---|---|---|
| Quadrant | BADHDUFLAG | Total packets | Discarded packets |
| A | 0 | 12 | 0 |
| B | 0 | 12 | 0 |
| C | 0 | 12 | 0 |
| D | 0 | 12 | 0 |
| Mode M0 | |||
|---|---|---|---|
| Quadrant | BADHDUFLAG | Total packets | Discarded packets |
| A | 0 | 30529 | 4 |
| B | 0 | 30412 | 3 |
| C | 0 | 42016 | 3 |
| D | 0 | 28362 | 5 |
| Mode SS | |||
|---|---|---|---|
| Quadrant | BADHDUFLAG | Total packets | Discarded packets |
| A | 0 | 280 | 0 |
| B | 0 | 280 | 0 |
| C | 0 | 280 | 0 |
| D | 0 | 280 | 0 |
| Quadrant | Total seconds | Saturated seconds | Saturation percentage |
|---|---|---|---|
| A | 13595 | 505 | 3.714601% |
| B | 13595 | 426 | 3.133505% |
| C | 13595 | 1736 | 12.769401% |
| D | 13594 | 268 | 1.971458% |
Noise dominated data is calculated using 1-second bins in cleaned event files. If a bin has >2000 counts, and if more than 50% of those come from <1% of pixels, then it is considered to be noise-dominated and hence unusable.
| Quadrant | # 1 sec bins | Bins with >0 counts | Bins with >2000 counts | High rate bins dominated by noise | Noise dominated (total time) | Noise dominated (detector-on time) | Marked lightcurve |
|---|---|---|---|---|---|---|---|
| A | 14905 | 13595 | 101 | 101 | 0.68% | 0.74% | 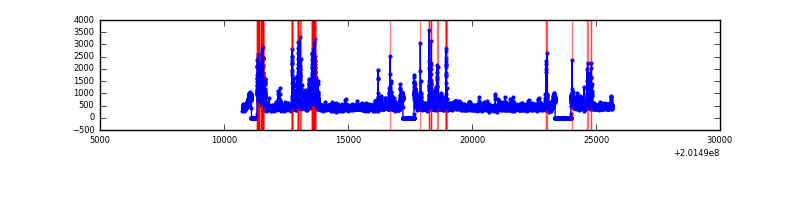 |
| B | 14905 | 13595 | 19 | 19 | 0.13% | 0.14% | 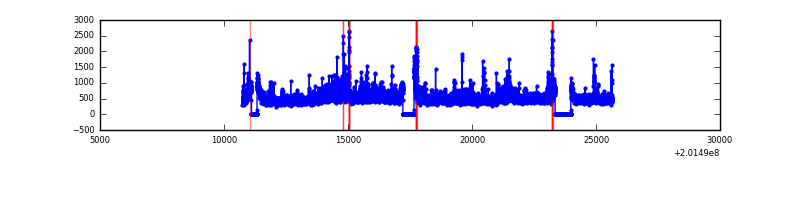 |
| C | 14905 | 13596 | 1311 | 1311 | 8.80% | 9.64% | 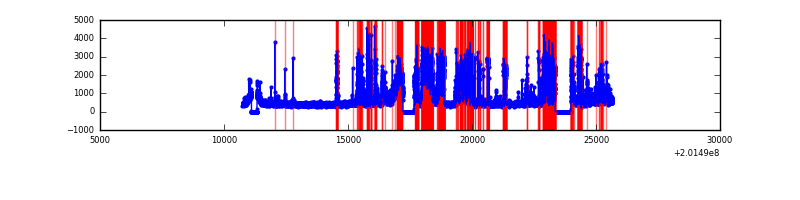 |
| D | 14905 | 13596 | 29 | 29 | 0.19% | 0.21% | 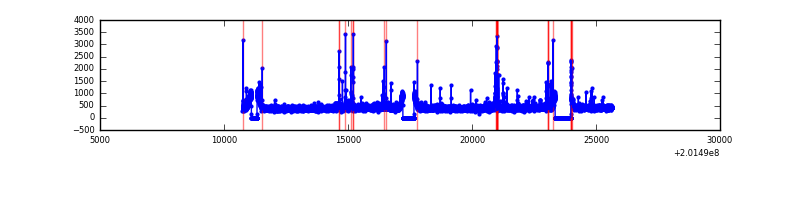 |
Top three noisy pixels from each quadrant. If the there are fewer than three noisy pixels in the level2.evt file, extra rows are filled as -1
| Pixel properties | Quadrant properties | ||||||
|---|---|---|---|---|---|---|---|
| Quadrant | DetID | PixID | Counts | Sigma | Mean | Median | Sigma |
| A | 0 | 50 | 956506 | 3013.49 | 1547 | 1512 | 316.9 |
| A | 8 | 15 | 39269 | 119.14 | 1547 | 1512 | 316.9 |
| A | 0 | 118 | 38414 | 116.44 | 1547 | 1512 | 316.9 |
| B | 15 | 204 | 804208 | 2605.98 | 1574 | 1536 | 308.0 |
| B | 4 | 81 | 184154 | 592.89 | 1574 | 1536 | 308.0 |
| B | 4 | 200 | 104509 | 334.32 | 1574 | 1536 | 308.0 |
| C | 1 | 192 | 4797527 | 14287.84 | 1435 | 1440 | 335.7 |
| C | 7 | 220 | 281295 | 833.71 | 1435 | 1440 | 335.7 |
| C | 15 | 208 | 77653 | 227.04 | 1435 | 1440 | 335.7 |
| D | 13 | 223 | 94154 | 252.27 | 1513 | 1465 | 367.4 |
| D | 13 | 239 | 29738 | 76.95 | 1513 | 1465 | 367.4 |
| D | 5 | 233 | 23108 | 58.91 | 1513 | 1465 | 367.4 |
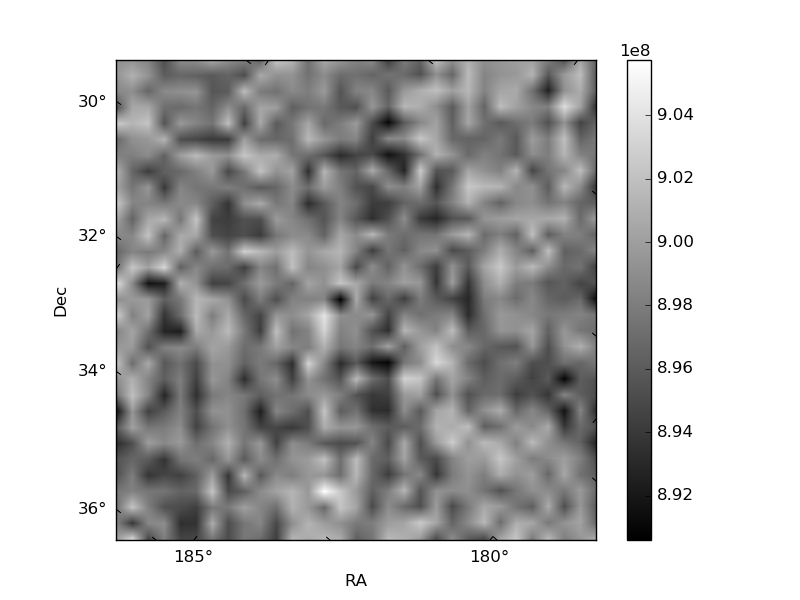
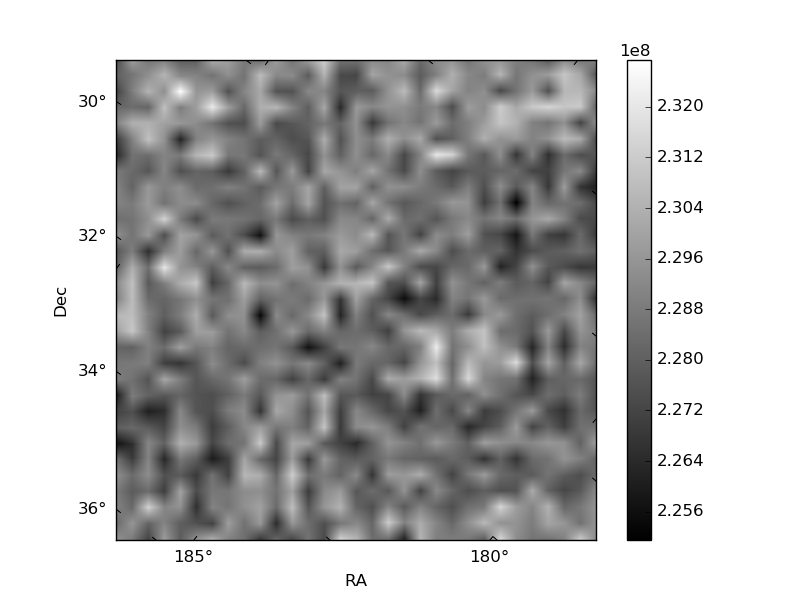
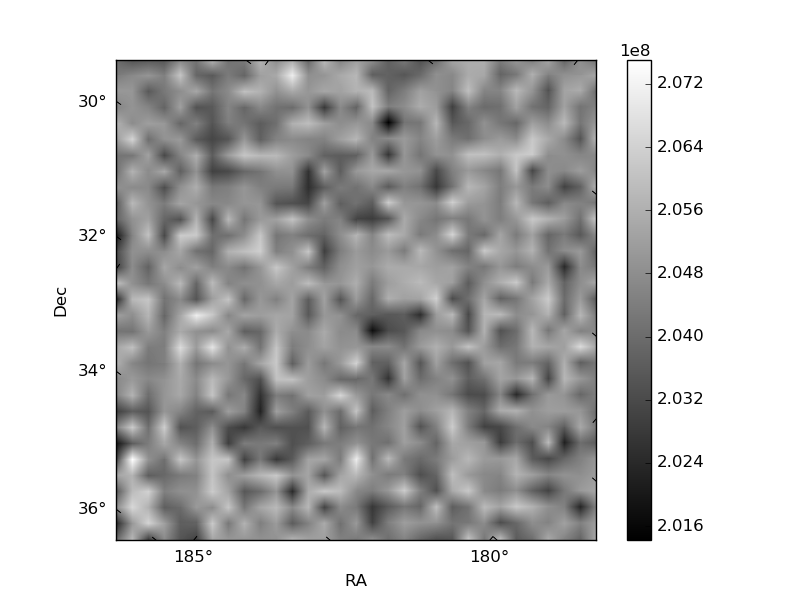
Histogram calculated using DETX and DETY for each event in the final _common_clean file
| Quadrant A | 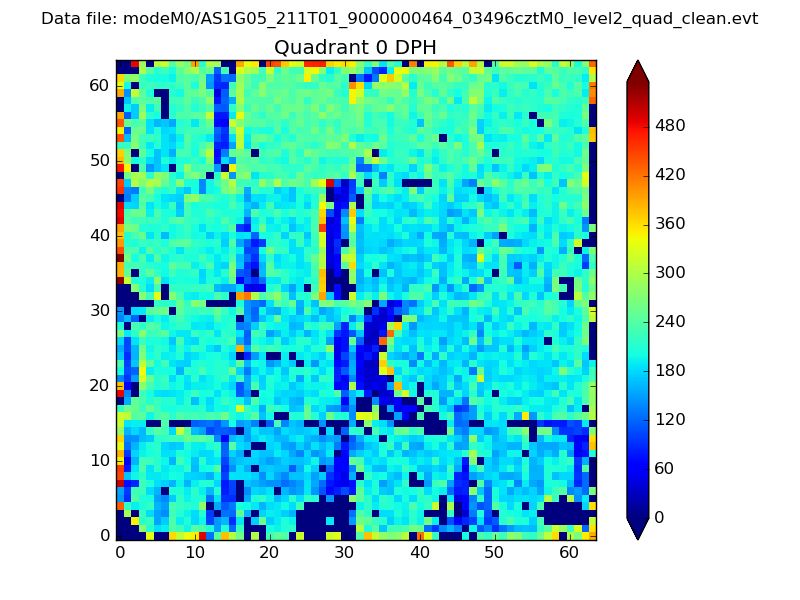 |
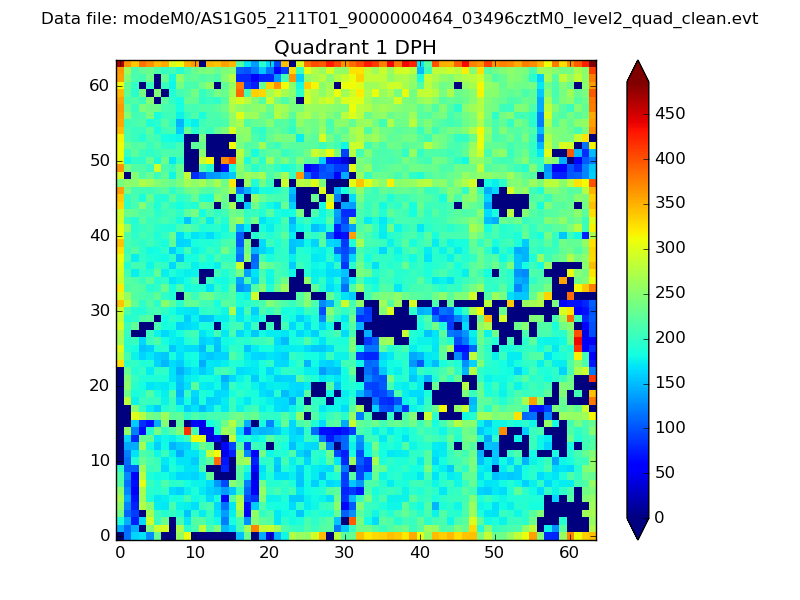 |
Quadrant B |
|---|---|---|---|
| Quadrant D | 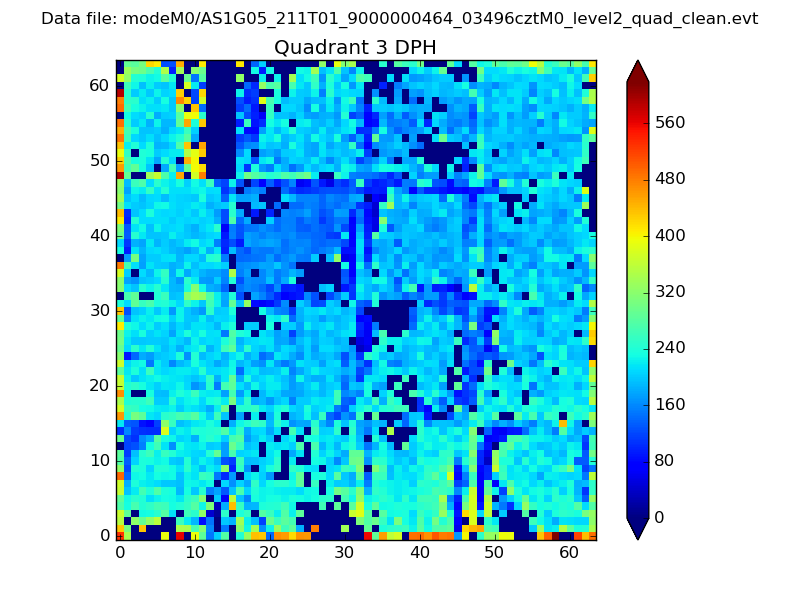 |
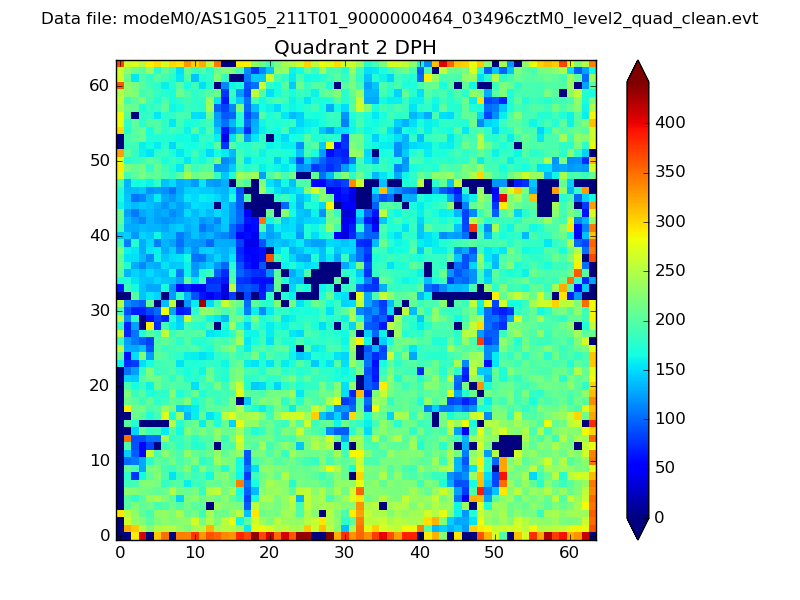 |
Quadrant C |
| Plot type | Count rate plots | Images |
|---|---|---|
| Comparison with Poisson distribution Blue bars denote a histogram of data divided into 1 sec bins. Red curve is a Poisson curve with rate = median count rate of data. |
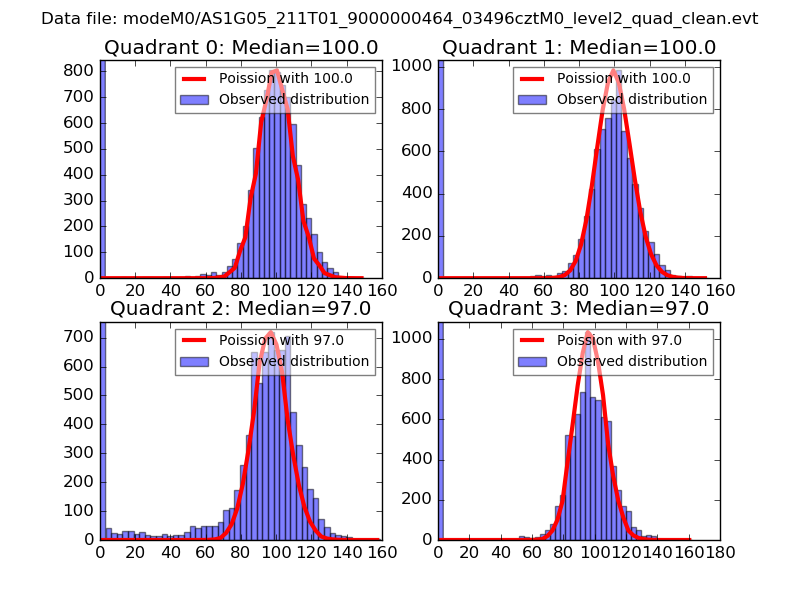 |
 |
| Quadrant-wise count rates Data is divided into 100 sec bins |
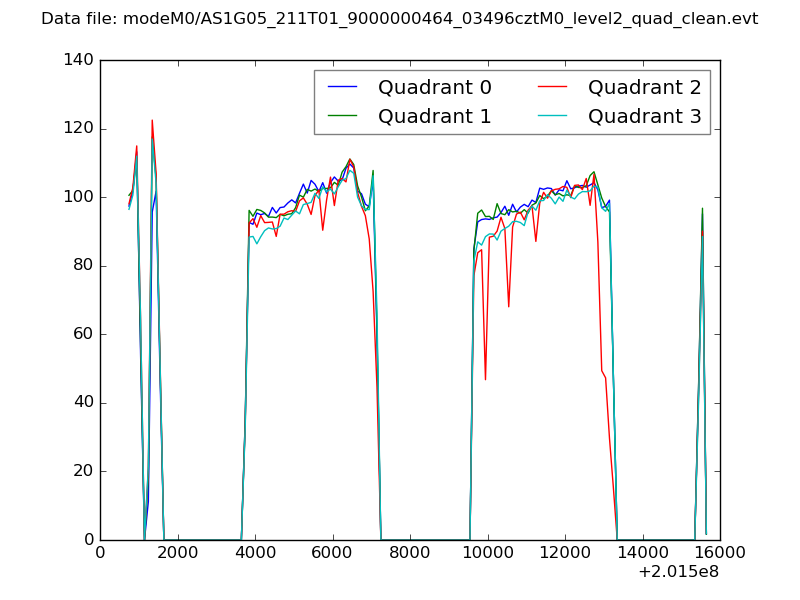 |
|
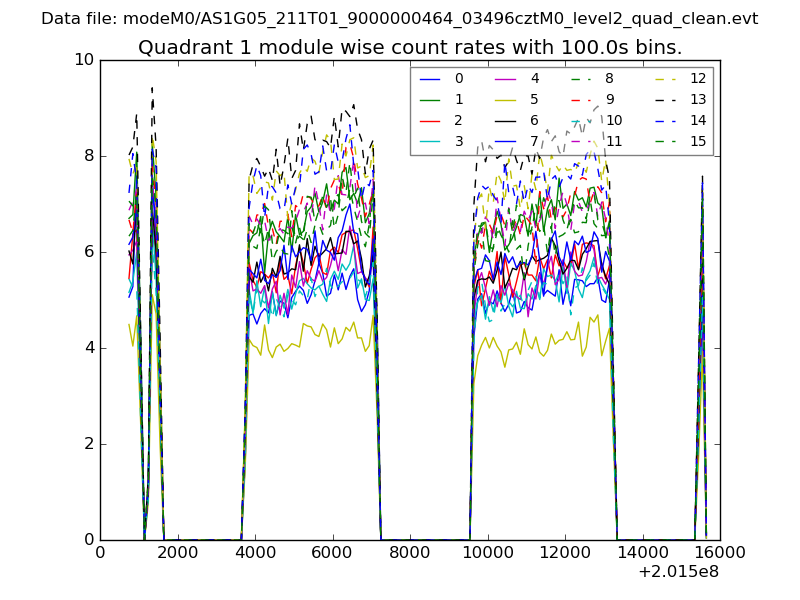
| Module-wise count rates for Quadrant A Data is divided into 100 sec bins |
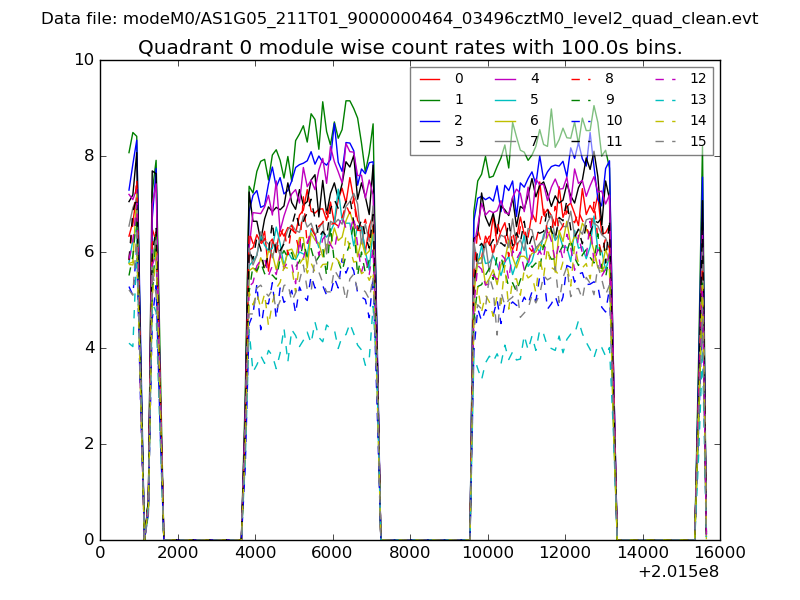 |
 |
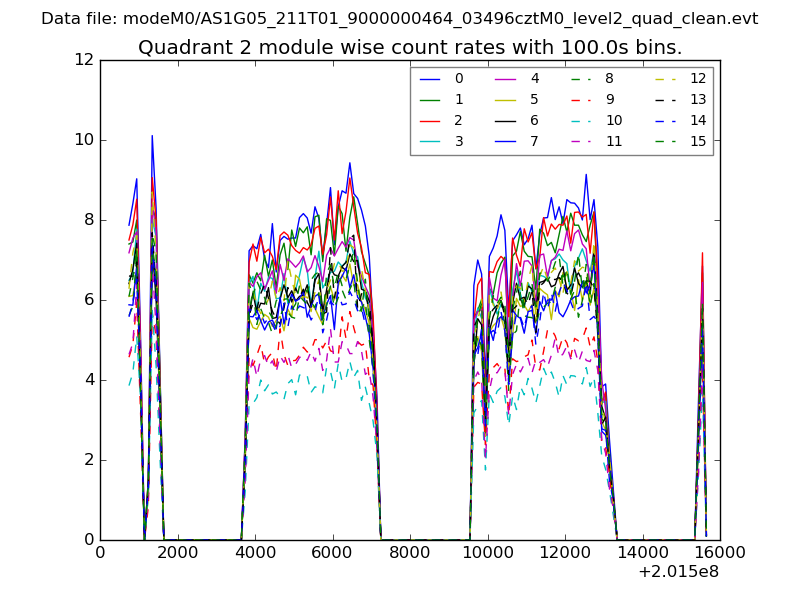
| Module-wise count rates for Quadrant B Data is divided into 100 sec bins |
 |
 |
| Module-wise count rates for Quadrant C Data is divided into 100 sec bins |
 |
 |
| Module-wise count rates for Quadrant D Data is divided into 100 sec bins |
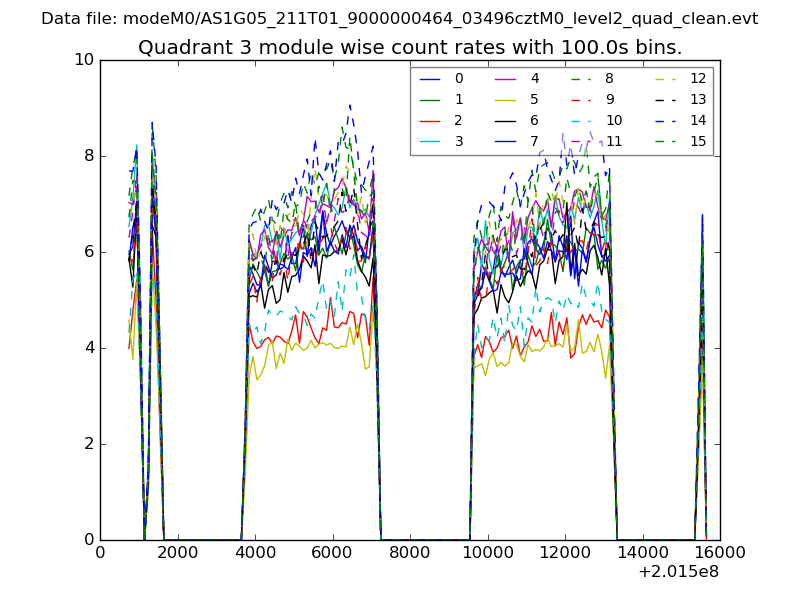 |
 |
| Parameter | Plot |
|---|---|
| CZT HV Monitor | 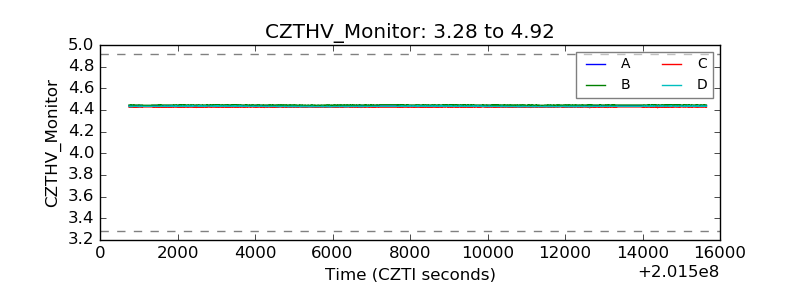 |
| D_VDD | 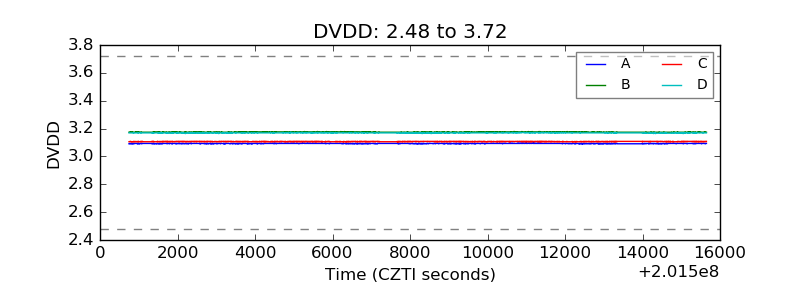 |
| Temperature 1 | 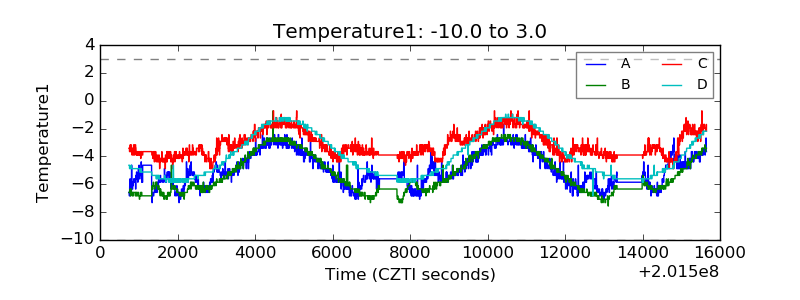 |
| Veto HV Monitor | 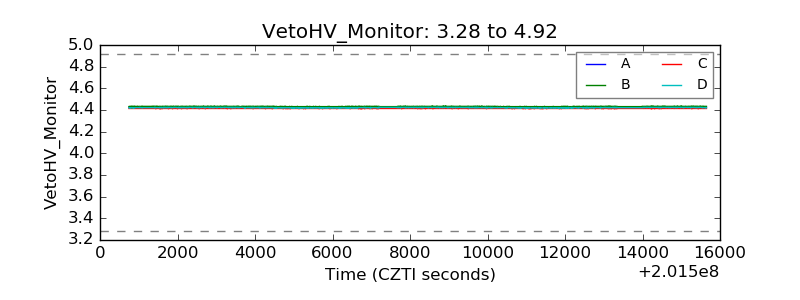 |
| Veto LLD | 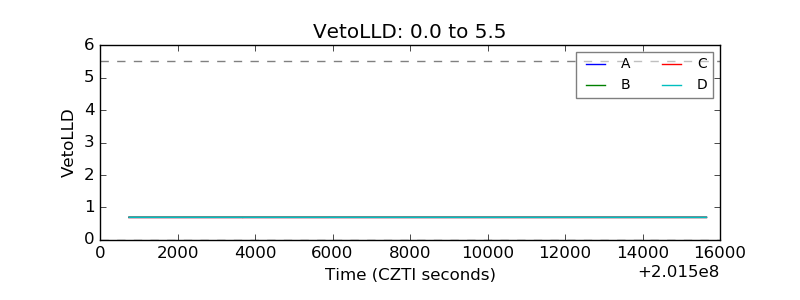 |
| Alpha Counter | 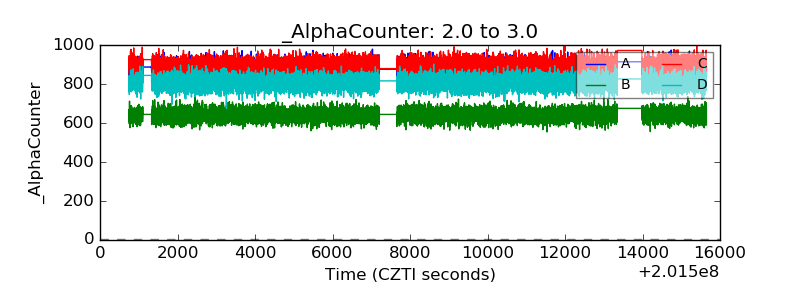 |
| _CPM_Rate | 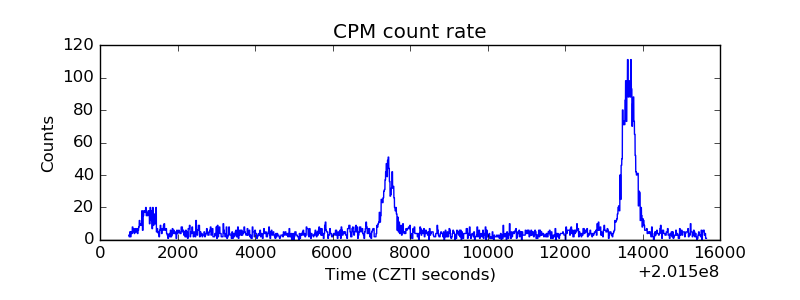 |
| CZT Counter | 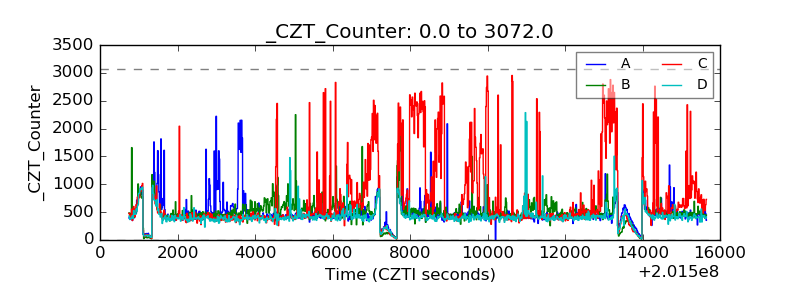 |
| +2.5 Volts monitor |  |
| +5 Volts monitor |  |
| Veto Counter | 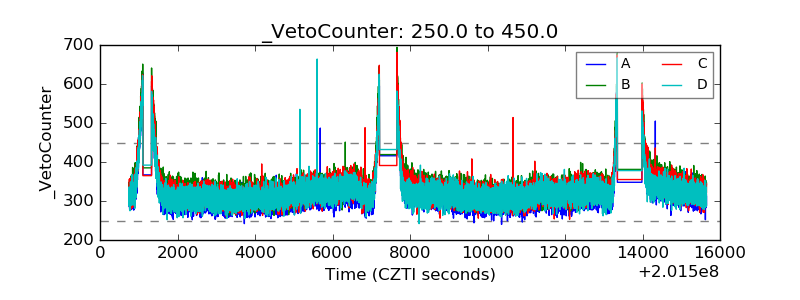 |