| Param | Original file | Final file |
|---|---|---|
| Filename | modeM0/AS1G05_245T01_9000000460_03468cztM0_level2.evt | modeM0/AS1G05_245T01_9000000460_03468cztM0_level2_quad_clean.evt |
| Size (bytes) | 137,937,600 | 18,270,720 |
| Size | 131.5 MB | 17.4 MB |
| Events in quadrant A | 1,038,040 | 101,422 |
| Events in quadrant B | 1,097,065 | 103,141 |
| Events in quadrant C | 957,281 | 102,724 |
| Events in quadrant D | 944,945 | 98,307 |
| Mode M0 | |||
|---|---|---|---|
| Quadrant | BADHDUFLAG | Total packets | Discarded packets |
| A | 0 | 4312 | 2 |
| B | 0 | 4466 | 1 |
| C | 0 | 4178 | 1 |
| D | 0 | 4222 | 1 |
| Mode SS | |||
|---|---|---|---|
| Quadrant | BADHDUFLAG | Total packets | Discarded packets |
| A | 0 | 44 | 0 |
| B | 0 | 44 | 0 |
| C | 0 | 44 | 0 |
| D | 0 | 44 | 0 |
| Mode M9 | |||
|---|---|---|---|
| Quadrant | BADHDUFLAG | Total packets | Discarded packets |
| A | 0 | 8 | 0 |
| B | 0 | 8 | 0 |
| C | 0 | 8 | 0 |
| D | 0 | 8 | 0 |
| Quadrant | Total seconds | Saturated seconds | Saturation percentage |
|---|---|---|---|
| A | 2016 | 66 | 3.273810% |
| B | 2016 | 58 | 2.876984% |
| C | 2016 | 47 | 2.331349% |
| D | 2016 | 49 | 2.430556% |
Noise dominated data is calculated using 1-second bins in cleaned event files. If a bin has >2000 counts, and if more than 50% of those come from <1% of pixels, then it is considered to be noise-dominated and hence unusable.
| Quadrant | # 1 sec bins | Bins with >0 counts | Bins with >2000 counts | High rate bins dominated by noise | Noise dominated (total time) | Noise dominated (detector-on time) | Marked lightcurve |
|---|---|---|---|---|---|---|---|
| A | 2871 | 2016 | 6 | 6 | 0.21% | 0.30% | 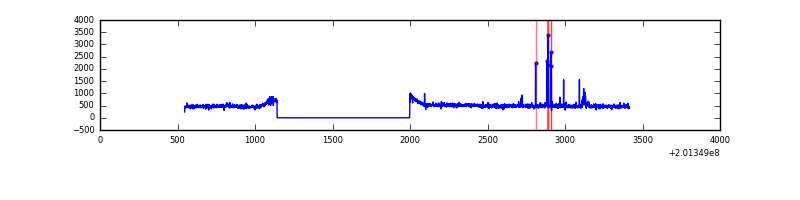 |
| B | 2871 | 2016 | 2 | 2 | 0.07% | 0.10% | 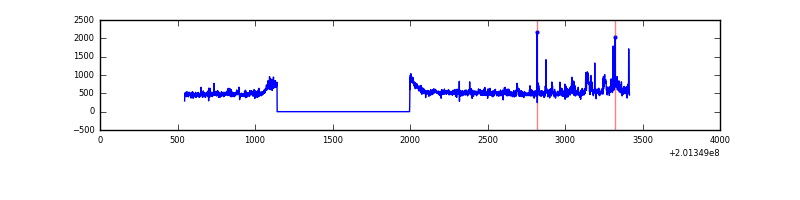 |
| C | 2871 | 2016 | 0 | 0 | 0.00% | 0.00% | 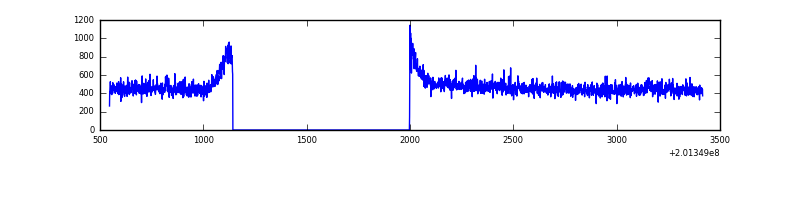 |
| D | 2871 | 2016 | 3 | 3 | 0.10% | 0.15% | 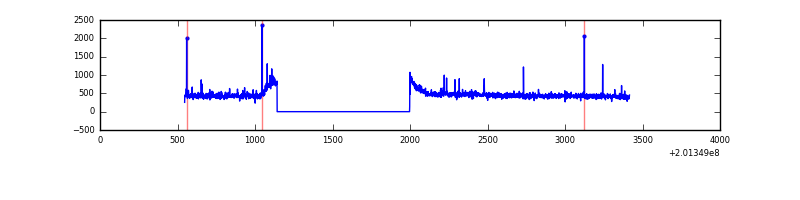 |
Top three noisy pixels from each quadrant. If the there are fewer than three noisy pixels in the level2.evt file, extra rows are filled as -1
| Pixel properties | Quadrant properties | ||||||
|---|---|---|---|---|---|---|---|
| Quadrant | DetID | PixID | Counts | Sigma | Mean | Median | Sigma |
| A | 0 | 118 | 30257 | 553.3 | 253 | 247 | 54.2 |
| A | 8 | 15 | 19586 | 356.56 | 253 | 247 | 54.2 |
| A | 14 | 111 | 6531 | 115.86 | 253 | 247 | 54.2 |
| B | 15 | 204 | 87194 | 1671.53 | 256 | 250 | 52.0 |
| B | 0 | 229 | 6561 | 121.33 | 256 | 250 | 52.0 |
| B | 12 | 111 | 3643 | 65.23 | 256 | 250 | 52.0 |
| C | 1 | 192 | 4410 | 71.65 | 242 | 243 | 58.2 |
| C | 15 | 208 | 3420 | 54.63 | 242 | 243 | 58.2 |
| C | 12 | 175 | 2154 | 32.86 | 242 | 243 | 58.2 |
| D | 13 | 223 | 11065 | 179.68 | 242 | 235 | 60.3 |
| D | 5 | 233 | 8726 | 140.88 | 242 | 235 | 60.3 |
| D | 2 | 37 | 4963 | 78.44 | 242 | 235 | 60.3 |
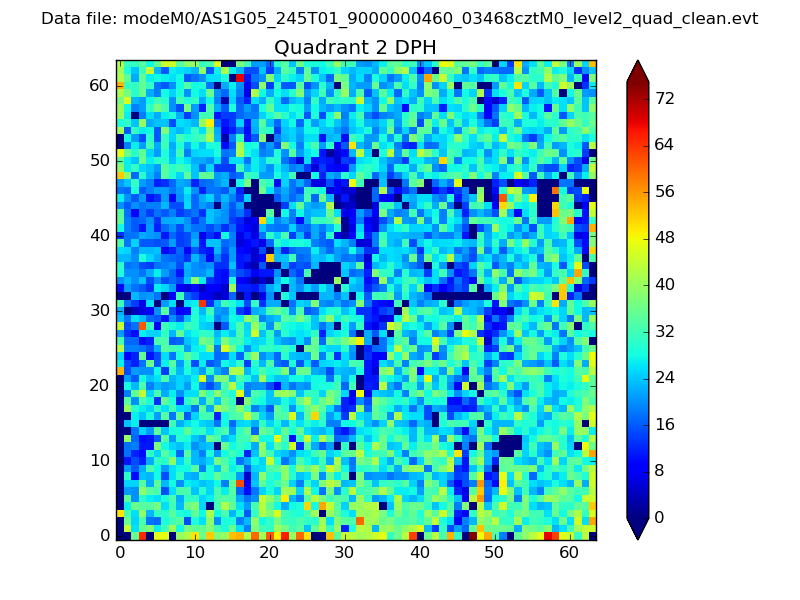
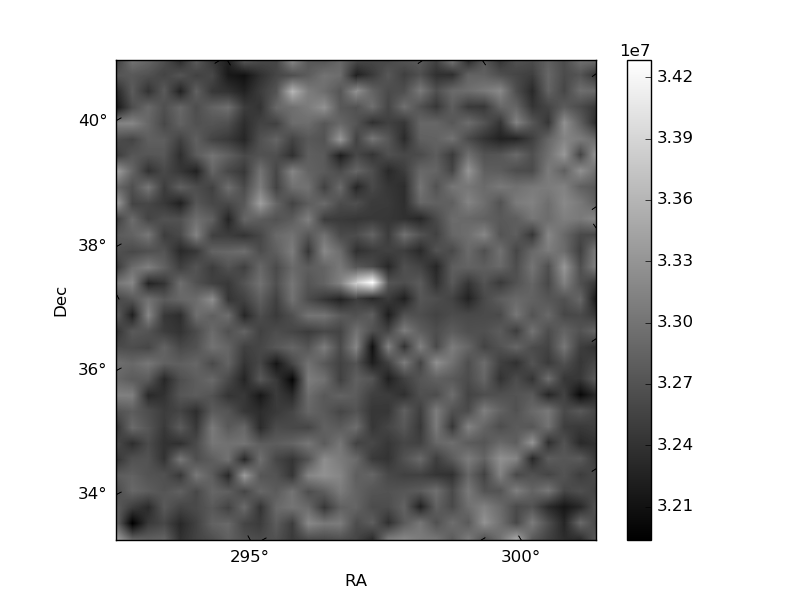
Histogram calculated using DETX and DETY for each event in the final _common_clean file
| Quadrant A | 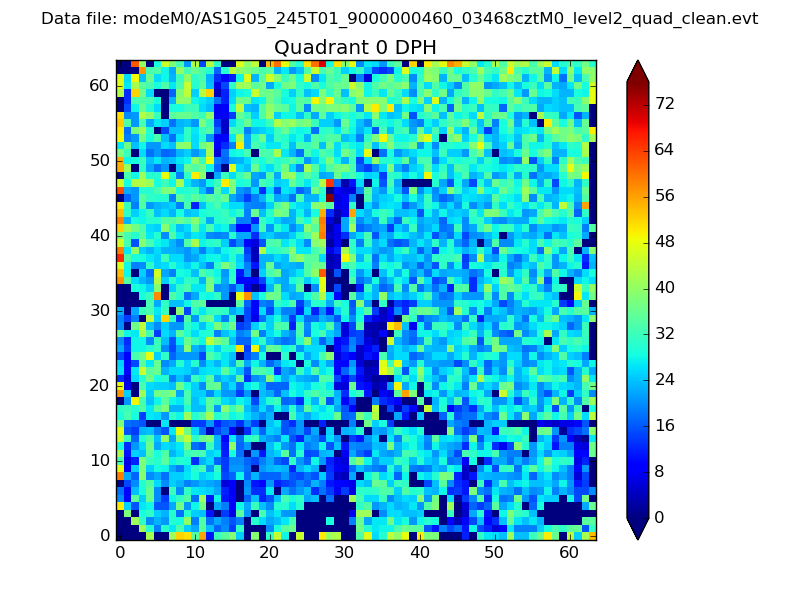 |
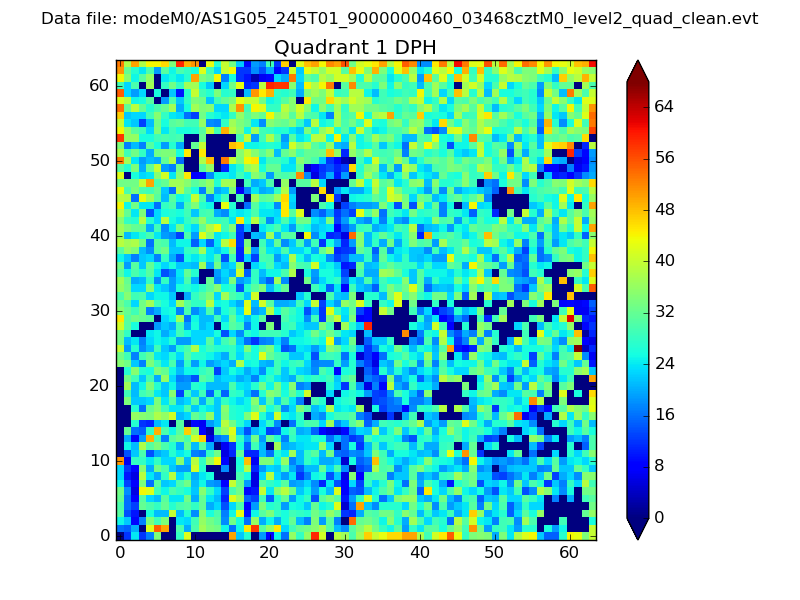 |
Quadrant B |
|---|---|---|---|
| Quadrant D | 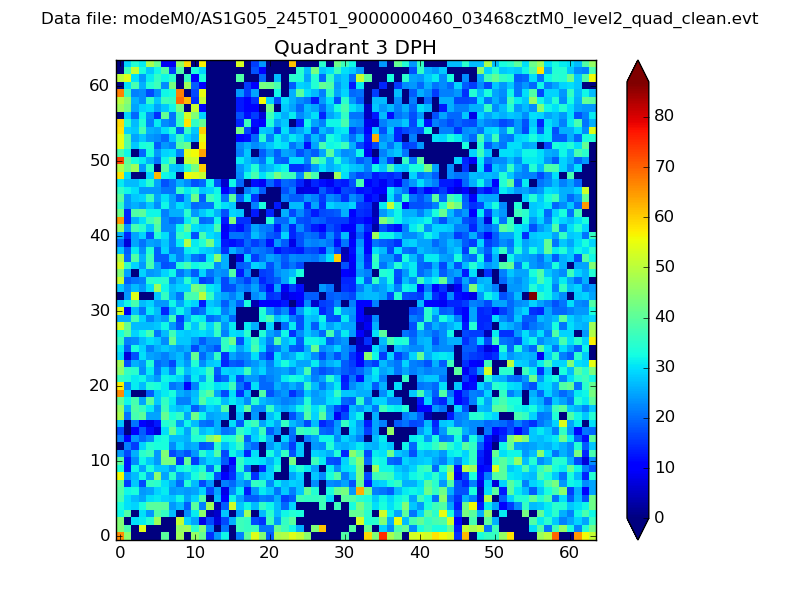 |
 |
Quadrant C |
| Plot type | Count rate plots | Images |
|---|---|---|
| Comparison with Poisson distribution Blue bars denote a histogram of data divided into 1 sec bins. Red curve is a Poisson curve with rate = median count rate of data. |
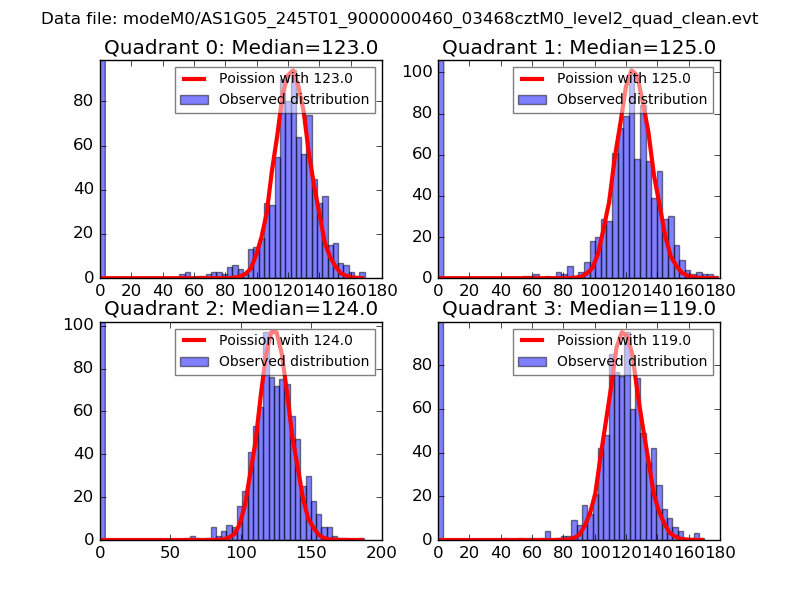 |
 |
| Quadrant-wise count rates Data is divided into 100 sec bins |
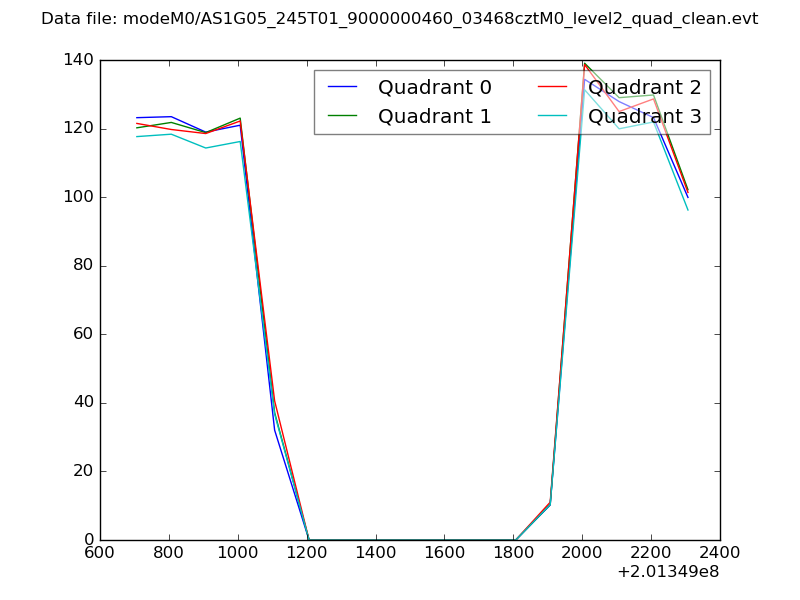 |
|
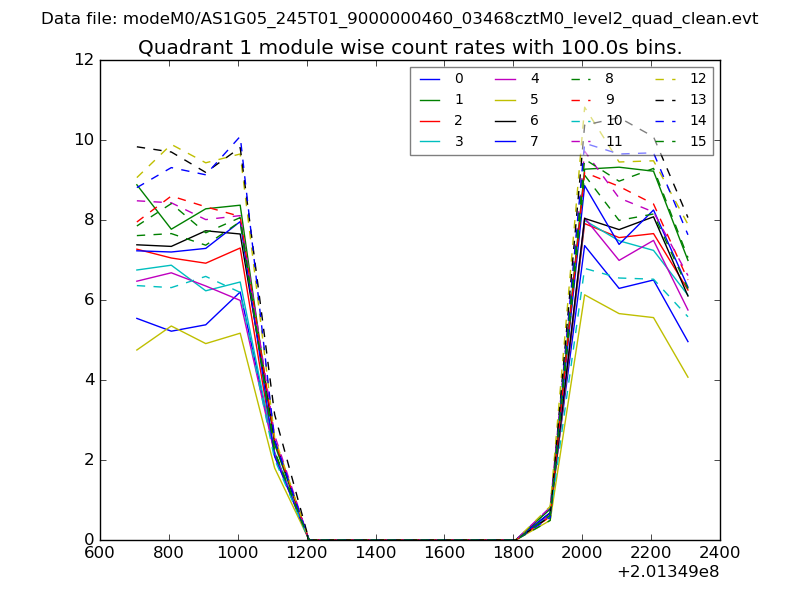
| Module-wise count rates for Quadrant A Data is divided into 100 sec bins |
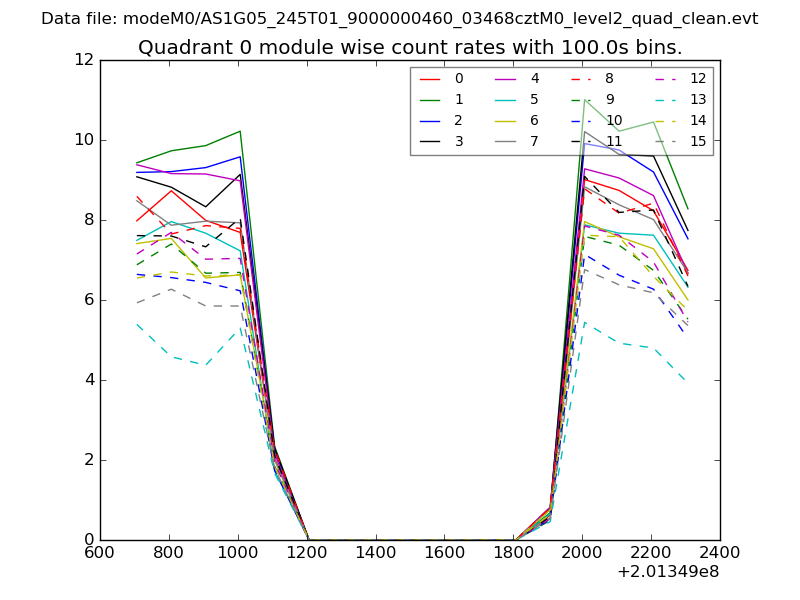 |
 |
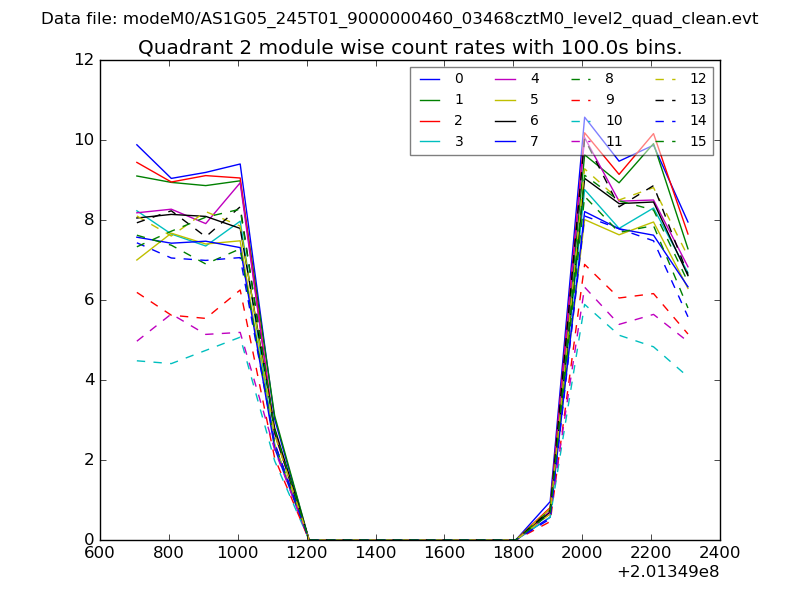
| Module-wise count rates for Quadrant B Data is divided into 100 sec bins |
 |
 |
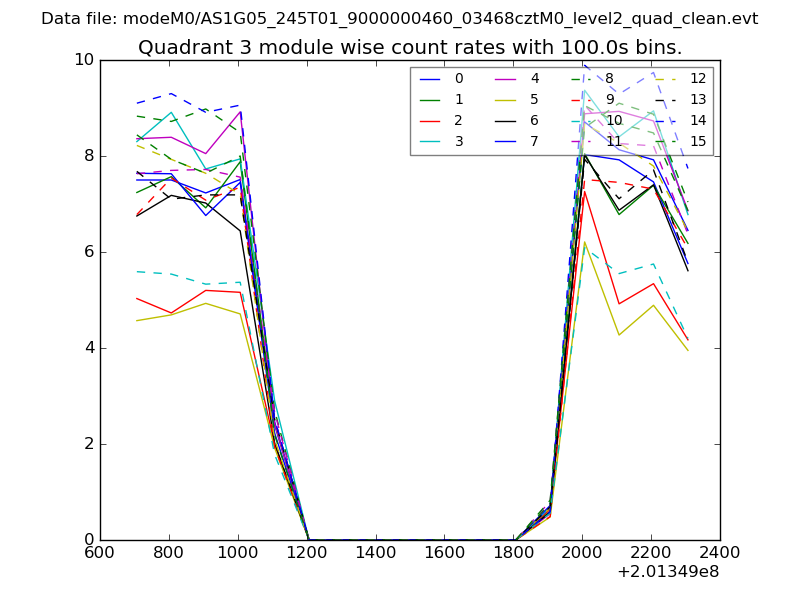
| Module-wise count rates for Quadrant C Data is divided into 100 sec bins |
 |
 |
| Module-wise count rates for Quadrant D Data is divided into 100 sec bins |
 |
 |
| Parameter | Plot |
|---|---|
| CZT HV Monitor | 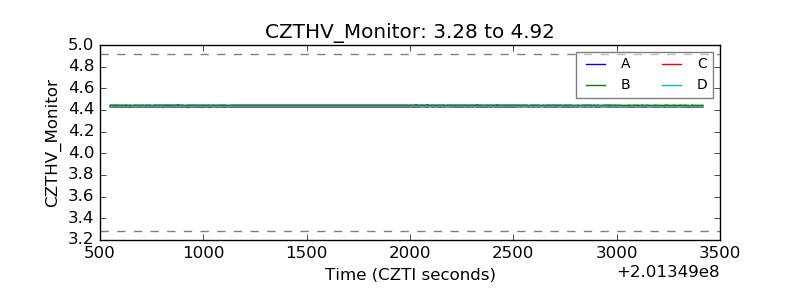 |
| D_VDD |  |
| Temperature 1 | 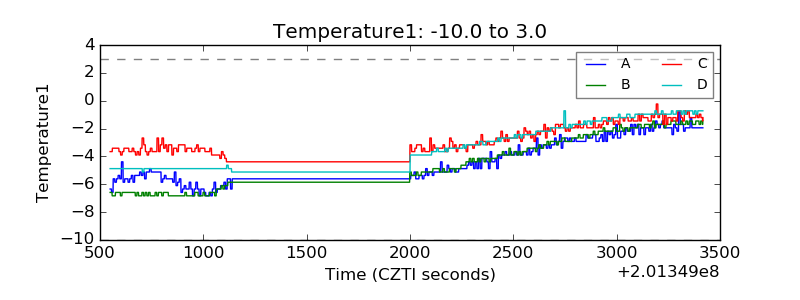 |
| Veto HV Monitor |  |
| Veto LLD | 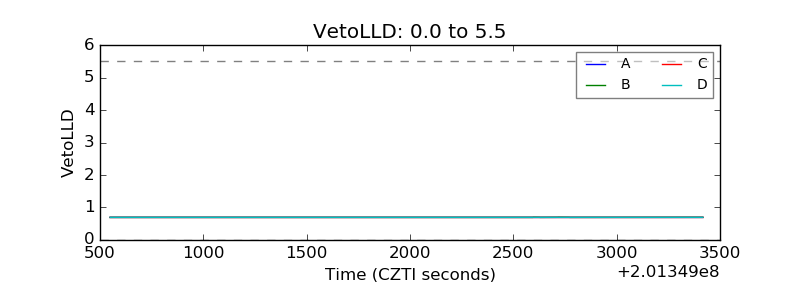 |
| Alpha Counter | 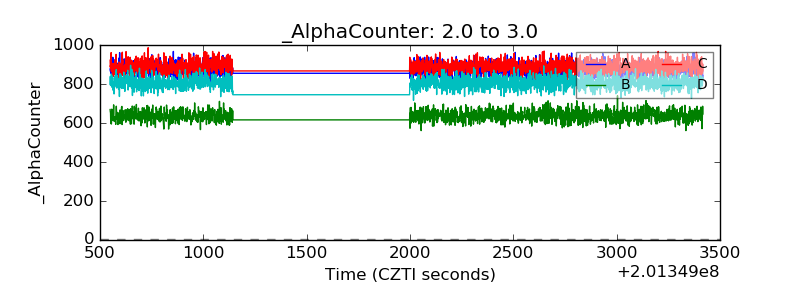 |
| _CPM_Rate | 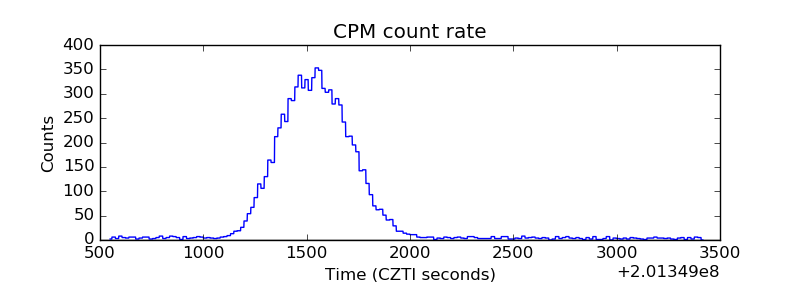 |
| CZT Counter | 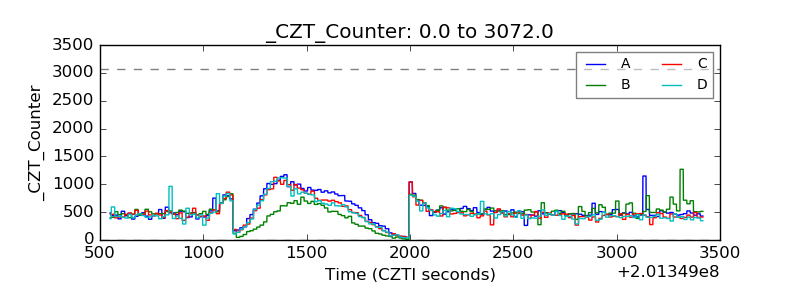 |
| +2.5 Volts monitor |  |
| +5 Volts monitor |  |
| _ROLL_ROT | 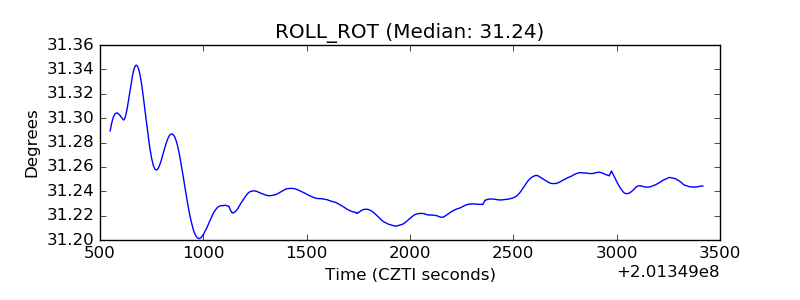 |
| _Roll_DEC | 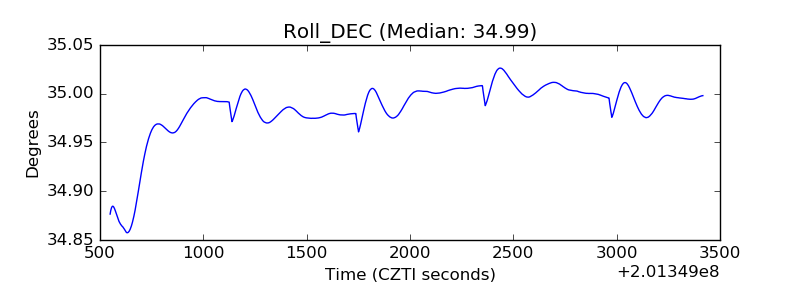 |
| _Roll_RA |  |
| Veto Counter | 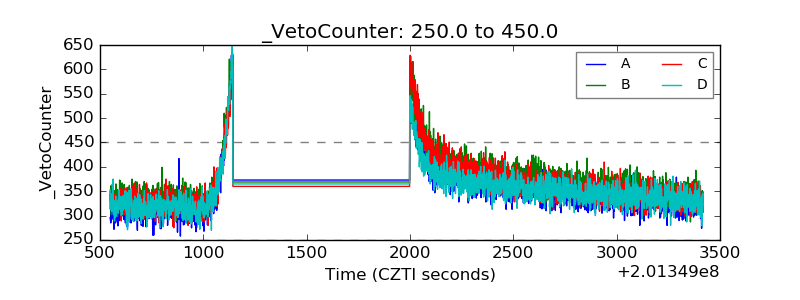 |