| Param | Original file | Final file |
|---|---|---|
| Filename | modeM0/AS1G05_245T01_9000000460_03469cztM0_level2.evt | modeM0/AS1G05_245T01_9000000460_03469cztM0_level2_quad_clean.evt |
| Size (bytes) | 472,510,080 | 64,068,480 |
| Size | 450.6 MB | 61.1 MB |
| Events in quadrant A | 3,507,925 | 366,173 |
| Events in quadrant B | 4,146,847 | 372,615 |
| Events in quadrant C | 3,103,280 | 371,677 |
| Events in quadrant D | 3,092,902 | 358,323 |
| Mode M0 | |||
|---|---|---|---|
| Quadrant | BADHDUFLAG | Total packets | Discarded packets |
| A | 0 | 14801 | 2 |
| B | 0 | 16679 | 1 |
| C | 0 | 13795 | 1 |
| D | 0 | 14049 | 1 |
| Mode SS | |||
|---|---|---|---|
| Quadrant | BADHDUFLAG | Total packets | Discarded packets |
| A | 0 | 136 | 0 |
| B | 0 | 136 | 0 |
| C | 0 | 136 | 0 |
| D | 0 | 136 | 0 |
| Mode M9 | |||
|---|---|---|---|
| Quadrant | BADHDUFLAG | Total packets | Discarded packets |
| A | 0 | 10 | 0 |
| B | 0 | 10 | 0 |
| C | 0 | 10 | 0 |
| D | 0 | 10 | 0 |
| Quadrant | Total seconds | Saturated seconds | Saturation percentage |
|---|---|---|---|
| A | 6760 | 342 | 5.059172% |
| B | 6760 | 111 | 1.642012% |
| C | 6760 | 77 | 1.139053% |
| D | 6760 | 89 | 1.316568% |
Noise dominated data is calculated using 1-second bins in cleaned event files. If a bin has >2000 counts, and if more than 50% of those come from <1% of pixels, then it is considered to be noise-dominated and hence unusable.
| Quadrant | # 1 sec bins | Bins with >0 counts | Bins with >2000 counts | High rate bins dominated by noise | Noise dominated (total time) | Noise dominated (detector-on time) | Marked lightcurve |
|---|---|---|---|---|---|---|---|
| A | 7745 | 6760 | 22 | 22 | 0.28% | 0.33% | 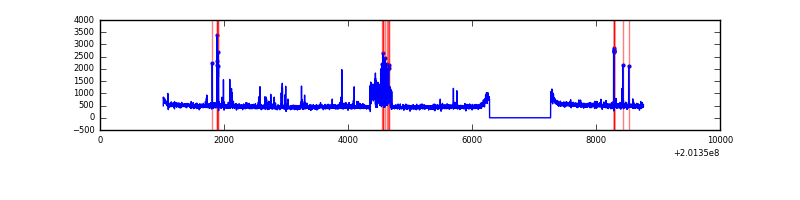 |
| B | 7745 | 6760 | 7 | 7 | 0.09% | 0.10% | 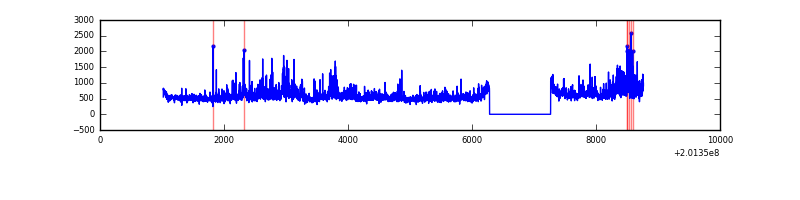 |
| C | 7745 | 6760 | 0 | 0 | 0.00% | 0.00% | 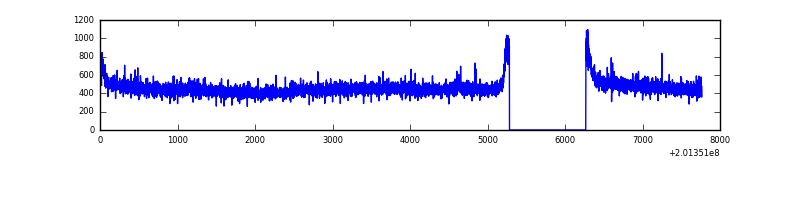 |
| D | 7745 | 6760 | 15 | 15 | 0.19% | 0.22% | 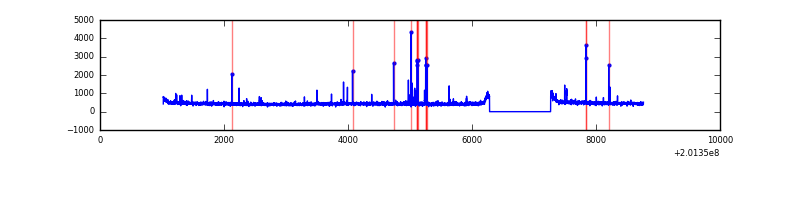 |
Top three noisy pixels from each quadrant. If the there are fewer than three noisy pixels in the level2.evt file, extra rows are filled as -1
| Pixel properties | Quadrant properties | ||||||
|---|---|---|---|---|---|---|---|
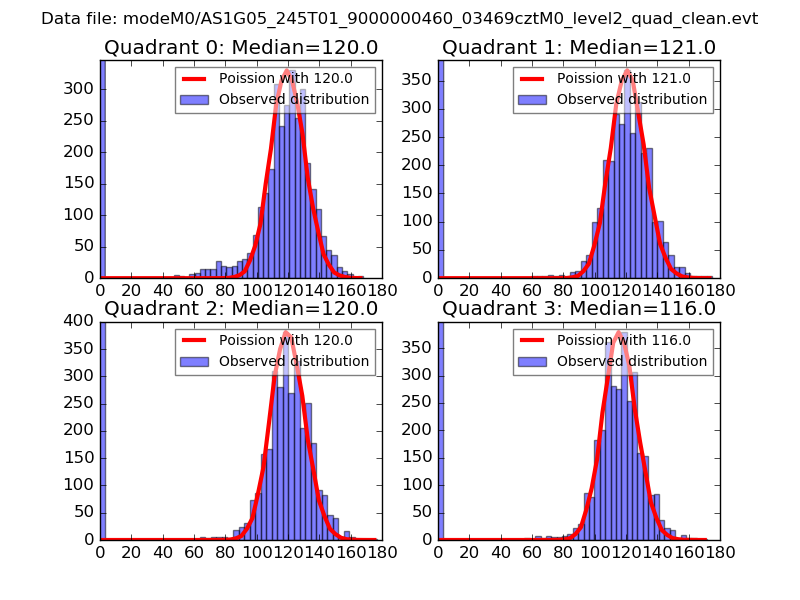
| Quadrant | DetID | PixID | Counts | Sigma | Mean | Median | Sigma |
| A | 14 | 111 | 183061 | 1101.81 | 809 | 794 | 165.4 |
| A | 0 | 118 | 130245 | 782.54 | 809 | 794 | 165.4 |
| A | 8 | 15 | 40193 | 238.17 | 809 | 794 | 165.4 |
| B | 15 | 204 | 725922 | 4512.12 | 824 | 807 | 160.7 |
| B | 14 | 167 | 73552 | 452.67 | 824 | 807 | 160.7 |
| B | 3 | 0 | 71003 | 436.8 | 824 | 807 | 160.7 |
| C | 1 | 16 | 7543 | 36.77 | 787 | 791 | 183.6 |
| C | 13 | 61 | 6663 | 31.98 | 787 | 791 | 183.6 |
| C | 1 | 192 | 5154 | 23.76 | 787 | 791 | 183.6 |
| D | 2 | 37 | 28504 | 146.16 | 785 | 764 | 189.8 |
| D | 13 | 223 | 27652 | 141.67 | 785 | 764 | 189.8 |
| D | 5 | 233 | 19115 | 96.69 | 785 | 764 | 189.8 |
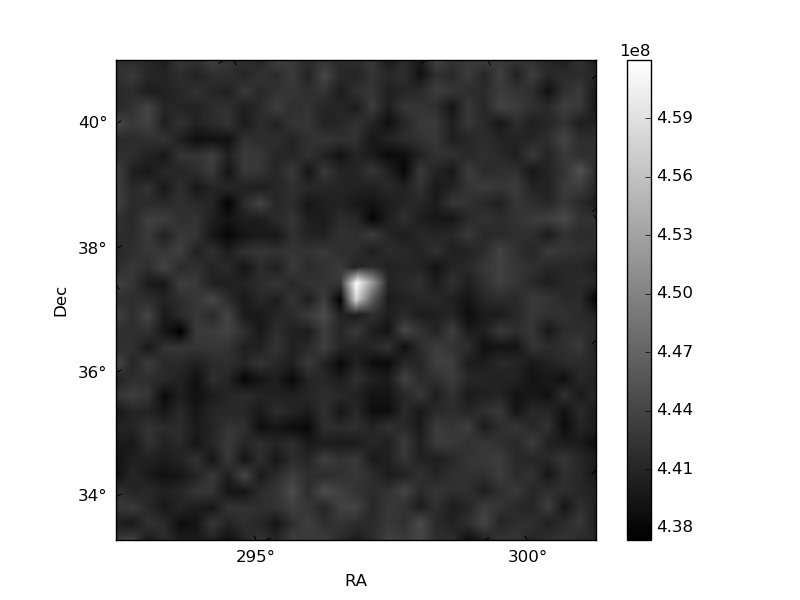
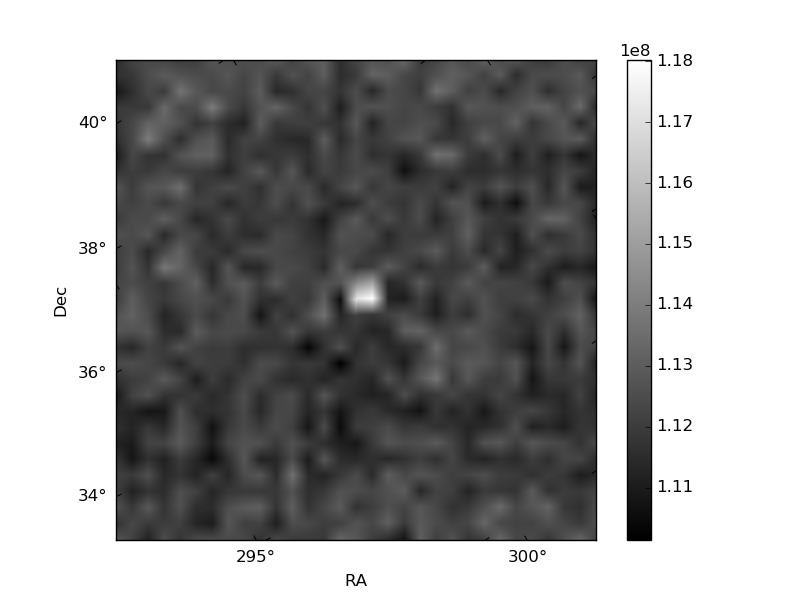
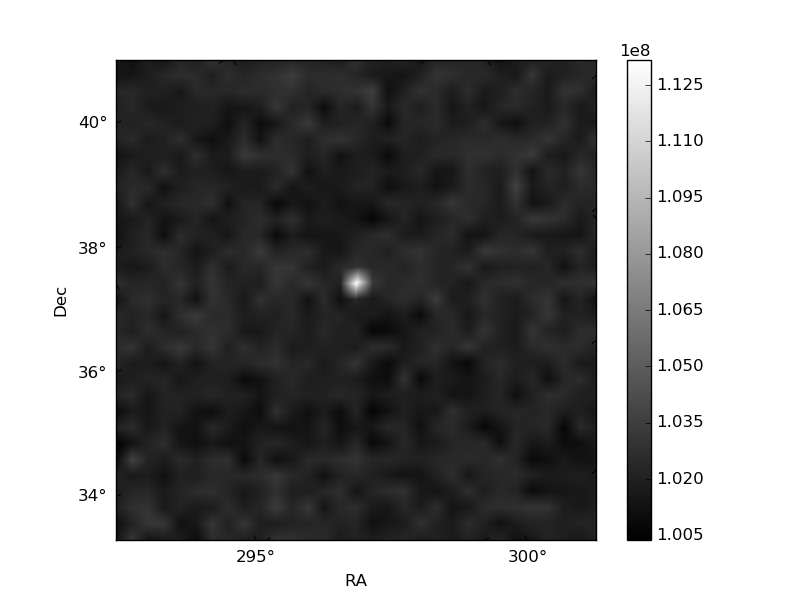
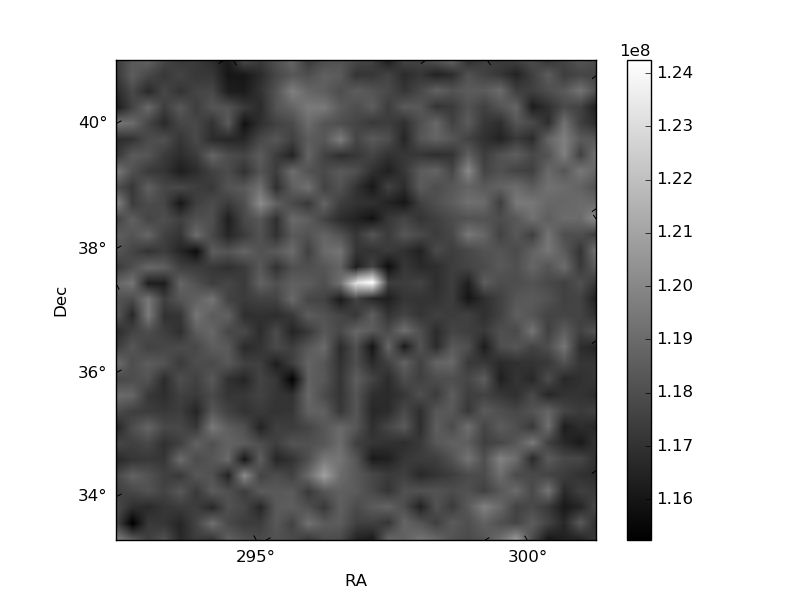
Histogram calculated using DETX and DETY for each event in the final _common_clean file
| Quadrant A | 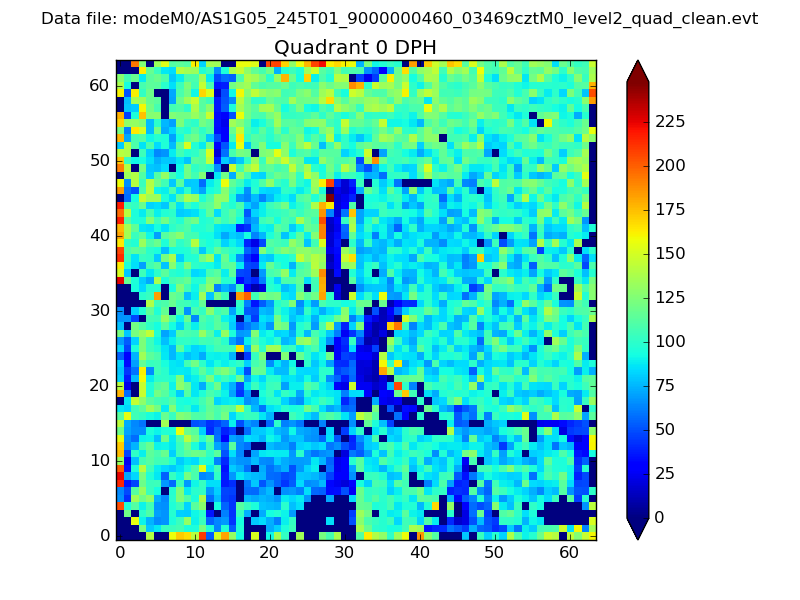 |
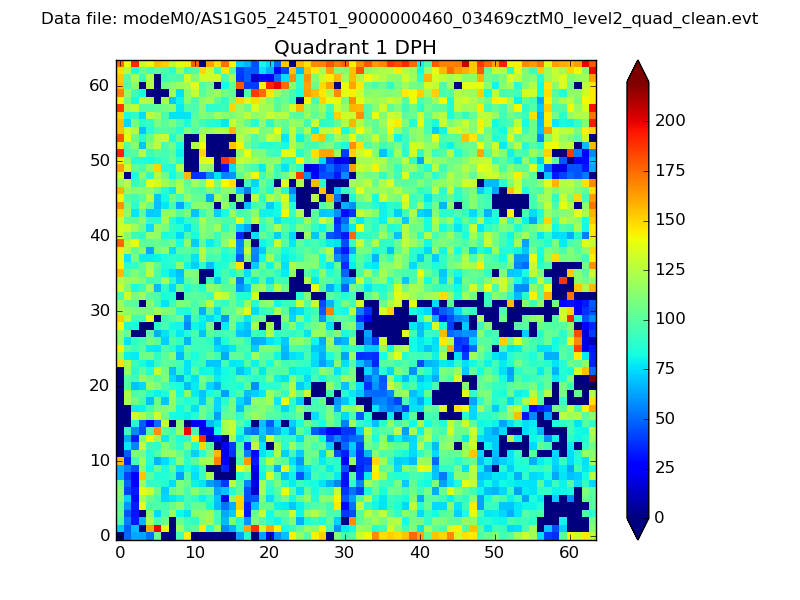 |
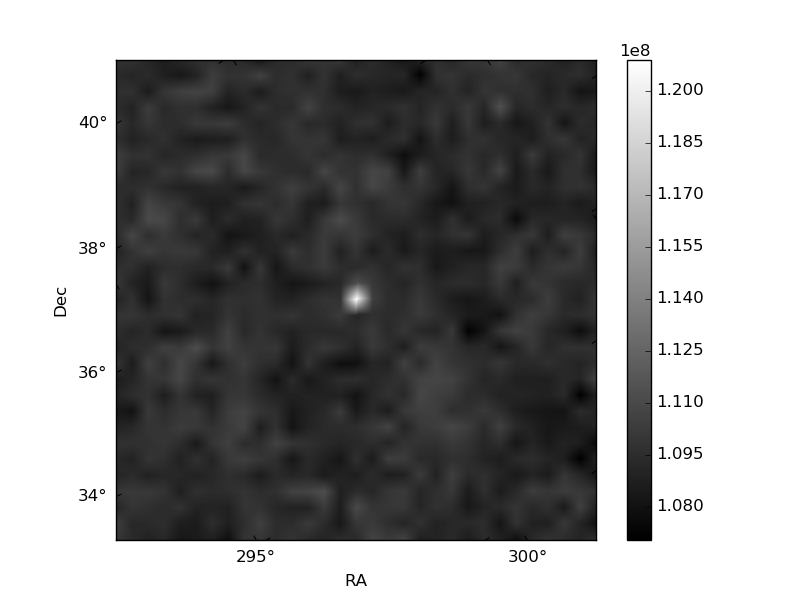
Quadrant B |
|---|---|---|---|
| Quadrant D | 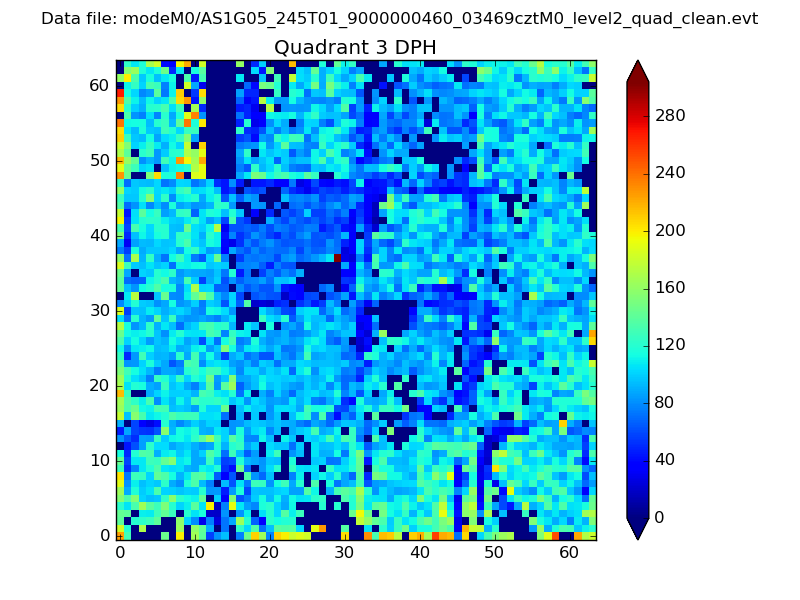 |
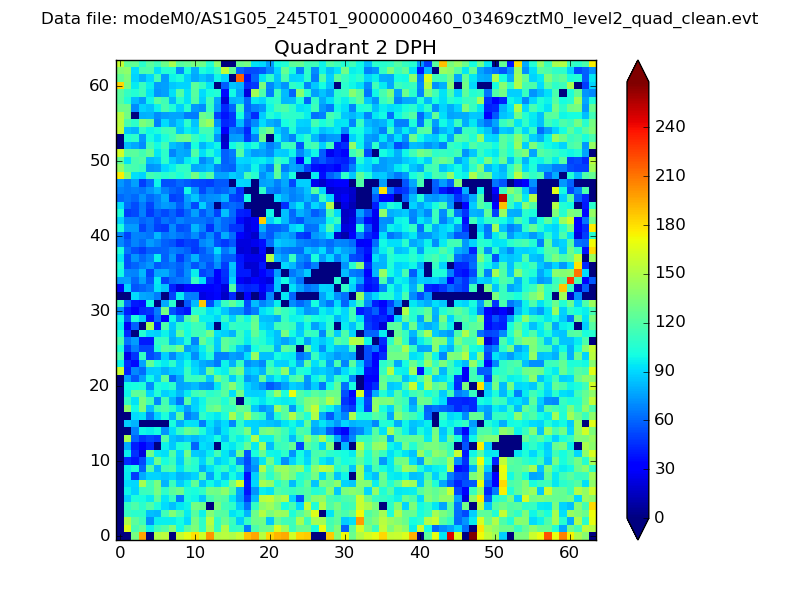 |
Quadrant C |
| Plot type | Count rate plots | Images |
|---|---|---|
| Comparison with Poisson distribution Blue bars denote a histogram of data divided into 1 sec bins. Red curve is a Poisson curve with rate = median count rate of data. |
 |
 |
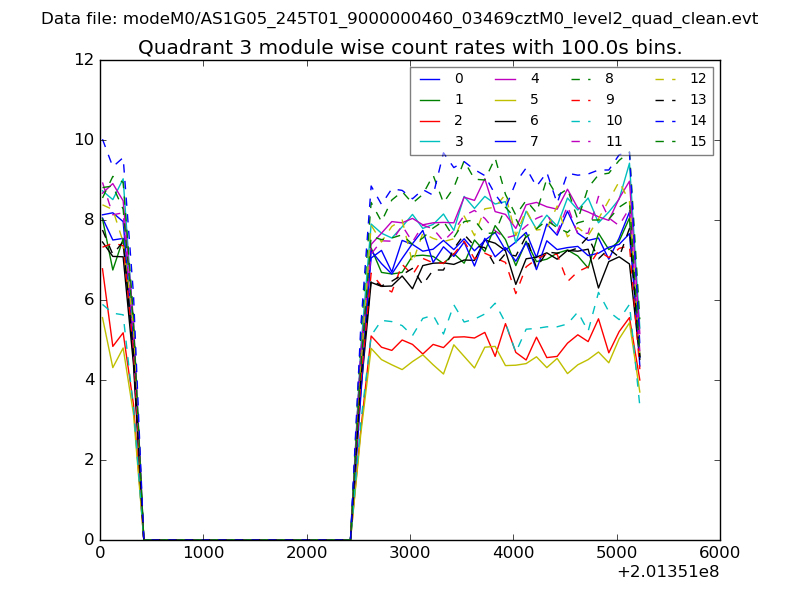
| Quadrant-wise count rates Data is divided into 100 sec bins |
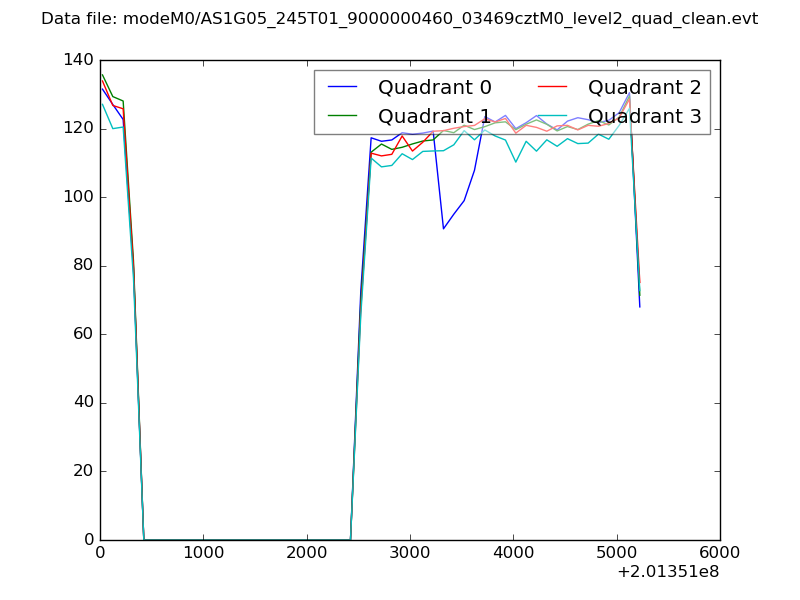 |
|
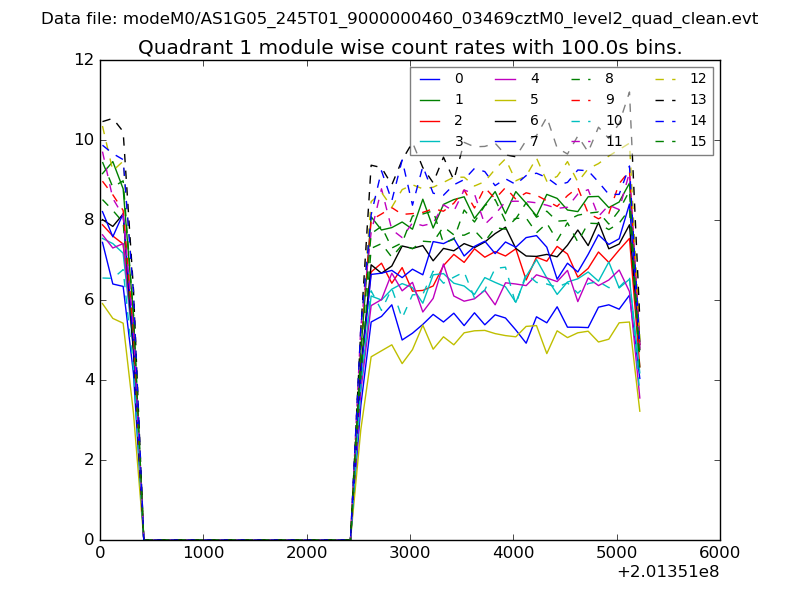
| Module-wise count rates for Quadrant A Data is divided into 100 sec bins |
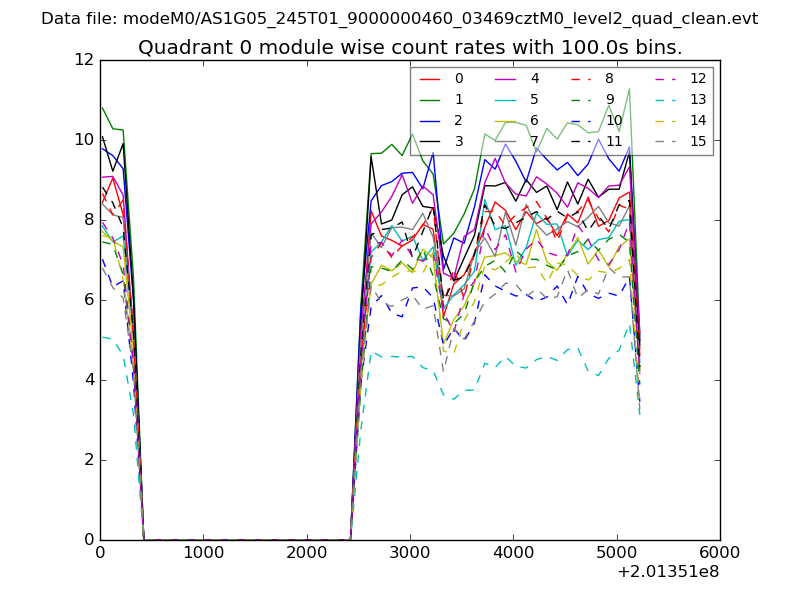 |
 |
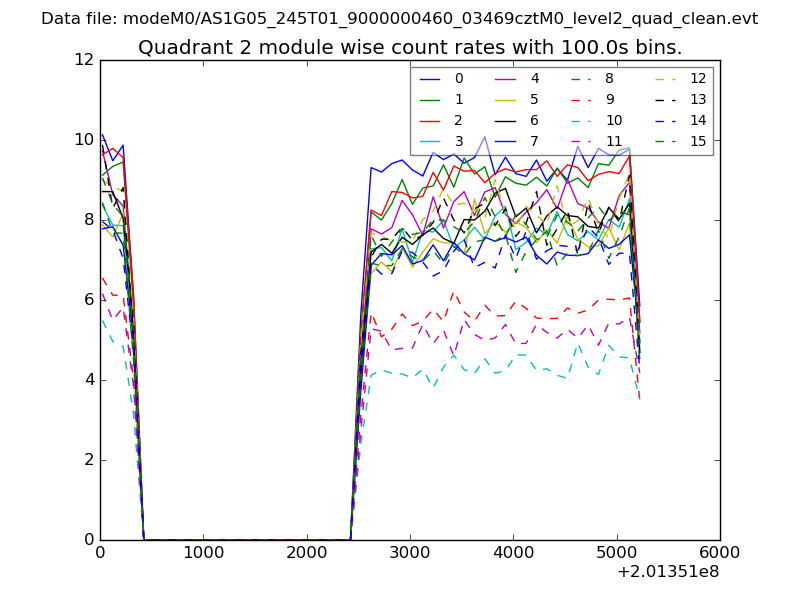
| Module-wise count rates for Quadrant B Data is divided into 100 sec bins |
 |
 |
| Module-wise count rates for Quadrant C Data is divided into 100 sec bins |
 |
 |
| Module-wise count rates for Quadrant D Data is divided into 100 sec bins |
 |
 |
| Parameter | Plot |
|---|---|
| CZT HV Monitor | 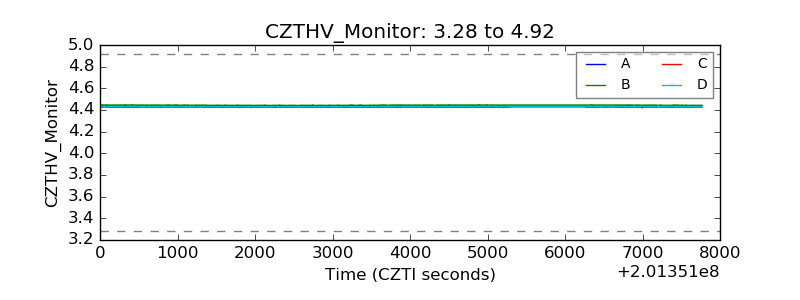 |
| D_VDD | 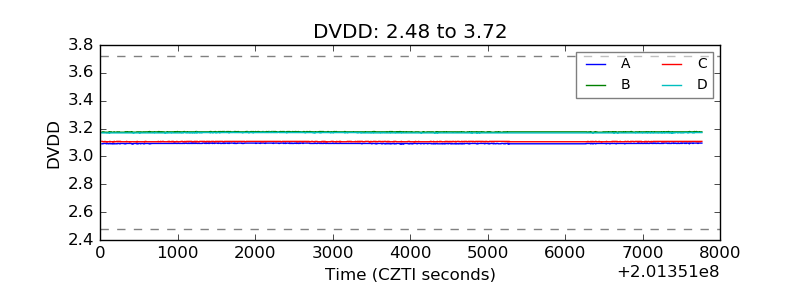 |
| Temperature 1 |  |
| Veto HV Monitor | 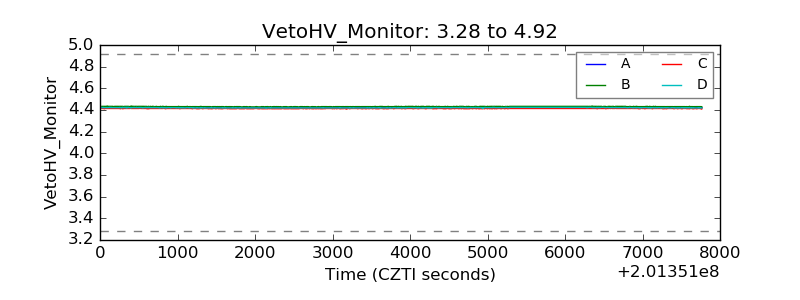 |
| Veto LLD | 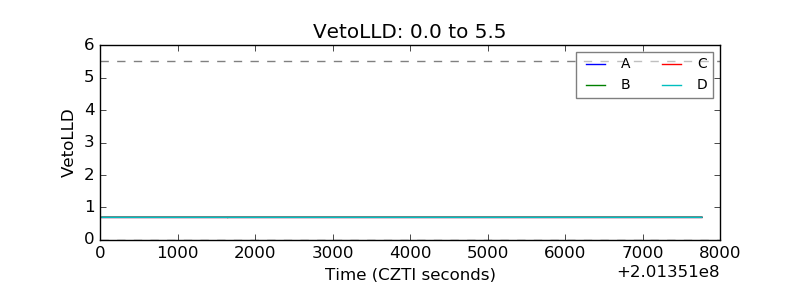 |
| Alpha Counter | 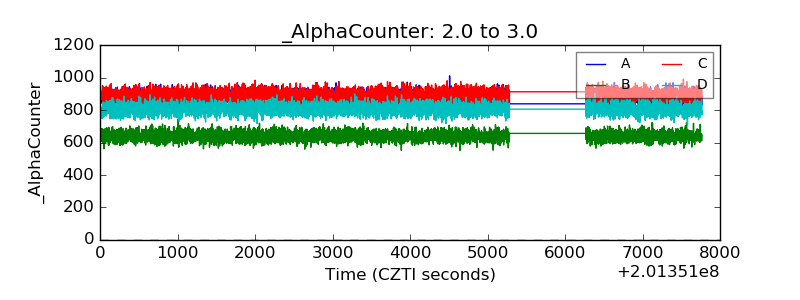 |
| _CPM_Rate | 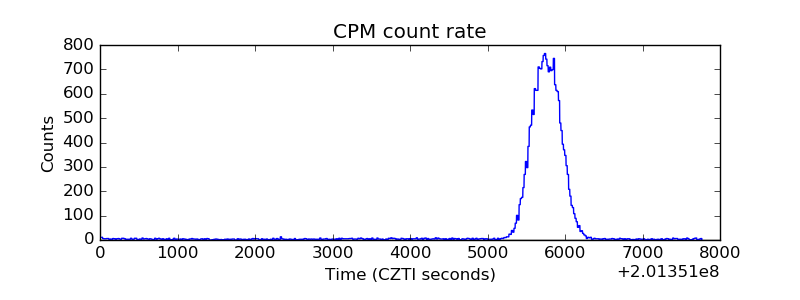 |
| CZT Counter | 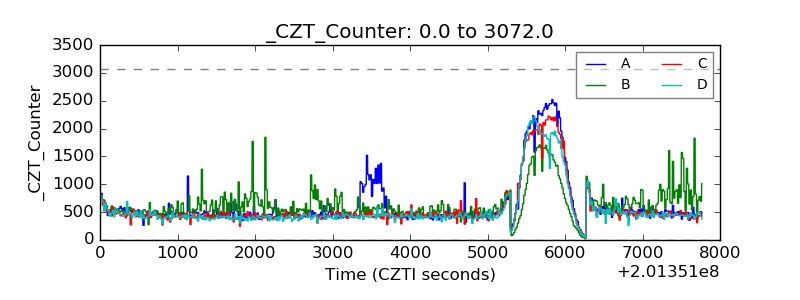 |
| +2.5 Volts monitor |  |
| +5 Volts monitor | 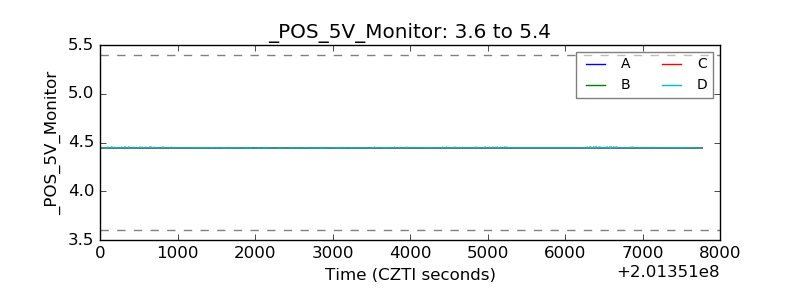 |
| _ROLL_ROT | 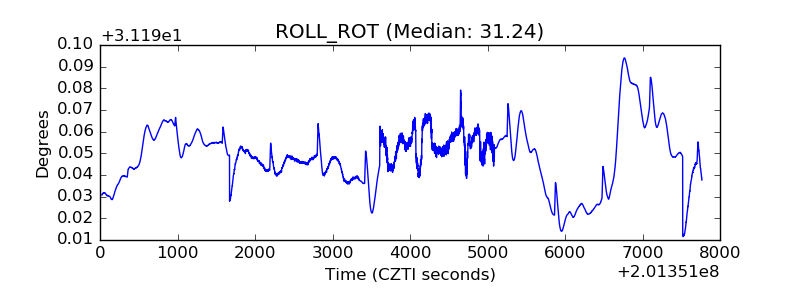 |
| _Roll_DEC | 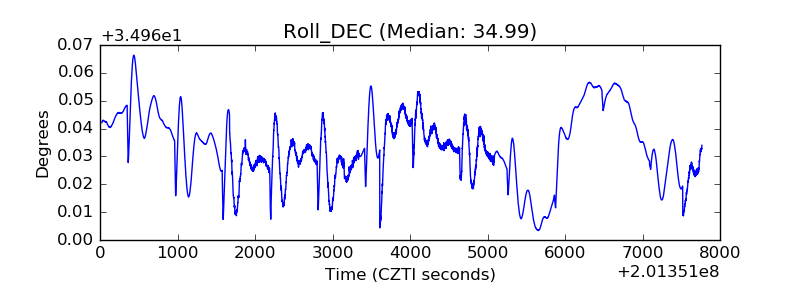 |
| _Roll_RA | 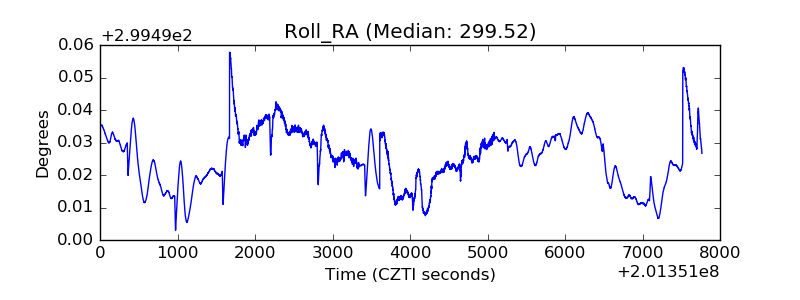 |
| Veto Counter | 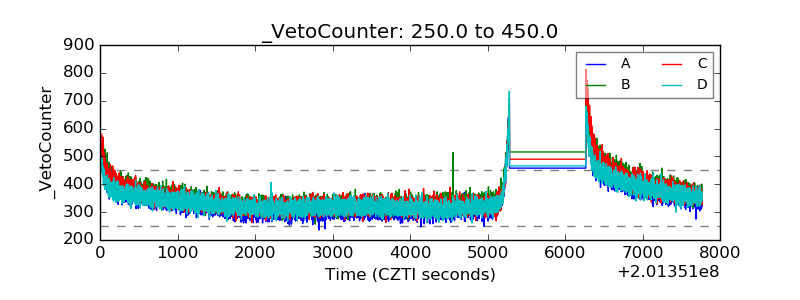 |