| Param | Original file | Final file |
|---|---|---|
| Filename | modeM0/AS1G05_245T01_9000000460_03471cztM0_level2.evt | modeM0/AS1G05_245T01_9000000460_03471cztM0_level2_quad_clean.evt |
| Size (bytes) | 487,200,960 | 63,138,240 |
| Size | 464.6 MB | 60.2 MB |
| Events in quadrant A | 3,557,725 | 367,361 |
| Events in quadrant B | 4,361,341 | 367,161 |
| Events in quadrant C | 3,310,134 | 367,123 |
| Events in quadrant D | 3,083,579 | 355,716 |
| Mode M0 | |||
|---|---|---|---|
| Quadrant | BADHDUFLAG | Total packets | Discarded packets |
| A | 0 | 14714 | 3 |
| B | 0 | 17483 | 2 |
| C | 0 | 14053 | 2 |
| D | 0 | 13638 | 2 |
| Mode SS | |||
|---|---|---|---|
| Quadrant | BADHDUFLAG | Total packets | Discarded packets |
| A | 0 | 134 | 0 |
| B | 0 | 134 | 0 |
| C | 0 | 134 | 0 |
| D | 0 | 134 | 0 |
| Mode M9 | |||
|---|---|---|---|
| Quadrant | BADHDUFLAG | Total packets | Discarded packets |
| A | 0 | 16 | 0 |
| B | 0 | 16 | 0 |
| C | 0 | 16 | 0 |
| D | 0 | 17 | 0 |
| Quadrant | Total seconds | Saturated seconds | Saturation percentage |
|---|---|---|---|
| A | 6505 | 170 | 2.613374% |
| B | 6505 | 144 | 2.213682% |
| C | 6505 | 139 | 2.136818% |
| D | 6505 | 87 | 1.337433% |
Noise dominated data is calculated using 1-second bins in cleaned event files. If a bin has >2000 counts, and if more than 50% of those come from <1% of pixels, then it is considered to be noise-dominated and hence unusable.
| Quadrant | # 1 sec bins | Bins with >0 counts | Bins with >2000 counts | High rate bins dominated by noise | Noise dominated (total time) | Noise dominated (detector-on time) | Marked lightcurve |
|---|---|---|---|---|---|---|---|
| A | 7650 | 6505 | 46 | 46 | 0.60% | 0.71% | 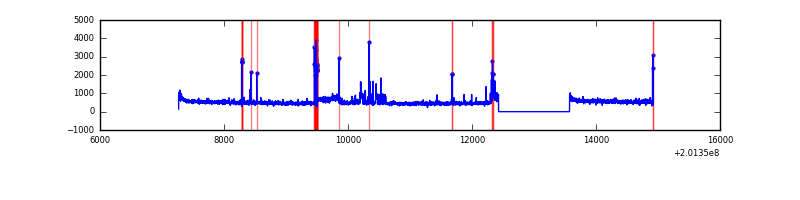 |
| B | 7650 | 6505 | 21 | 21 | 0.27% | 0.32% | 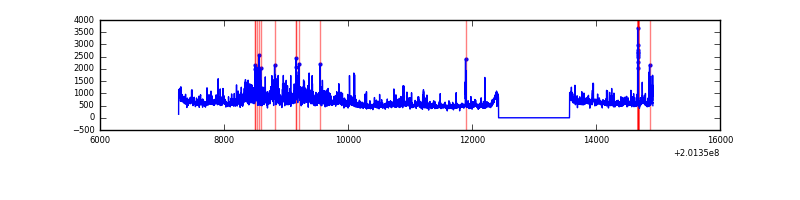 |
| C | 7650 | 6505 | 47 | 47 | 0.61% | 0.72% | 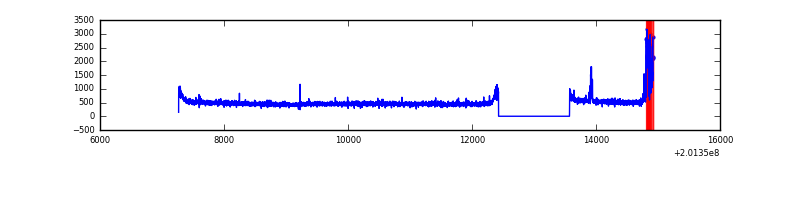 |
| D | 7650 | 6505 | 9 | 9 | 0.12% | 0.14% | 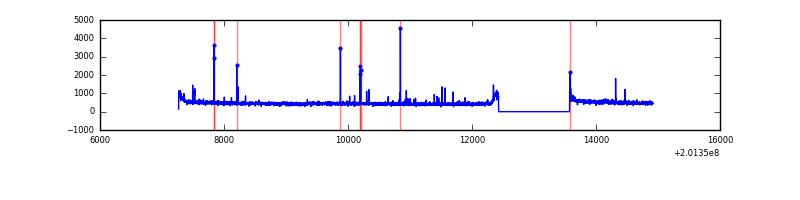 |
Top three noisy pixels from each quadrant. If the there are fewer than three noisy pixels in the level2.evt file, extra rows are filled as -1
| Pixel properties | Quadrant properties | ||||||
|---|---|---|---|---|---|---|---|
| Quadrant | DetID | PixID | Counts | Sigma | Mean | Median | Sigma |
| A | 14 | 111 | 263130 | 1598.01 | 811 | 795 | 164.2 |
| A | 0 | 118 | 101641 | 614.3 | 811 | 795 | 164.2 |
| A | 8 | 15 | 41497 | 247.94 | 811 | 795 | 164.2 |
| B | 15 | 204 | 940837 | 6001.44 | 820 | 805 | 156.6 |
| B | 14 | 167 | 98865 | 626.04 | 820 | 805 | 156.6 |
| B | 2 | 249 | 69252 | 436.99 | 820 | 805 | 156.6 |
| C | 1 | 192 | 218825 | 1191.87 | 786 | 792 | 182.9 |
| C | 15 | 208 | 7601 | 37.22 | 786 | 792 | 182.9 |
| C | 13 | 61 | 6801 | 32.85 | 786 | 792 | 182.9 |
| D | 8 | 195 | 33760 | 176.39 | 785 | 765 | 187.1 |
| D | 13 | 223 | 29166 | 151.83 | 785 | 765 | 187.1 |
| D | 13 | 46 | 18430 | 94.44 | 785 | 765 | 187.1 |
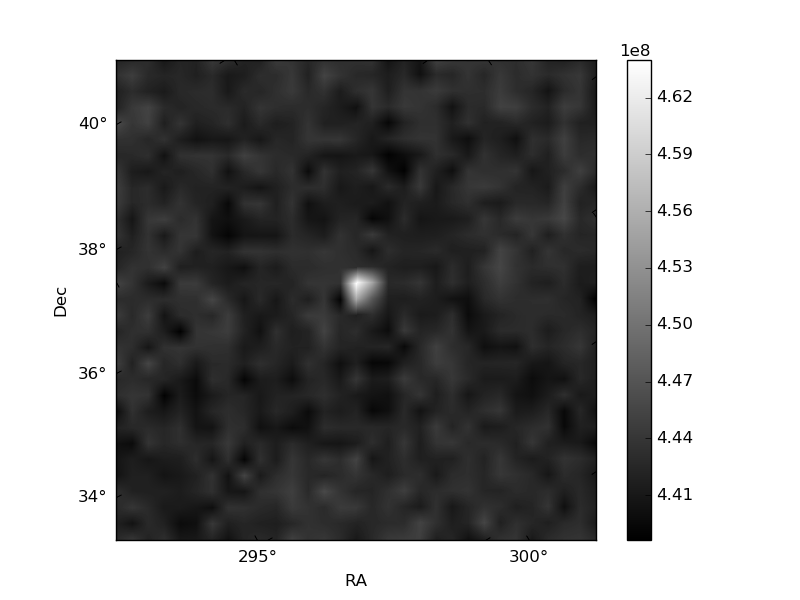
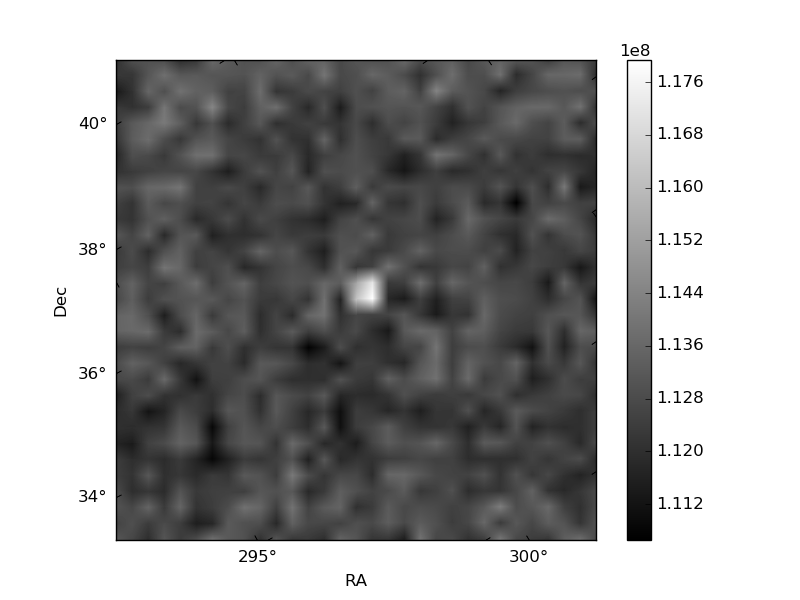
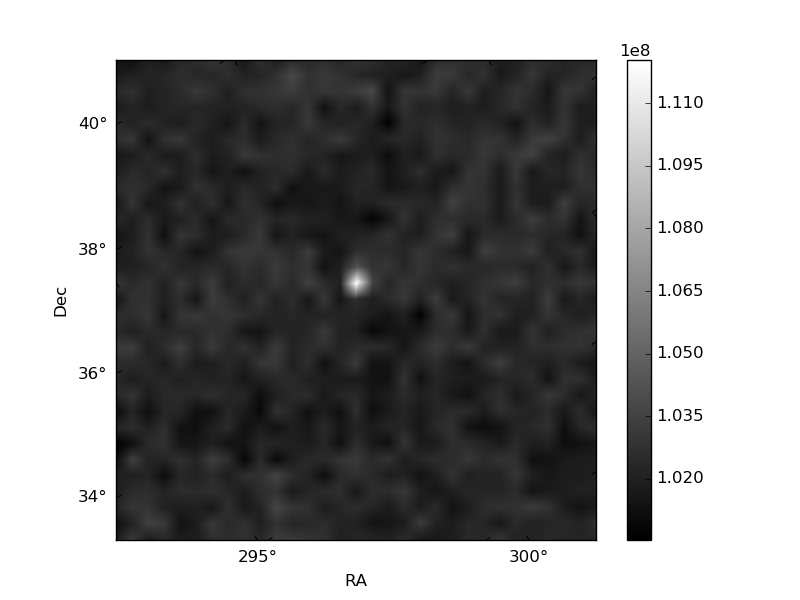
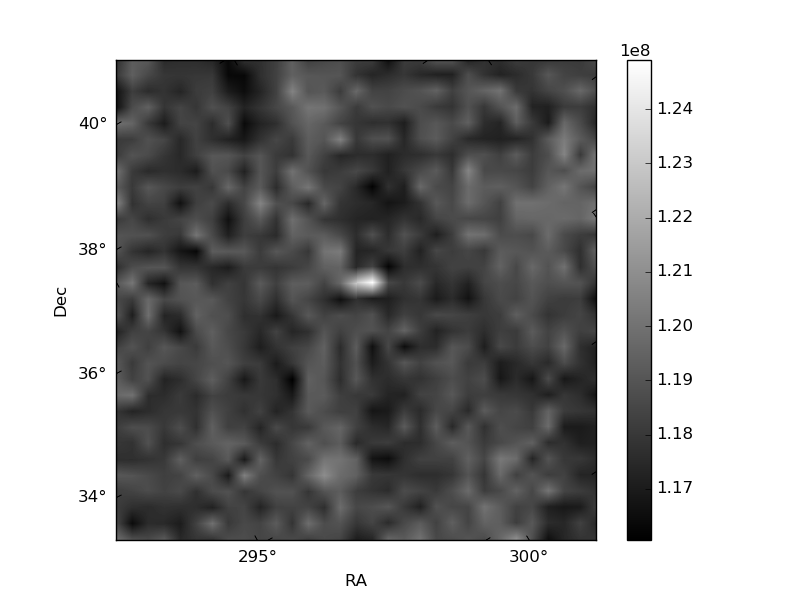
Histogram calculated using DETX and DETY for each event in the final _common_clean file
| Quadrant A | 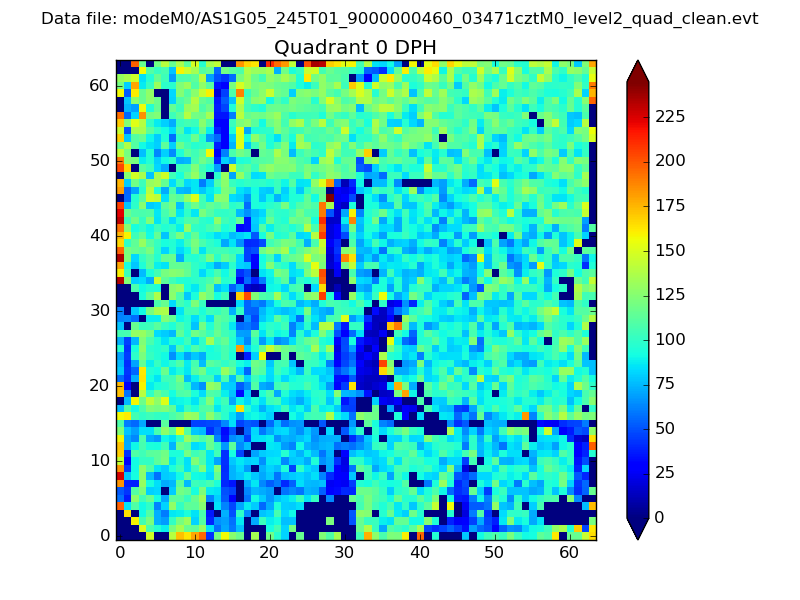 |
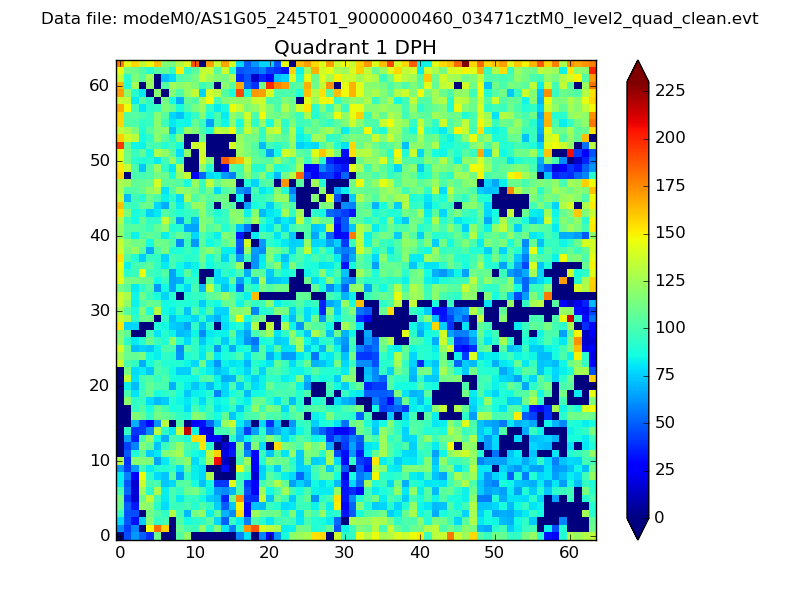 |
Quadrant B |
|---|---|---|---|
| Quadrant D | 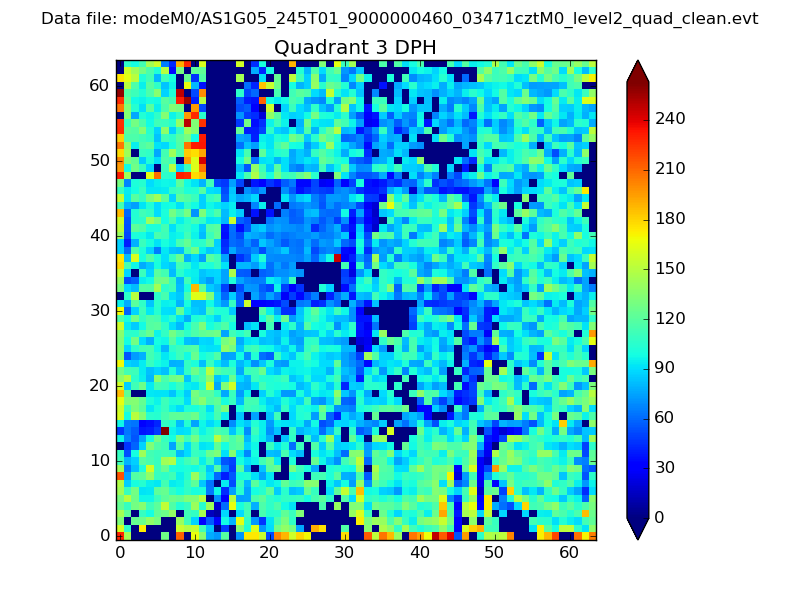 |
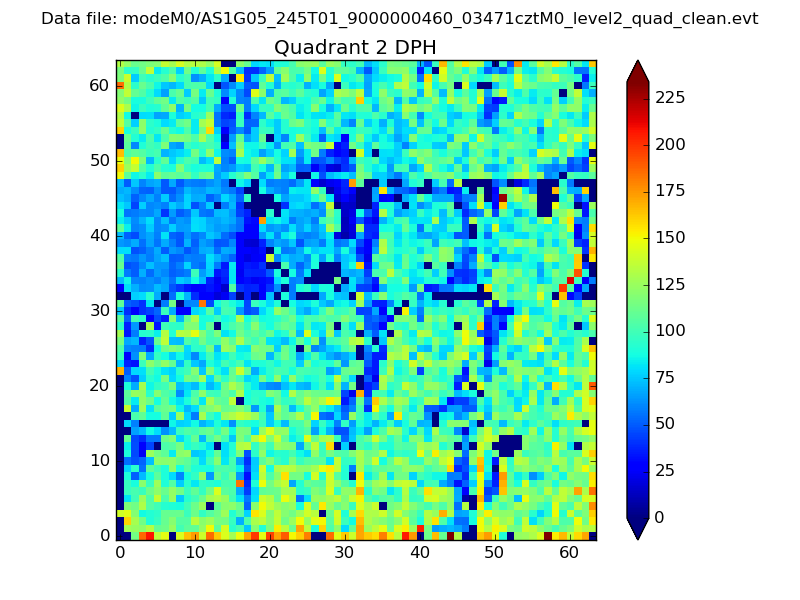 |
Quadrant C |
| Plot type | Count rate plots | Images |
|---|---|---|
| Comparison with Poisson distribution Blue bars denote a histogram of data divided into 1 sec bins. Red curve is a Poisson curve with rate = median count rate of data. |
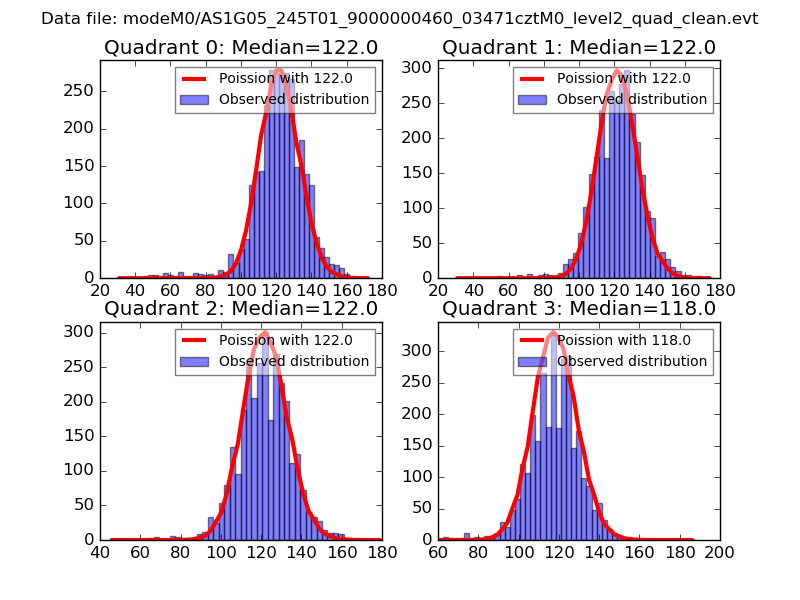 |
 |
| Quadrant-wise count rates Data is divided into 100 sec bins |
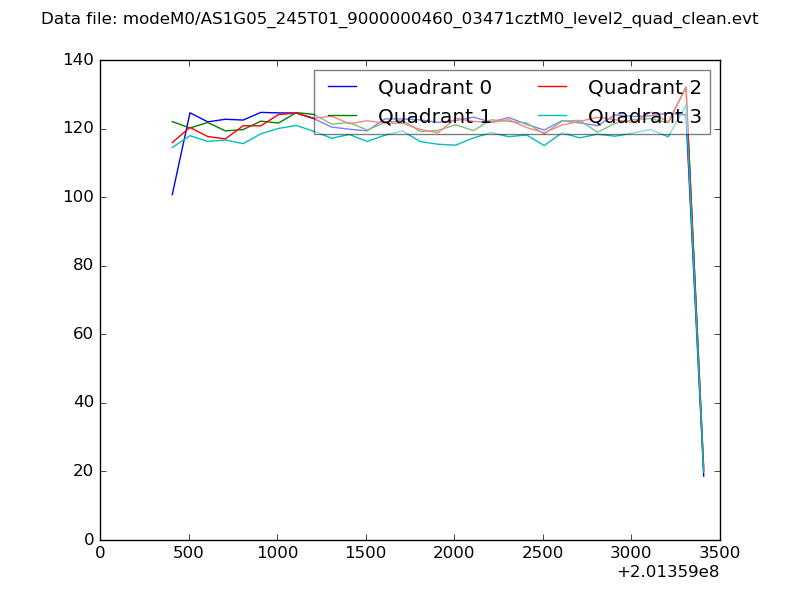 |
|
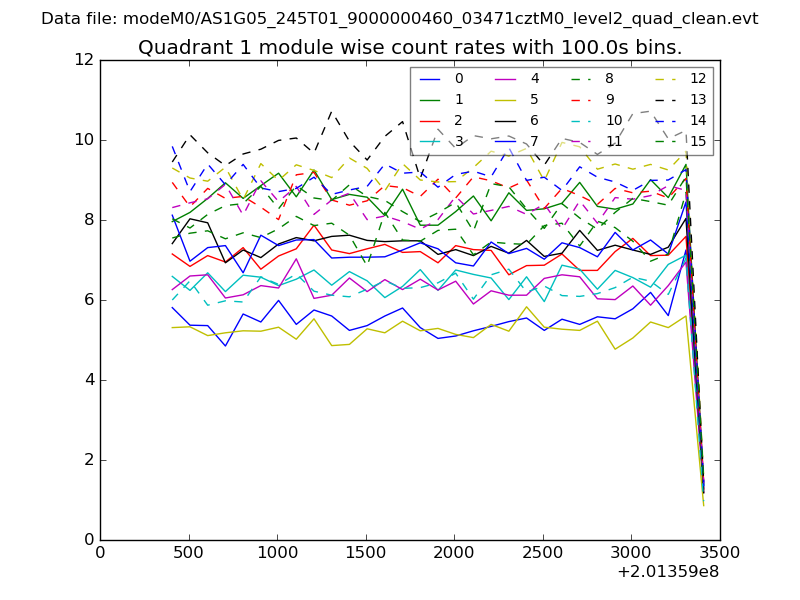
| Module-wise count rates for Quadrant A Data is divided into 100 sec bins |
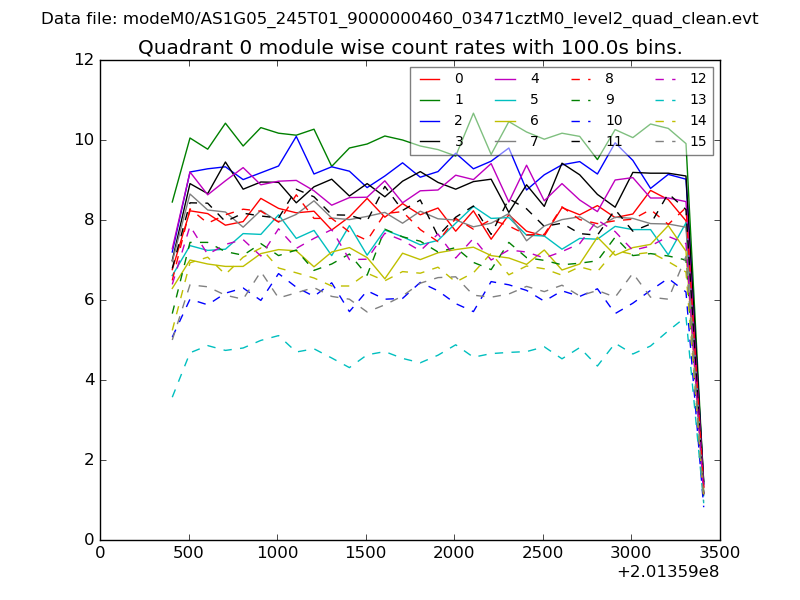 |
 |
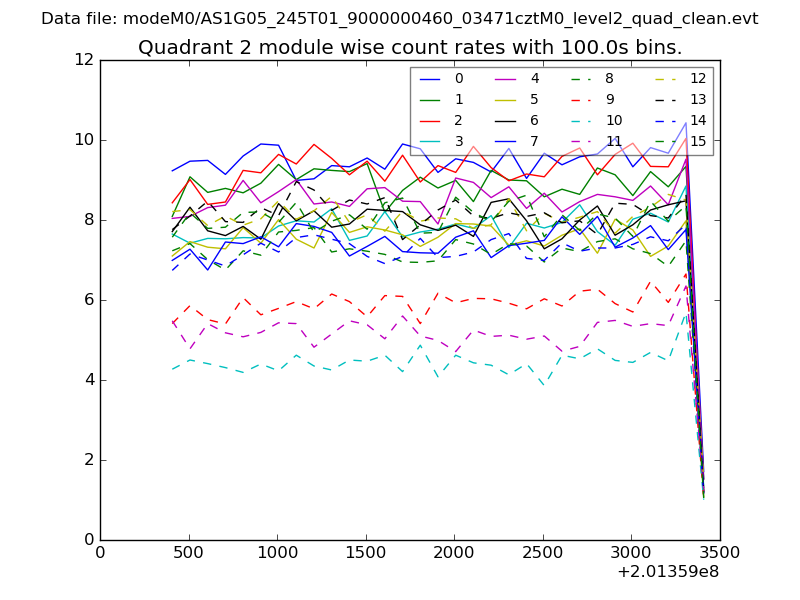
| Module-wise count rates for Quadrant B Data is divided into 100 sec bins |
 |
 |
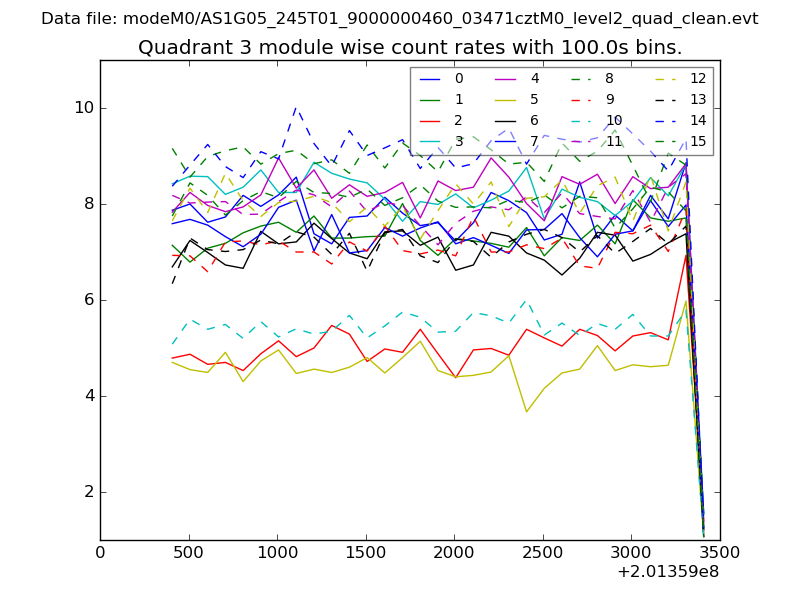
| Module-wise count rates for Quadrant C Data is divided into 100 sec bins |
 |
 |
| Module-wise count rates for Quadrant D Data is divided into 100 sec bins |
 |
 |
| Parameter | Plot |
|---|---|
| CZT HV Monitor | 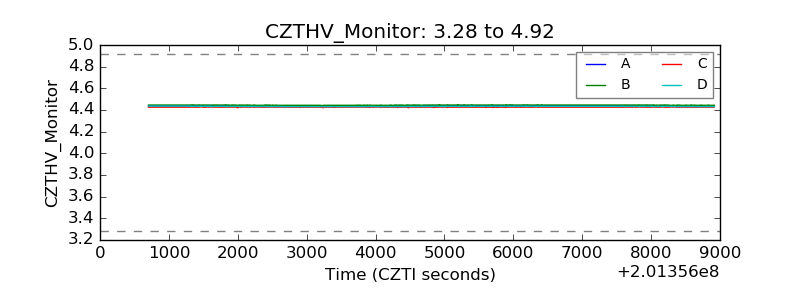 |
| D_VDD | 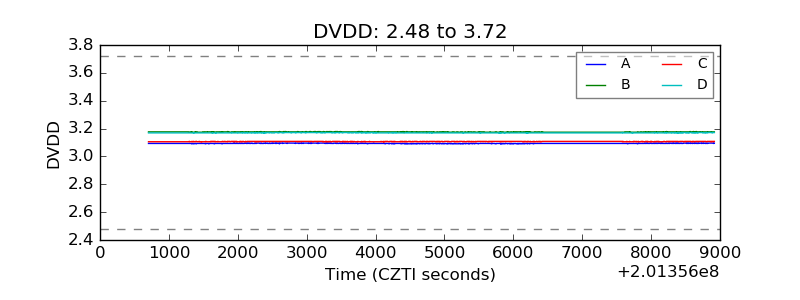 |
| Temperature 1 | 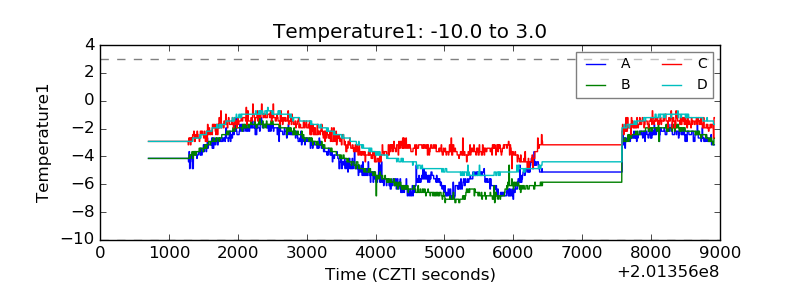 |
| Veto HV Monitor | 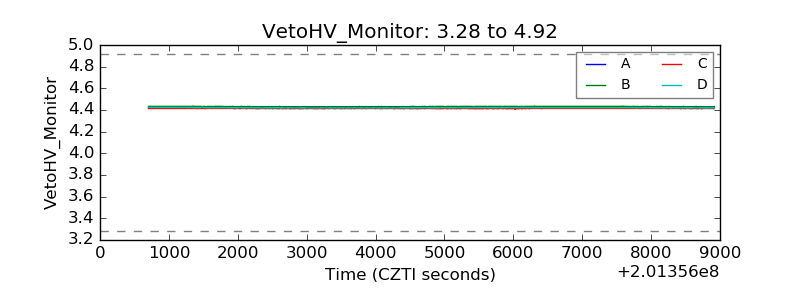 |
| Veto LLD | 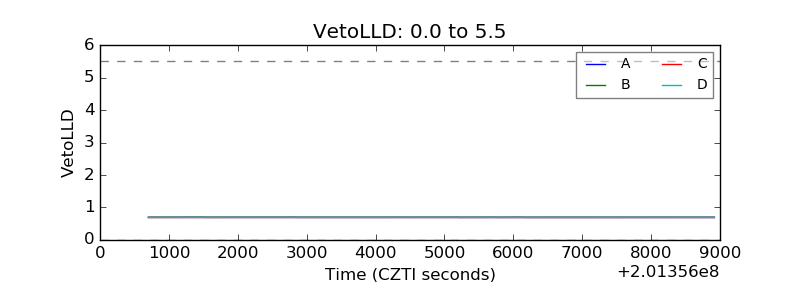 |
| Alpha Counter | 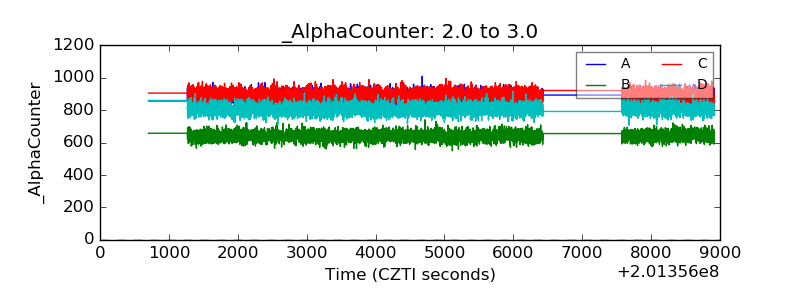 |
| _CPM_Rate | 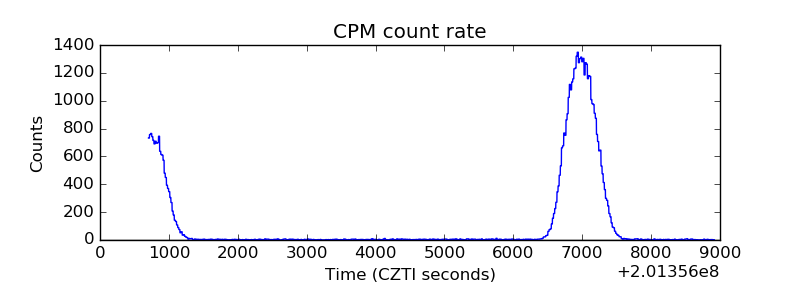 |
| CZT Counter | 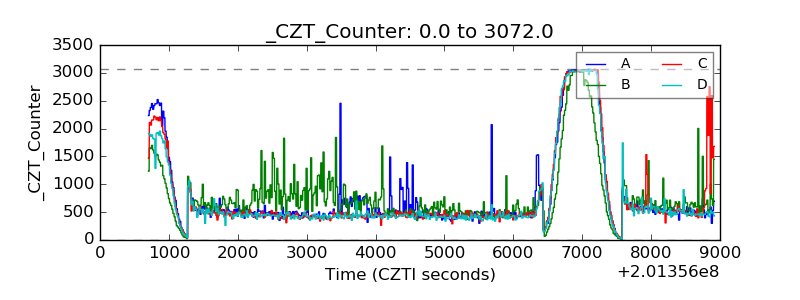 |
| +2.5 Volts monitor |  |
| +5 Volts monitor |  |
| _ROLL_ROT | 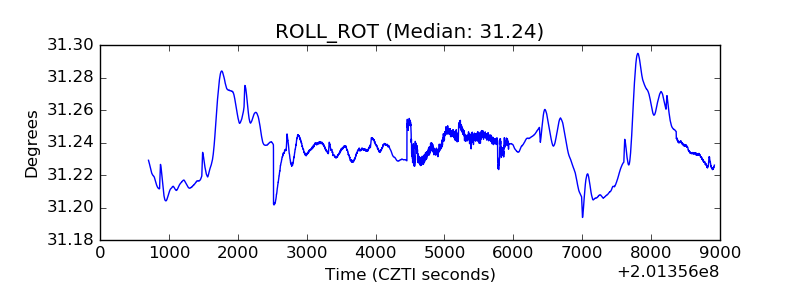 |
| _Roll_DEC | 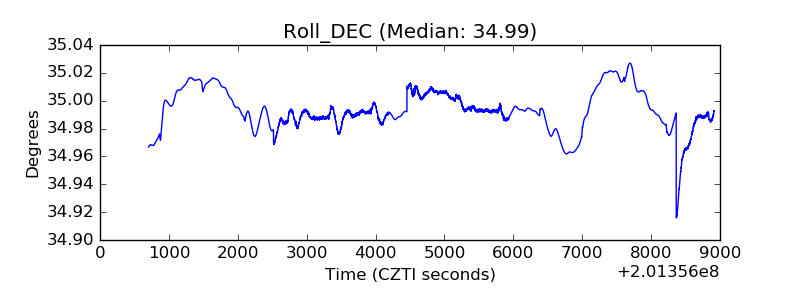 |
| _Roll_RA | 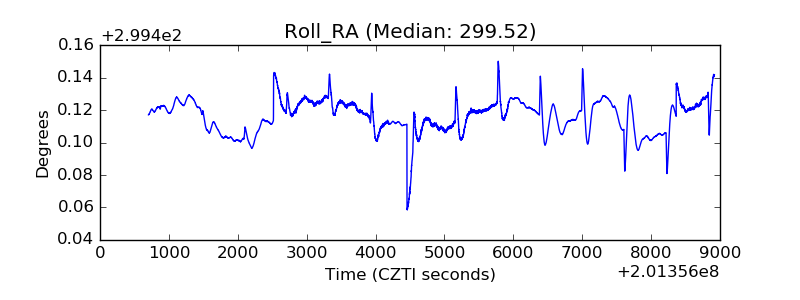 |
| Veto Counter | 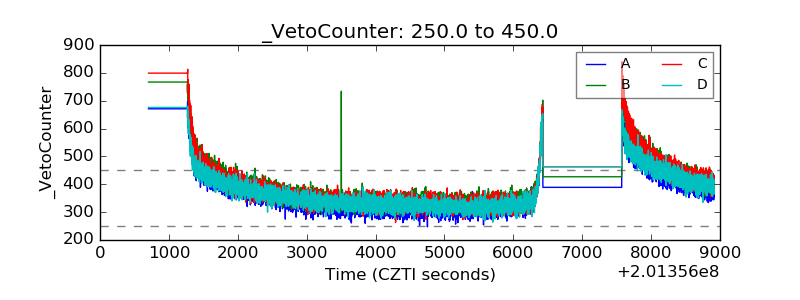 |