| Param | Original file | Final file |
|---|---|---|
| Filename | modeM0/AS1G05_245T01_9000000460_03472cztM0_level2.evt | modeM0/AS1G05_245T01_9000000460_03472cztM0_level2_quad_clean.evt |
| Size (bytes) | 242,956,800 | 31,224,960 |
| Size | 231.7 MB | 29.8 MB |
| Events in quadrant A | 1,629,198 | 183,348 |
| Events in quadrant B | 1,896,425 | 182,581 |
| Events in quadrant C | 2,116,351 | 181,075 |
| Events in quadrant D | 1,501,898 | 175,493 |
| Mode M0 | |||
|---|---|---|---|
| Quadrant | BADHDUFLAG | Total packets | Discarded packets |
| A | 0 | 6706 | 1 |
| B | 0 | 7712 | 1 |
| C | 0 | 8242 | 1 |
| D | 0 | 6512 | 1 |
| Mode SS | |||
|---|---|---|---|
| Quadrant | BADHDUFLAG | Total packets | Discarded packets |
| A | 0 | 62 | 0 |
| B | 0 | 62 | 0 |
| C | 0 | 62 | 0 |
| D | 0 | 62 | 0 |
| Mode M9 | |||
|---|---|---|---|
| Quadrant | BADHDUFLAG | Total packets | Discarded packets |
| A | 0 | 6 | 0 |
| B | 0 | 6 | 0 |
| C | 0 | 6 | 0 |
| D | 0 | 7 | 0 |
| Quadrant | Total seconds | Saturated seconds | Saturation percentage |
|---|---|---|---|
| A | 3128 | 20 | 0.639386% |
| B | 3128 | 29 | 0.927110% |
| C | 3128 | 200 | 6.393862% |
| D | 3128 | 10 | 0.319693% |
Noise dominated data is calculated using 1-second bins in cleaned event files. If a bin has >2000 counts, and if more than 50% of those come from <1% of pixels, then it is considered to be noise-dominated and hence unusable.
| Quadrant | # 1 sec bins | Bins with >0 counts | Bins with >2000 counts | High rate bins dominated by noise | Noise dominated (total time) | Noise dominated (detector-on time) | Marked lightcurve |
|---|---|---|---|---|---|---|---|
| A | 3128 | 3128 | 6 | 6 | 0.19% | 0.19% | 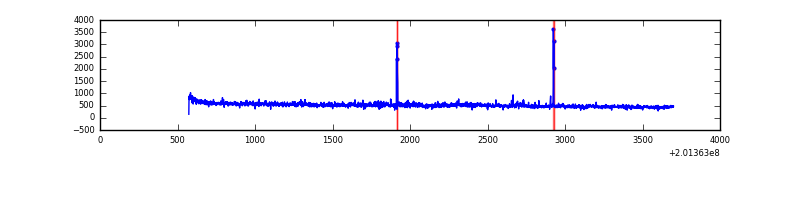 |
| B | 3128 | 3128 | 13 | 13 | 0.42% | 0.42% | 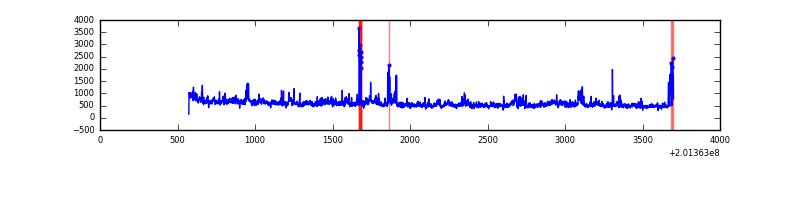 |
| C | 3128 | 3128 | 177 | 177 | 5.66% | 5.66% | 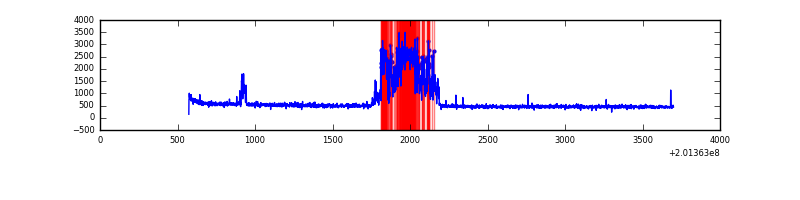 |
| D | 3128 | 3128 | 2 | 2 | 0.06% | 0.06% | 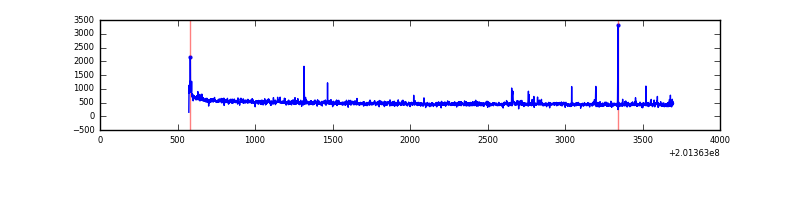 |
Top three noisy pixels from each quadrant. If the there are fewer than three noisy pixels in the level2.evt file, extra rows are filled as -1
| Pixel properties | Quadrant properties | ||||||
|---|---|---|---|---|---|---|---|
| Quadrant | DetID | PixID | Counts | Sigma | Mean | Median | Sigma |
| A | 14 | 111 | 41649 | 513.71 | 395 | 387 | 80.3 |
| A | 8 | 15 | 29640 | 364.2 | 395 | 387 | 80.3 |
| A | 0 | 118 | 20528 | 250.75 | 395 | 387 | 80.3 |
| B | 15 | 204 | 217249 | 2829.25 | 399 | 390 | 76.6 |
| B | 15 | 85 | 46120 | 596.62 | 399 | 390 | 76.6 |
| B | 2 | 249 | 45463 | 588.04 | 399 | 390 | 76.6 |
| C | 1 | 192 | 635966 | 7252.79 | 376 | 379 | 87.6 |
| C | 1 | 16 | 3985 | 41.15 | 376 | 379 | 87.6 |
| C | 12 | 4 | 3380 | 34.24 | 376 | 379 | 87.6 |
| D | 13 | 223 | 17951 | 187.53 | 384 | 375 | 93.7 |
| D | 13 | 46 | 12489 | 129.25 | 384 | 375 | 93.7 |
| D | 8 | 195 | 9786 | 100.41 | 384 | 375 | 93.7 |
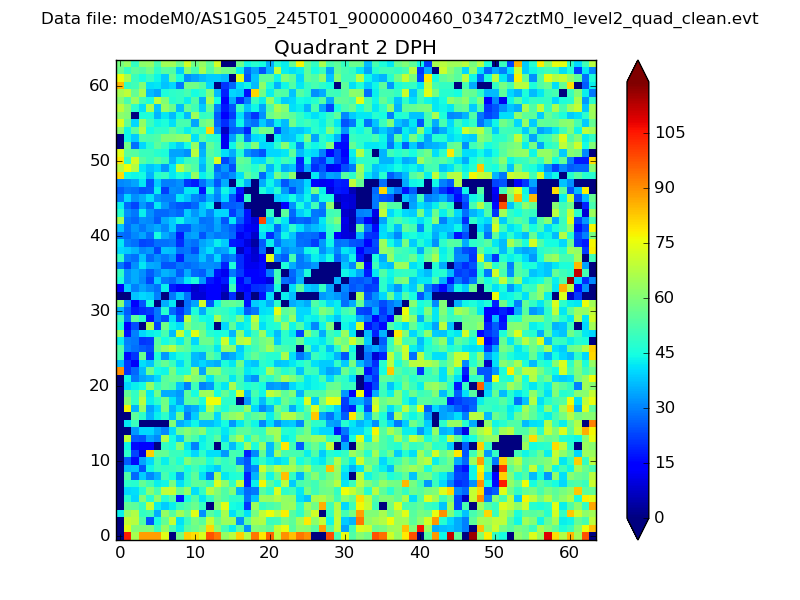
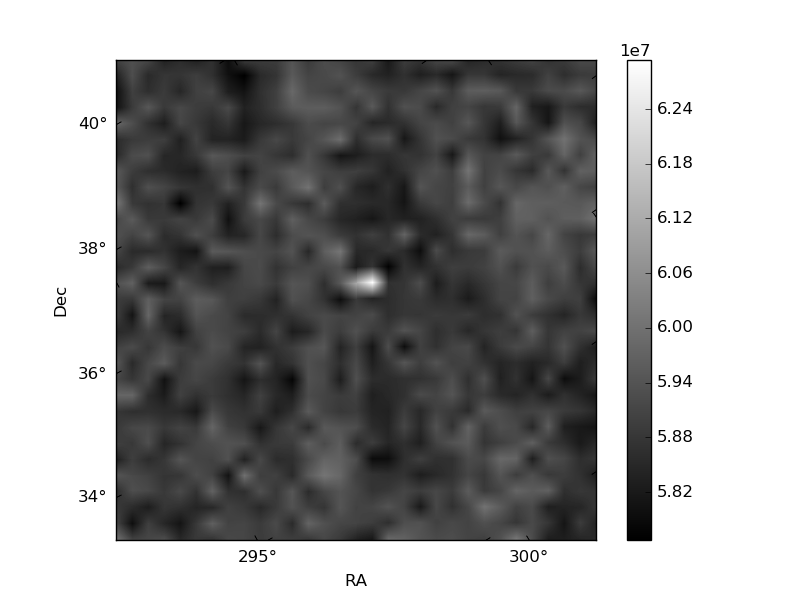
Histogram calculated using DETX and DETY for each event in the final _common_clean file
| Quadrant A |  |
 |
Quadrant B |
|---|---|---|---|
| Quadrant D | 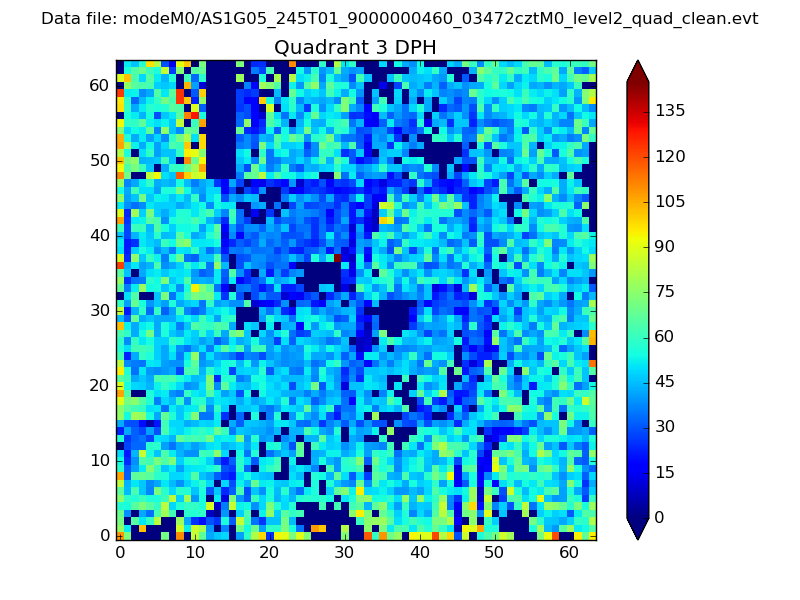 |
 |
Quadrant C |
| Plot type | Count rate plots | Images |
|---|---|---|
| Comparison with Poisson distribution Blue bars denote a histogram of data divided into 1 sec bins. Red curve is a Poisson curve with rate = median count rate of data. |
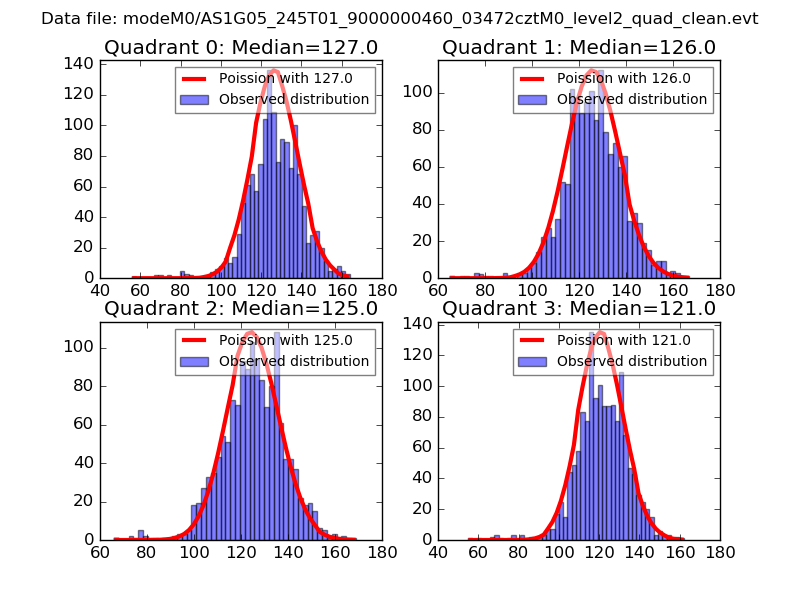 |
 |
| Quadrant-wise count rates Data is divided into 100 sec bins |
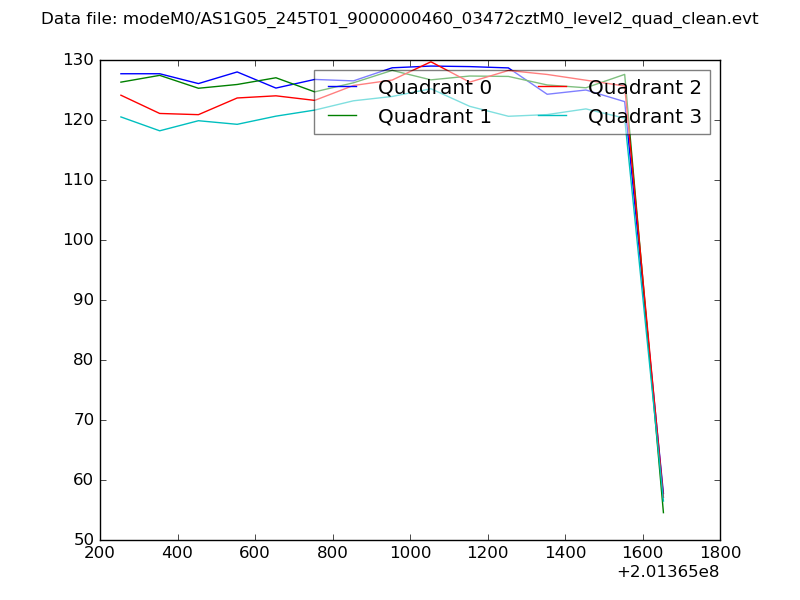 |
|
| Module-wise count rates for Quadrant A Data is divided into 100 sec bins |
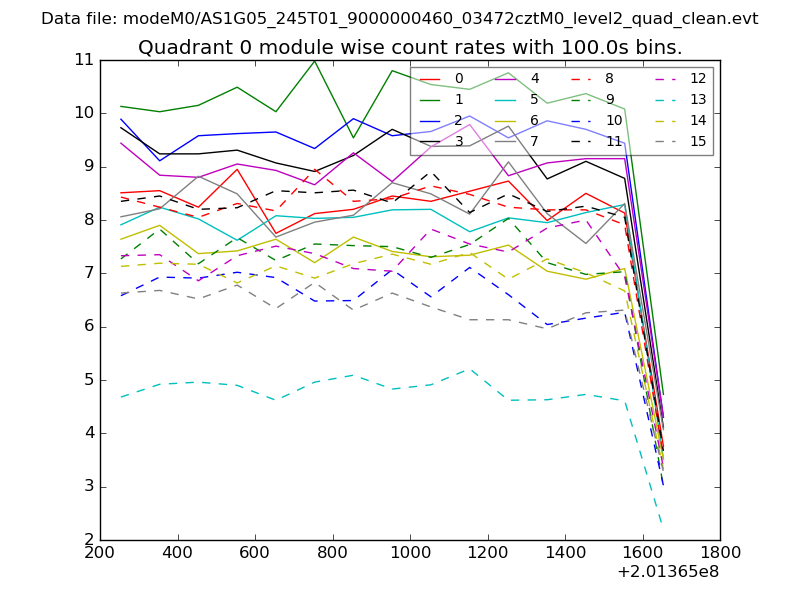 |
 |
| Module-wise count rates for Quadrant B Data is divided into 100 sec bins |
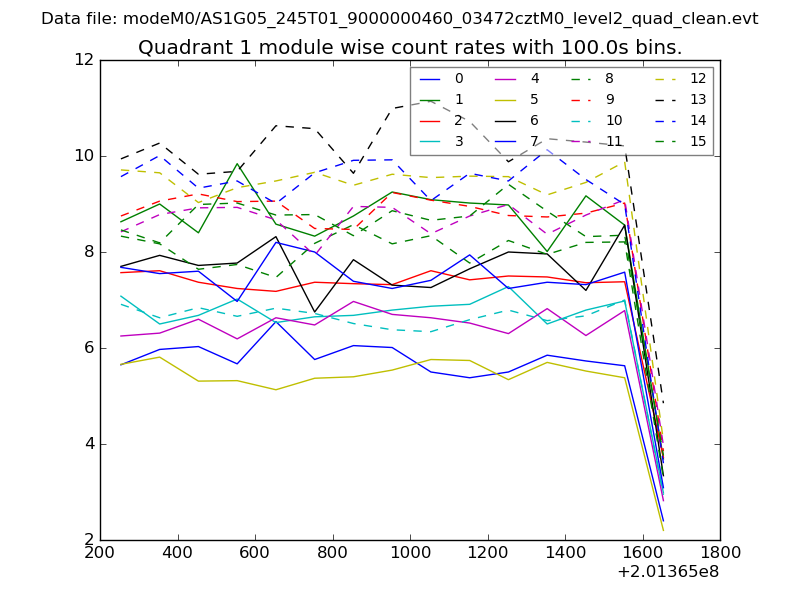 |
 |
| Module-wise count rates for Quadrant C Data is divided into 100 sec bins |
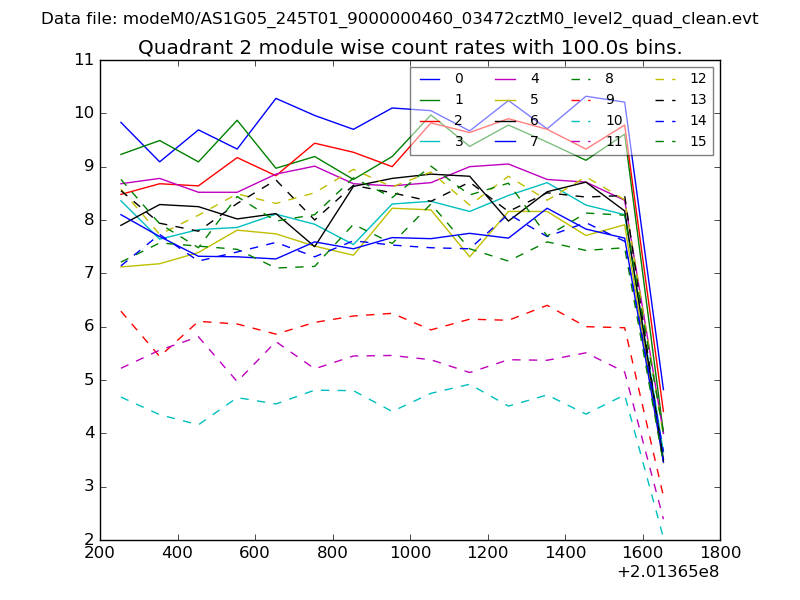 |
 |
| Module-wise count rates for Quadrant D Data is divided into 100 sec bins |
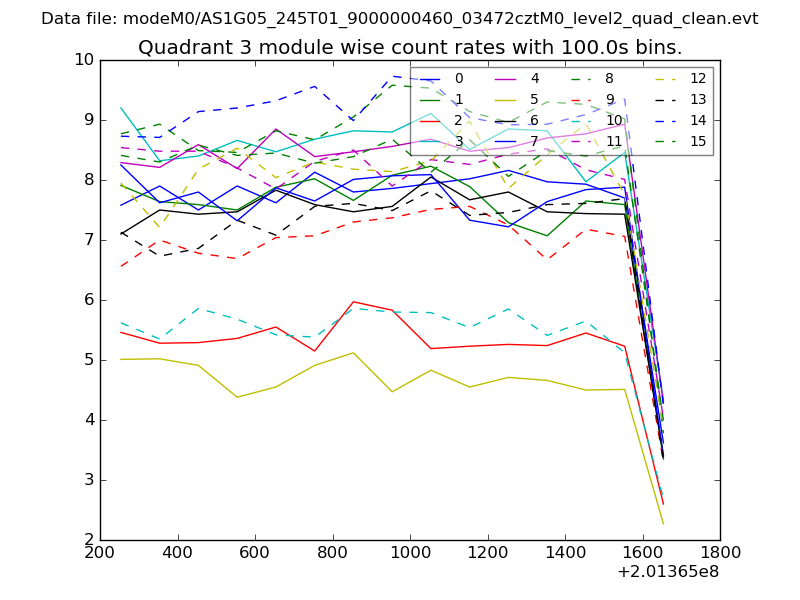 |
 |
| Parameter | Plot |
|---|---|
| CZT HV Monitor | 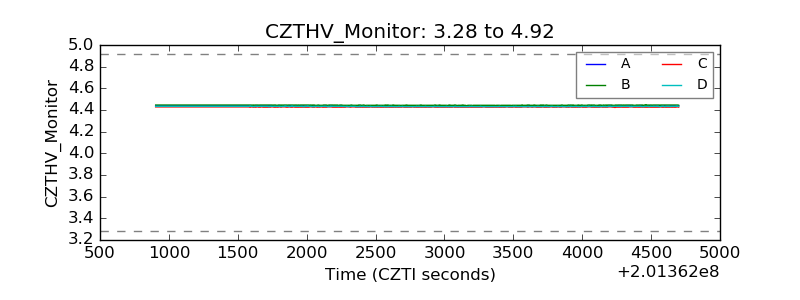 |
| D_VDD | 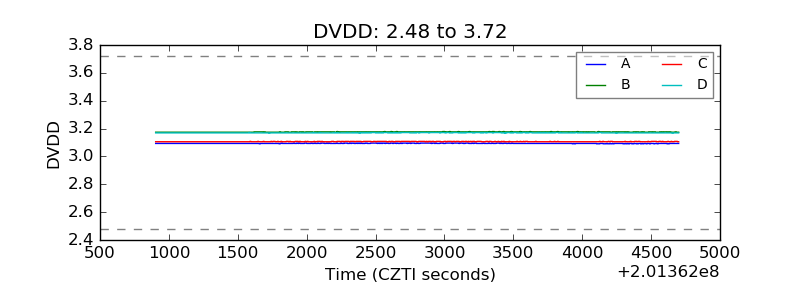 |
| Temperature 1 | 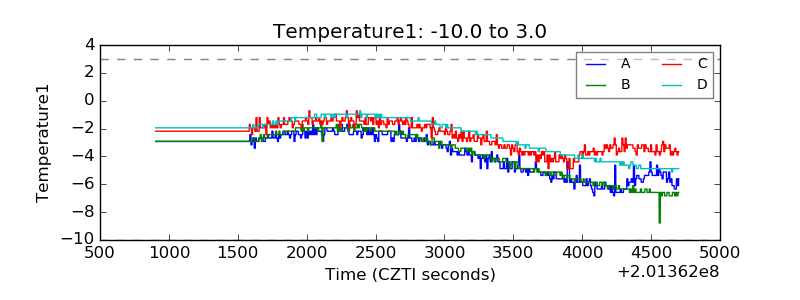 |
| Veto HV Monitor | 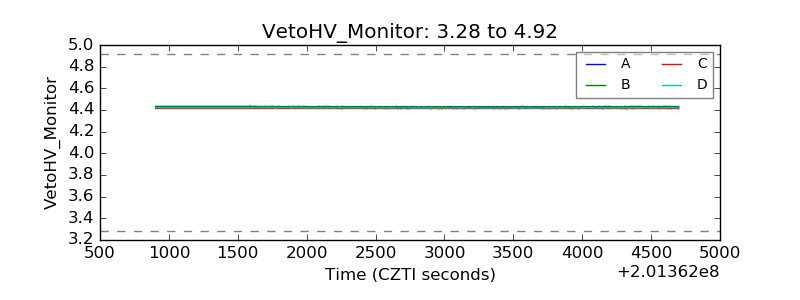 |
| Veto LLD | 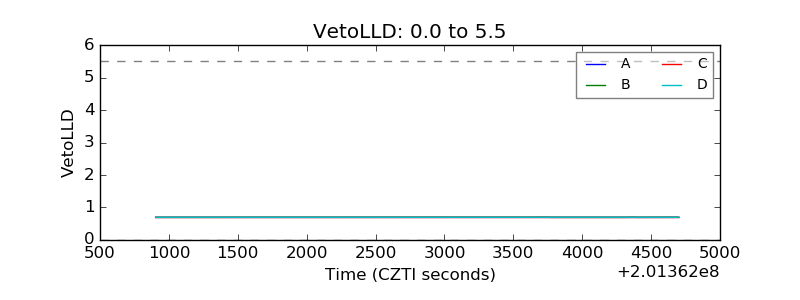 |
| Alpha Counter |  |
| _CPM_Rate | 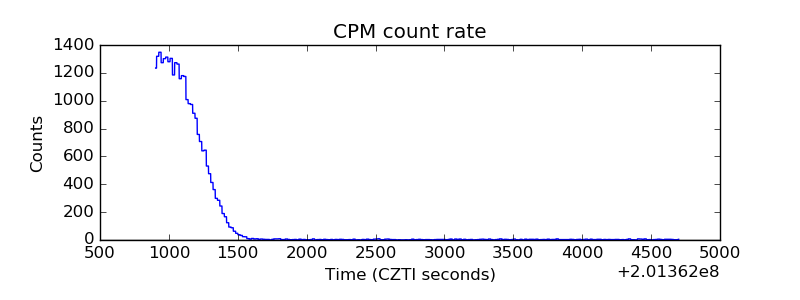 |
| CZT Counter | 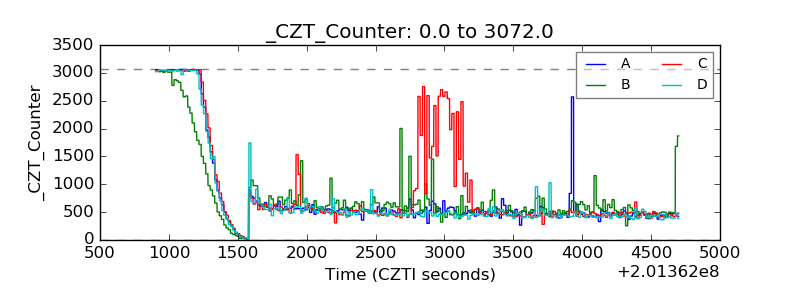 |
| +2.5 Volts monitor |  |
| +5 Volts monitor |  |
| _ROLL_ROT | 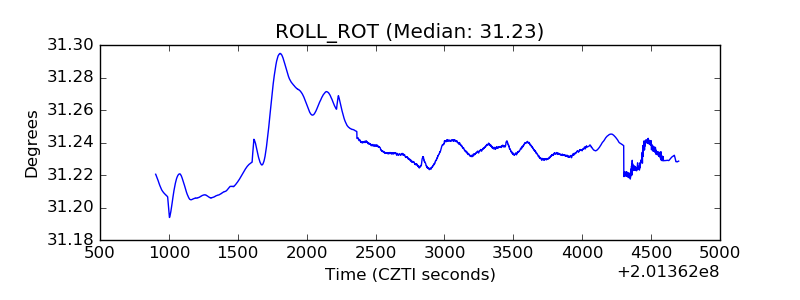 |
| _Roll_DEC | 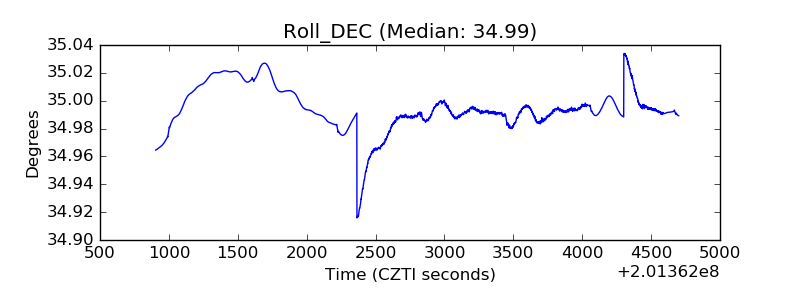 |
| _Roll_RA |  |
| Veto Counter | 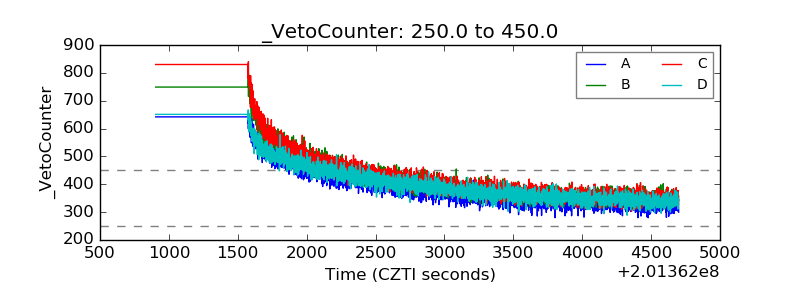 |