| Param | Original file | Final file |
|---|---|---|
| Filename | modeM0/AS1G05_245T01_9000000460_03473cztM0_level2.evt | modeM0/AS1G05_245T01_9000000460_03473cztM0_level2_quad_clean.evt |
| Size (bytes) | 474,966,720 | 94,366,080 |
| Size | 453.0 MB | 90.0 MB |
| Events in quadrant A | 3,365,738 | 593,181 |
| Events in quadrant B | 3,799,194 | 599,881 |
| Events in quadrant C | 3,472,970 | 610,156 |
| Events in quadrant D | 3,285,809 | 582,161 |
| Mode M0 | |||
|---|---|---|---|
| Quadrant | BADHDUFLAG | Total packets | Discarded packets |
| A | 0 | 14552 | 3 |
| B | 0 | 15716 | 2 |
| C | 0 | 14810 | 2 |
| D | 0 | 14545 | 2 |
| Mode SS | |||
|---|---|---|---|
| Quadrant | BADHDUFLAG | Total packets | Discarded packets |
| A | 0 | 140 | 0 |
| B | 0 | 140 | 0 |
| C | 0 | 140 | 0 |
| D | 0 | 140 | 0 |
| Mode M9 | |||
|---|---|---|---|
| Quadrant | BADHDUFLAG | Total packets | Discarded packets |
| A | 0 | 25 | 0 |
| B | 0 | 25 | 0 |
| C | 0 | 25 | 0 |
| D | 0 | 25 | 0 |
| Quadrant | Total seconds | Saturated seconds | Saturation percentage |
|---|---|---|---|
| A | 6778 | 145 | 2.139274% |
| B | 6778 | 173 | 2.552375% |
| C | 6778 | 202 | 2.980230% |
| D | 6778 | 138 | 2.035999% |
Noise dominated data is calculated using 1-second bins in cleaned event files. If a bin has >2000 counts, and if more than 50% of those come from <1% of pixels, then it is considered to be noise-dominated and hence unusable.
| Quadrant | # 1 sec bins | Bins with >0 counts | Bins with >2000 counts | High rate bins dominated by noise | Noise dominated (total time) | Noise dominated (detector-on time) | Marked lightcurve |
|---|---|---|---|---|---|---|---|
| A | 9268 | 6779 | 0 | 0 | 0.00% | 0.00% | 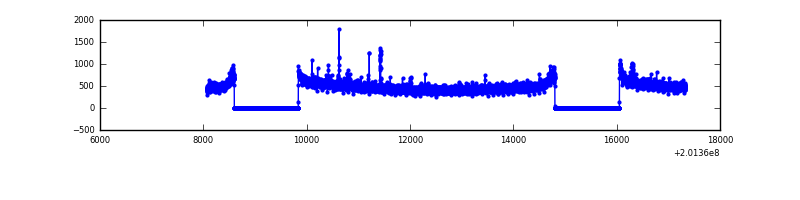 |
| B | 9268 | 6779 | 12 | 12 | 0.13% | 0.18% | 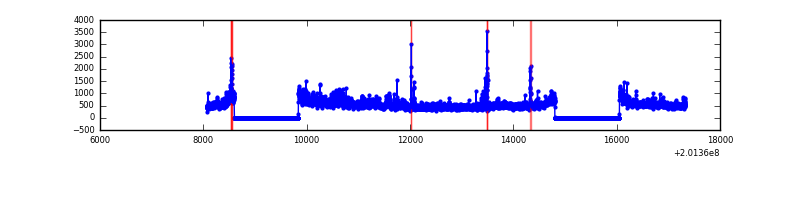 |
| C | 9268 | 6778 | 49 | 49 | 0.53% | 0.72% | 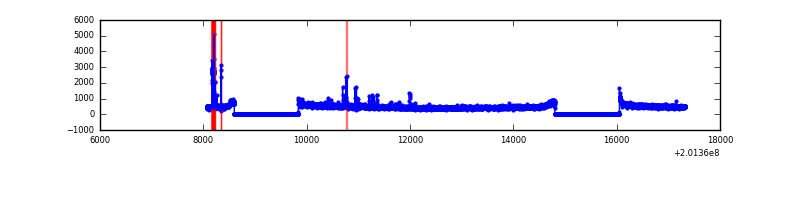 |
| D | 9268 | 6779 | 14 | 14 | 0.15% | 0.21% | 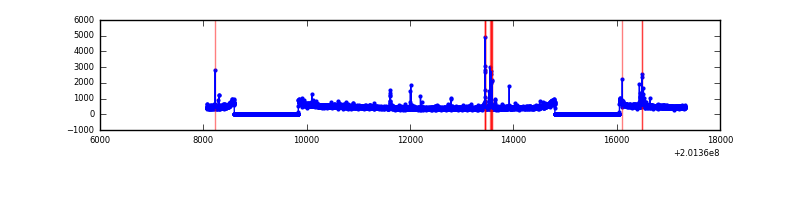 |
Top three noisy pixels from each quadrant. If the there are fewer than three noisy pixels in the level2.evt file, extra rows are filled as -1
| Pixel properties | Quadrant properties | ||||||
|---|---|---|---|---|---|---|---|
| Quadrant | DetID | PixID | Counts | Sigma | Mean | Median | Sigma |
| A | 8 | 15 | 54652 | 312.39 | 843 | 825 | 172.3 |
| A | 0 | 50 | 26943 | 151.58 | 843 | 825 | 172.3 |
| A | 14 | 238 | 16433 | 90.58 | 843 | 825 | 172.3 |
| B | 15 | 204 | 362794 | 2214.62 | 854 | 832 | 163.4 |
| B | 2 | 249 | 75951 | 459.61 | 854 | 832 | 163.4 |
| B | 4 | 200 | 21049 | 123.7 | 854 | 832 | 163.4 |
| C | 1 | 192 | 182193 | 938.02 | 835 | 841 | 193.3 |
| C | 1 | 16 | 13214 | 64.0 | 835 | 841 | 193.3 |
| C | 9 | 144 | 7379 | 33.82 | 835 | 841 | 193.3 |
| D | 13 | 46 | 63123 | 315.6 | 831 | 809 | 197.4 |
| D | 10 | 172 | 27660 | 135.99 | 831 | 809 | 197.4 |
| D | 7 | 223 | 23366 | 114.24 | 831 | 809 | 197.4 |
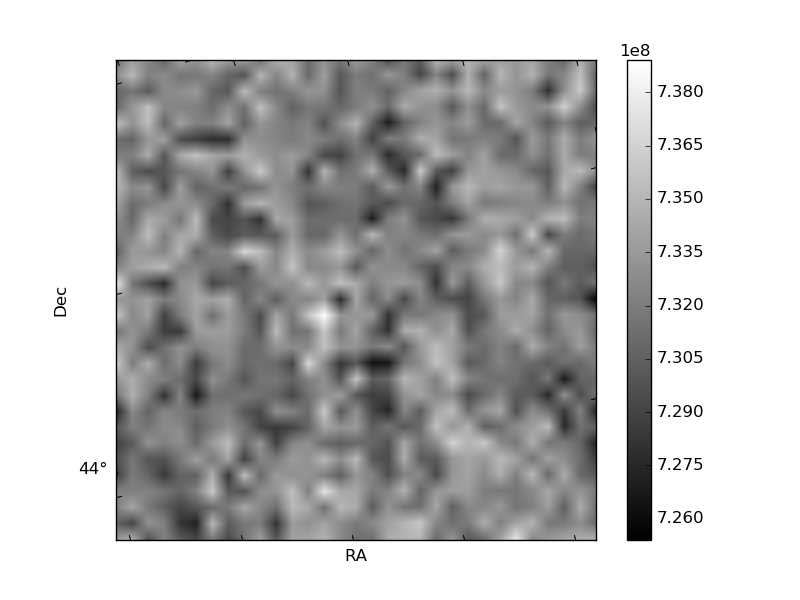
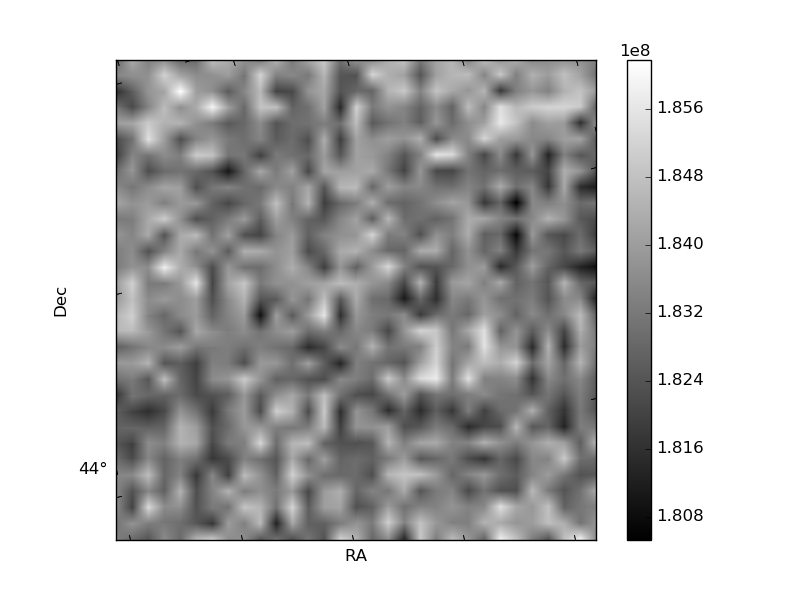
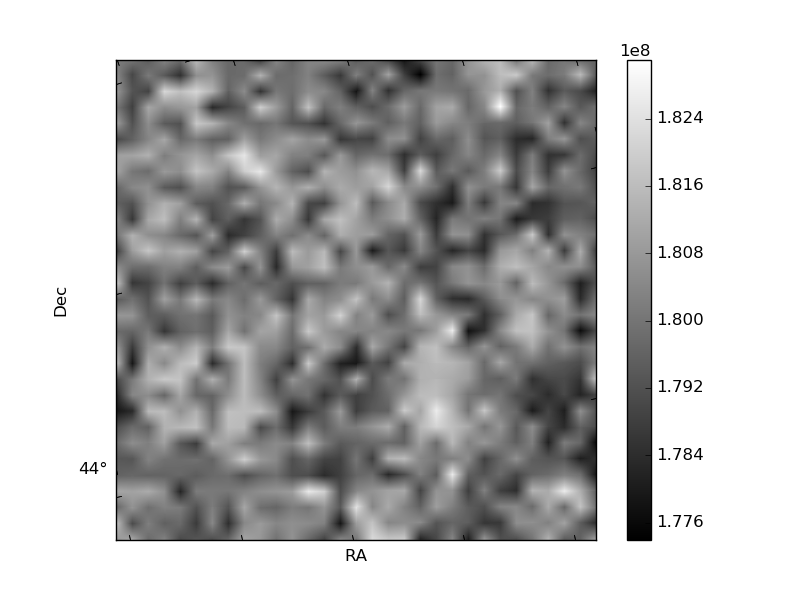
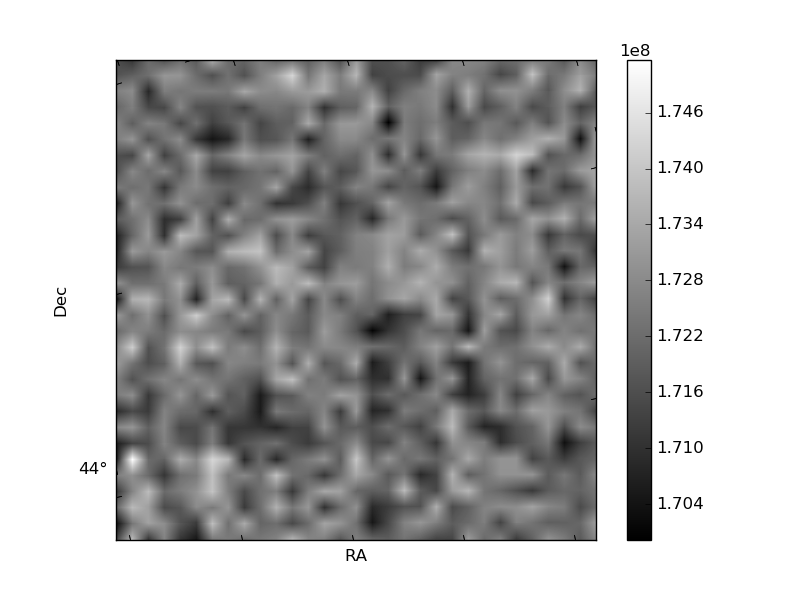
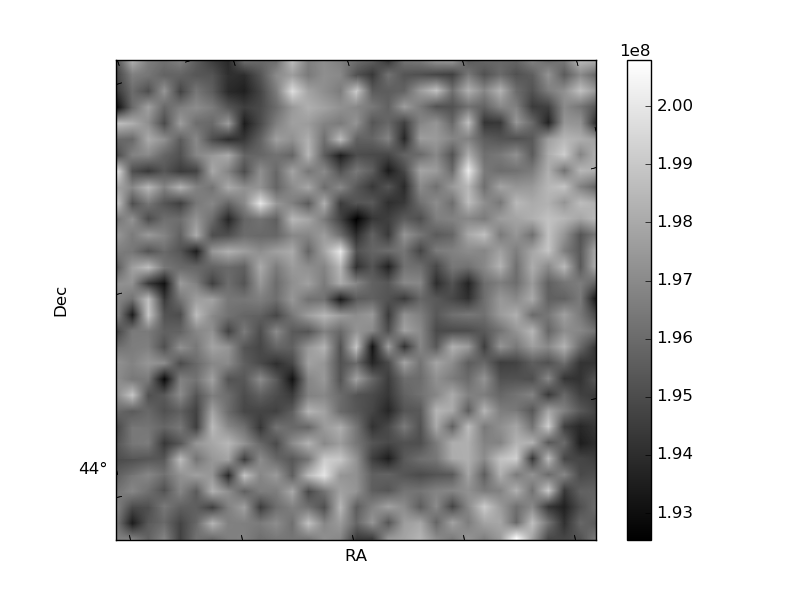
Histogram calculated using DETX and DETY for each event in the final _common_clean file
| Quadrant A | 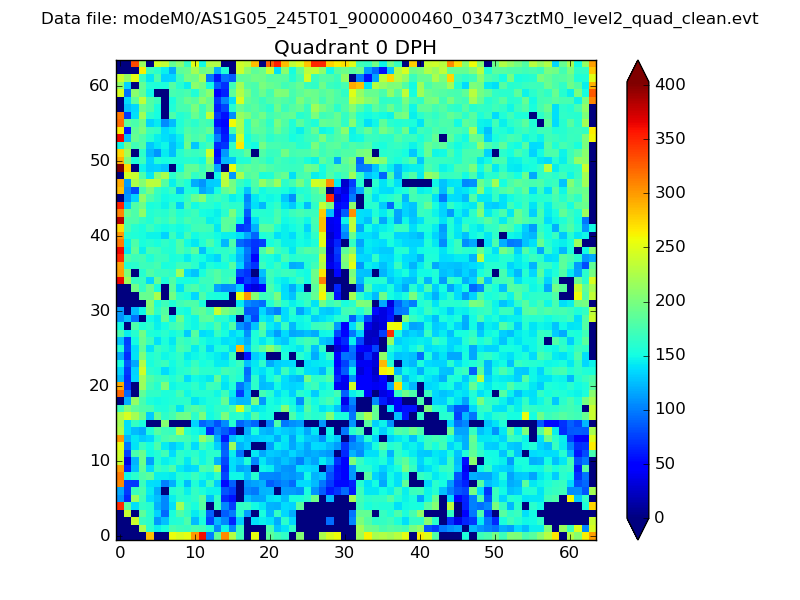 |
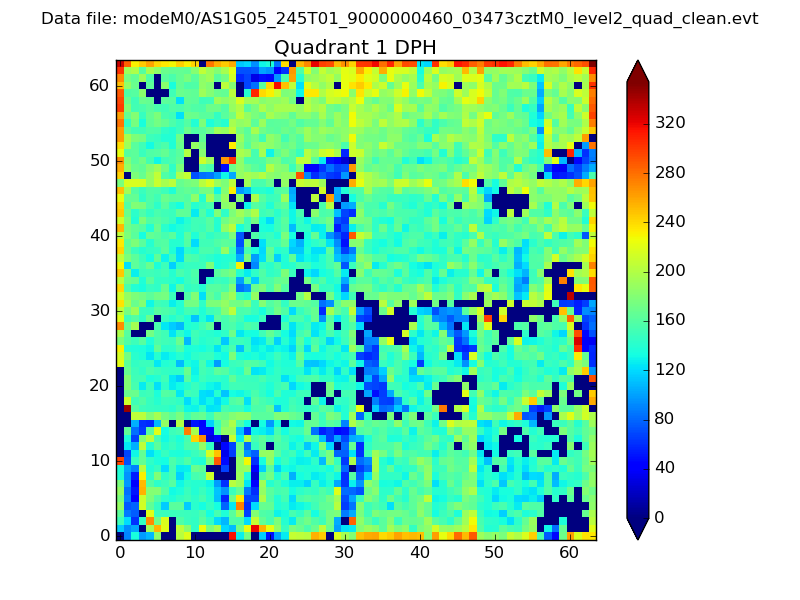 |
Quadrant B |
|---|---|---|---|
| Quadrant D | 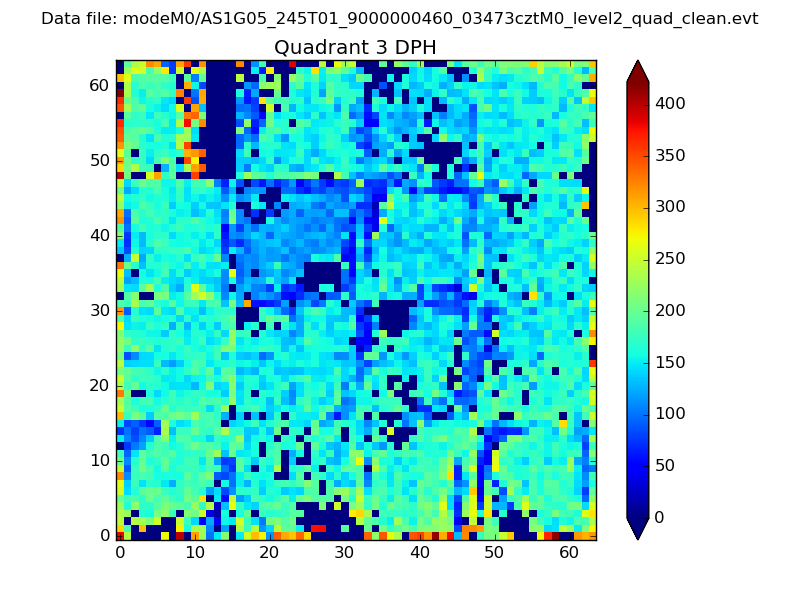 |
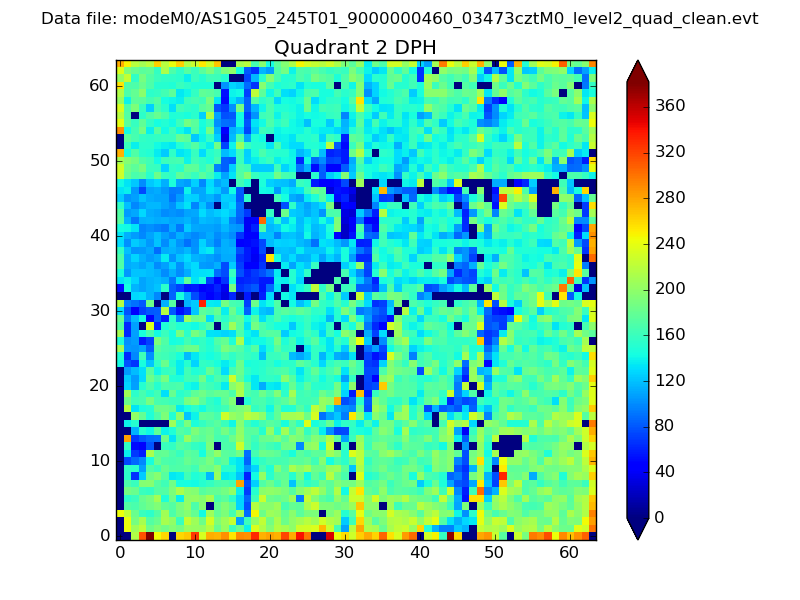 |
Quadrant C |
| Plot type | Count rate plots | Images |
|---|---|---|
| Comparison with Poisson distribution Blue bars denote a histogram of data divided into 1 sec bins. Red curve is a Poisson curve with rate = median count rate of data. |
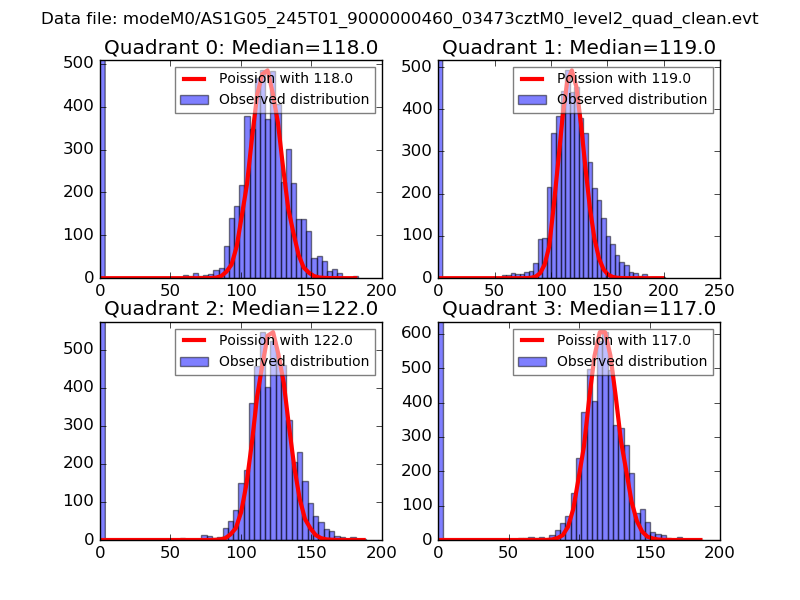 |
 |
| Quadrant-wise count rates Data is divided into 100 sec bins |
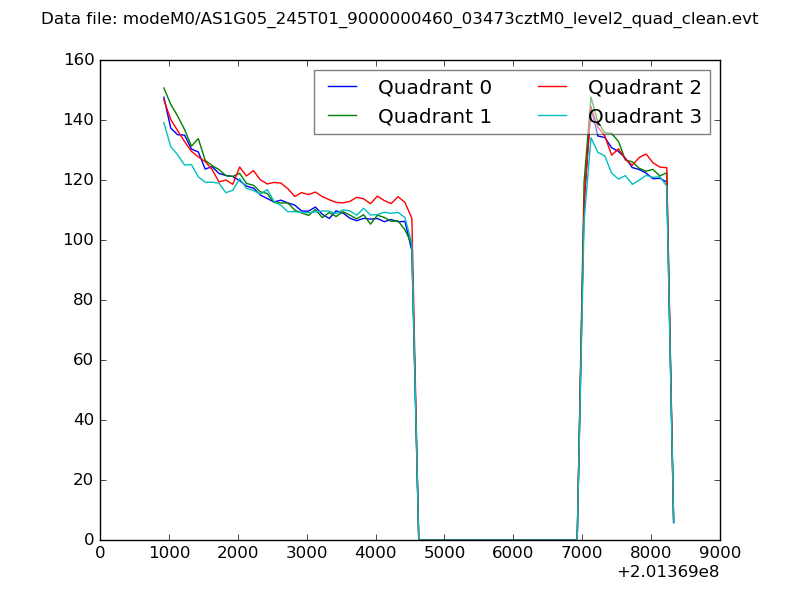 |
|
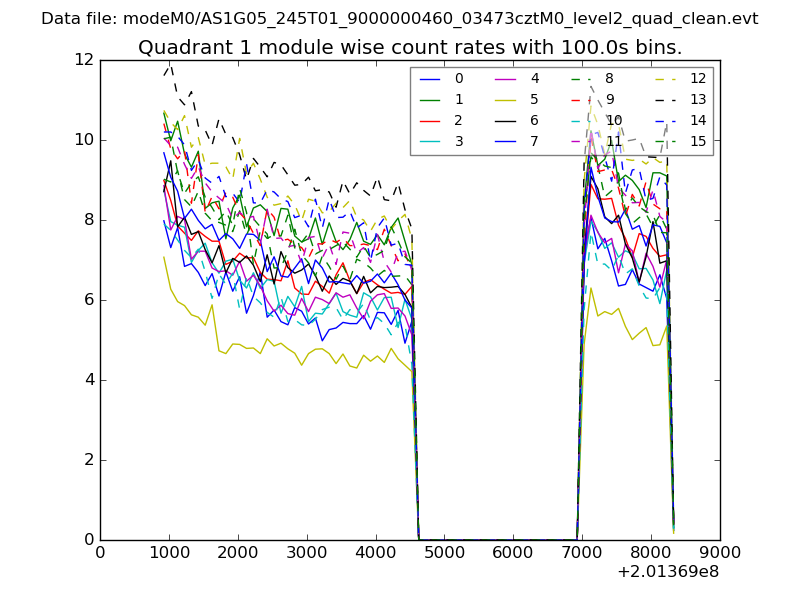
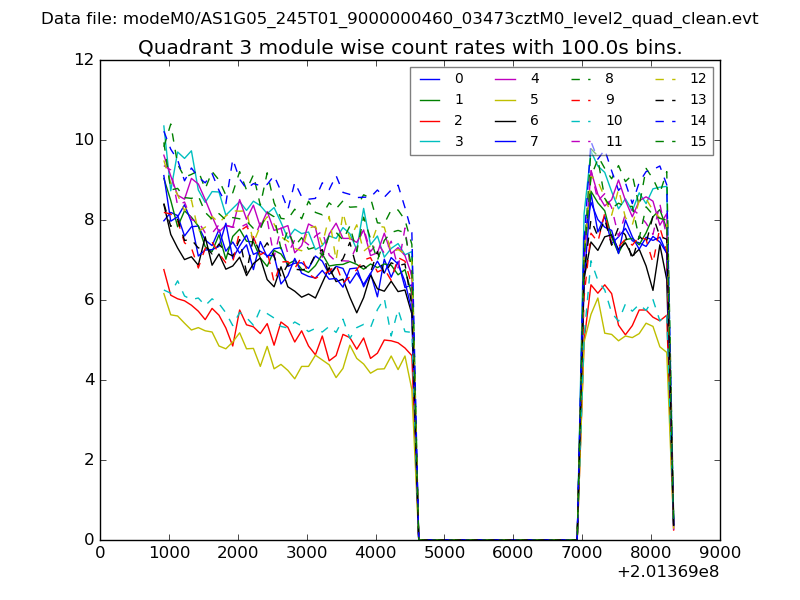
| Module-wise count rates for Quadrant A Data is divided into 100 sec bins |
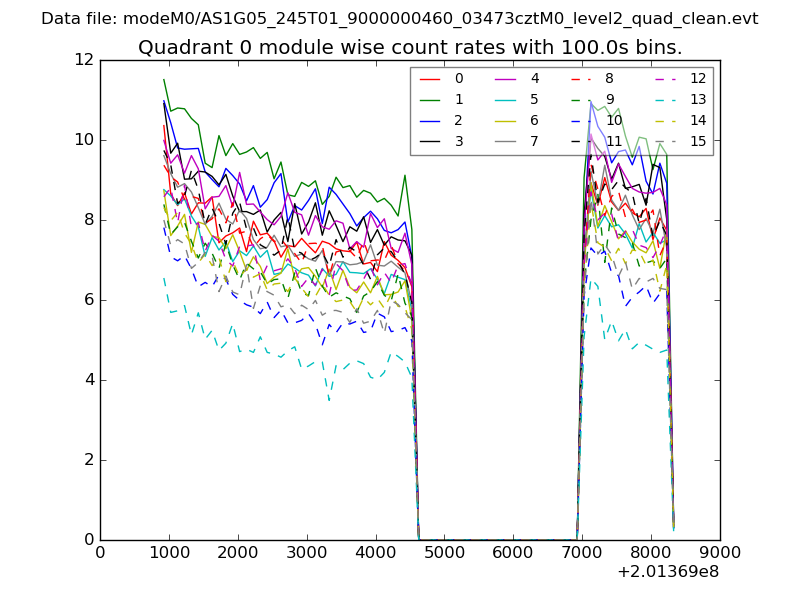 |
 |
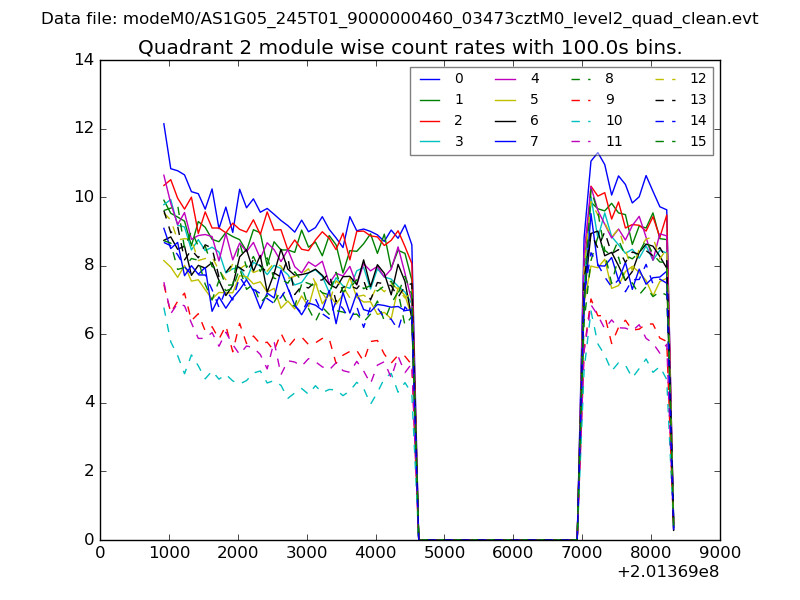
| Module-wise count rates for Quadrant B Data is divided into 100 sec bins |
 |
 |
| Module-wise count rates for Quadrant C Data is divided into 100 sec bins |
 |
 |
| Module-wise count rates for Quadrant D Data is divided into 100 sec bins |
 |
 |
| Parameter | Plot |
|---|---|
| CZT HV Monitor | 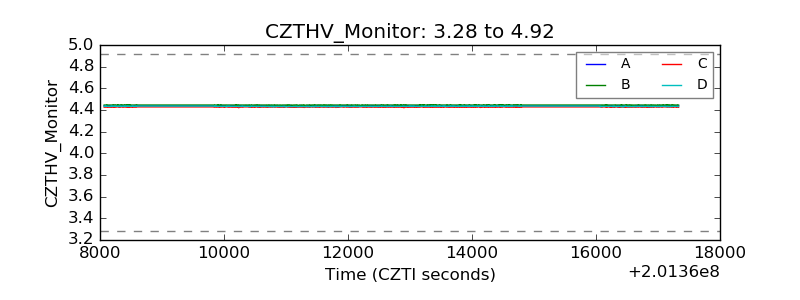 |
| D_VDD | 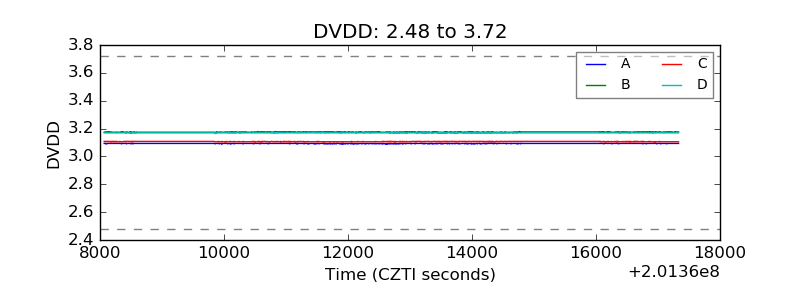 |
| Temperature 1 | 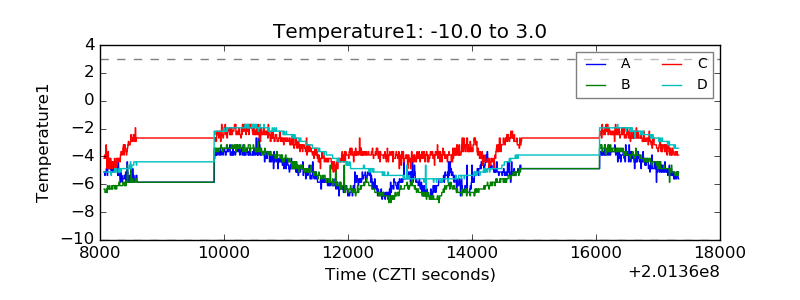 |
| Veto HV Monitor | 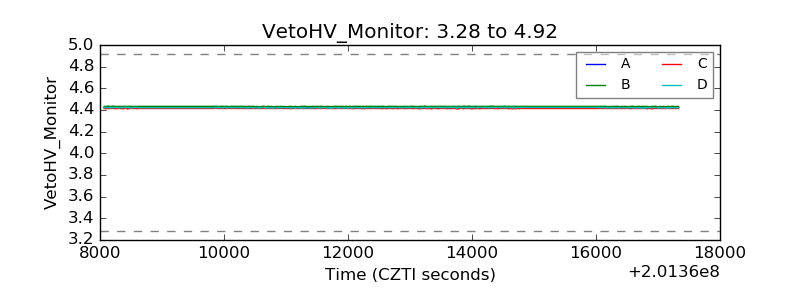 |
| Veto LLD | 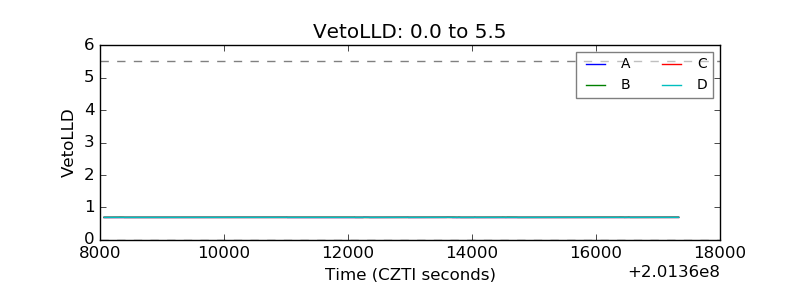 |
| Alpha Counter | 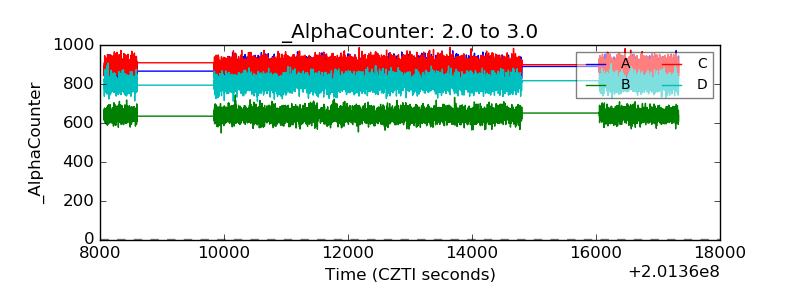 |
| _CPM_Rate | 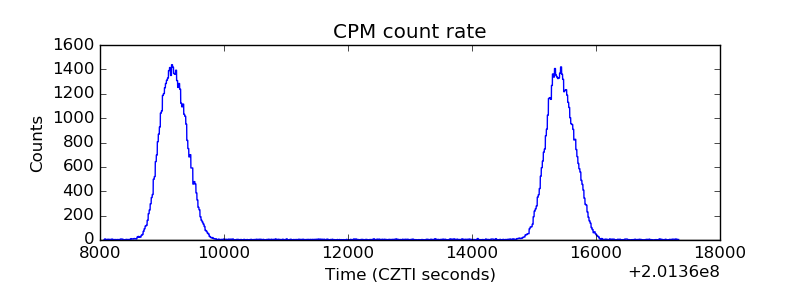 |
| CZT Counter | 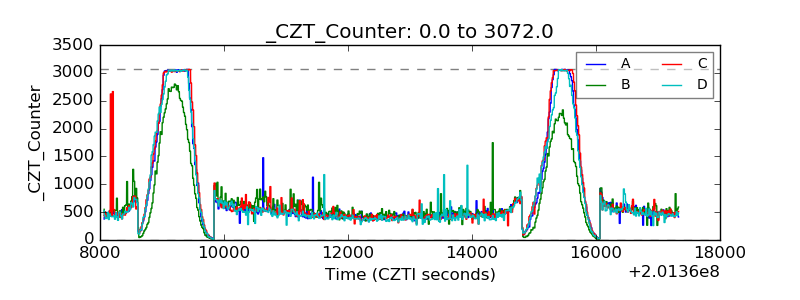 |
| +2.5 Volts monitor |  |
| +5 Volts monitor |  |
| Veto Counter | 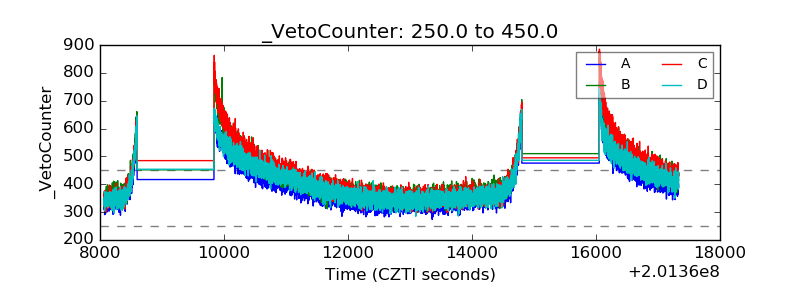 |