| Param | Original file | Final file |
|---|---|---|
| Filename | modeM0/AS1G05_245T01_9000000460_03474cztM0_level2.evt | modeM0/AS1G05_245T01_9000000460_03474cztM0_level2_quad_clean.evt |
| Size (bytes) | 450,129,600 | 88,364,160 |
| Size | 429.3 MB | 84.3 MB |
| Events in quadrant A | 3,749,631 | 549,477 |
| Events in quadrant B | 3,349,081 | 563,108 |
| Events in quadrant C | 3,056,025 | 574,036 |
| Events in quadrant D | 3,047,571 | 547,754 |
| Mode M0 | |||
|---|---|---|---|
| Quadrant | BADHDUFLAG | Total packets | Discarded packets |
| A | 0 | 15593 | 135 |
| B | 0 | 14119 | 134 |
| C | 0 | 13442 | 134 |
| D | 0 | 13685 | 134 |
| Mode SS | |||
|---|---|---|---|
| Quadrant | BADHDUFLAG | Total packets | Discarded packets |
| A | 0 | 132 | 0 |
| B | 0 | 132 | 0 |
| C | 0 | 132 | 0 |
| D | 0 | 132 | 0 |
| Mode M9 | |||
|---|---|---|---|
| Quadrant | BADHDUFLAG | Total packets | Discarded packets |
| A | 0 | 25 | 0 |
| B | 0 | 25 | 0 |
| C | 0 | 25 | 0 |
| D | 0 | 25 | 0 |
| Quadrant | Total seconds | Saturated seconds | Saturation percentage |
|---|---|---|---|
| A | 6321 | 214 | 3.385540% |
| B | 6321 | 89 | 1.408005% |
| C | 6321 | 80 | 1.265623% |
| D | 6321 | 99 | 1.566208% |
Noise dominated data is calculated using 1-second bins in cleaned event files. If a bin has >2000 counts, and if more than 50% of those come from <1% of pixels, then it is considered to be noise-dominated and hence unusable.
| Quadrant | # 1 sec bins | Bins with >0 counts | Bins with >2000 counts | High rate bins dominated by noise | Noise dominated (total time) | Noise dominated (detector-on time) | Marked lightcurve |
|---|---|---|---|---|---|---|---|
| A | 8861 | 6323 | 55 | 55 | 0.62% | 0.87% | 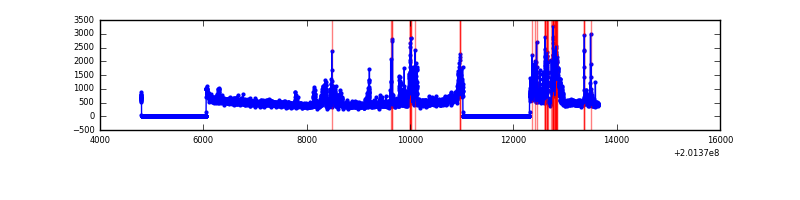 |
| B | 8861 | 6323 | 11 | 11 | 0.12% | 0.17% | 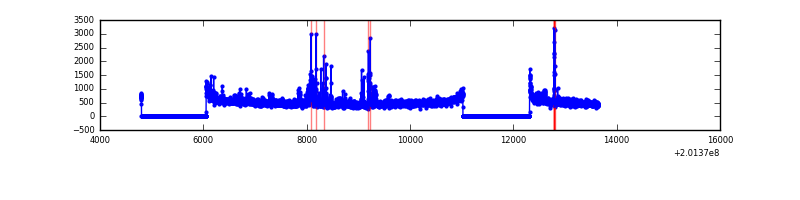 |
| C | 8861 | 6322 | 1 | 1 | 0.01% | 0.02% | 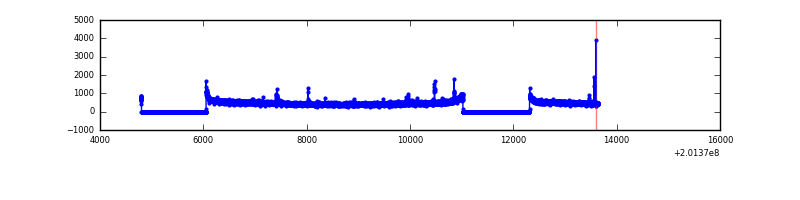 |
| D | 8861 | 6323 | 39 | 39 | 0.44% | 0.62% | 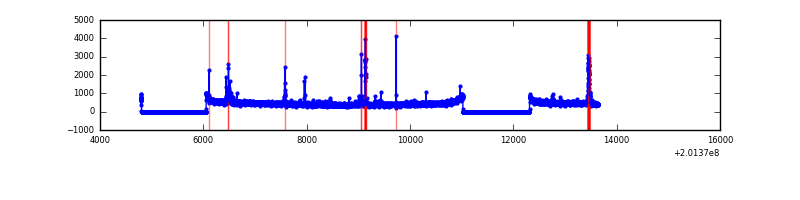 |
Top three noisy pixels from each quadrant. If the there are fewer than three noisy pixels in the level2.evt file, extra rows are filled as -1
| Pixel properties | Quadrant properties | ||||||
|---|---|---|---|---|---|---|---|
| Quadrant | DetID | PixID | Counts | Sigma | Mean | Median | Sigma |
| A | 0 | 118 | 323976 | 2100.73 | 756 | 742 | 153.9 |
| A | 15 | 234 | 320513 | 2078.22 | 756 | 742 | 153.9 |
| A | 0 | 50 | 110842 | 715.55 | 756 | 742 | 153.9 |
| B | 15 | 204 | 200011 | 1341.95 | 775 | 757 | 148.5 |
| B | 2 | 249 | 69706 | 464.36 | 775 | 757 | 148.5 |
| B | 15 | 85 | 46024 | 304.87 | 775 | 757 | 148.5 |
| C | 12 | 4 | 24971 | 138.28 | 762 | 770 | 175.0 |
| C | 1 | 192 | 14231 | 76.92 | 762 | 770 | 175.0 |
| C | 15 | 208 | 13531 | 72.92 | 762 | 770 | 175.0 |
| D | 2 | 107 | 64693 | 360.65 | 753 | 736 | 177.3 |
| D | 13 | 223 | 43183 | 239.36 | 753 | 736 | 177.3 |
| D | 13 | 46 | 40854 | 226.22 | 753 | 736 | 177.3 |
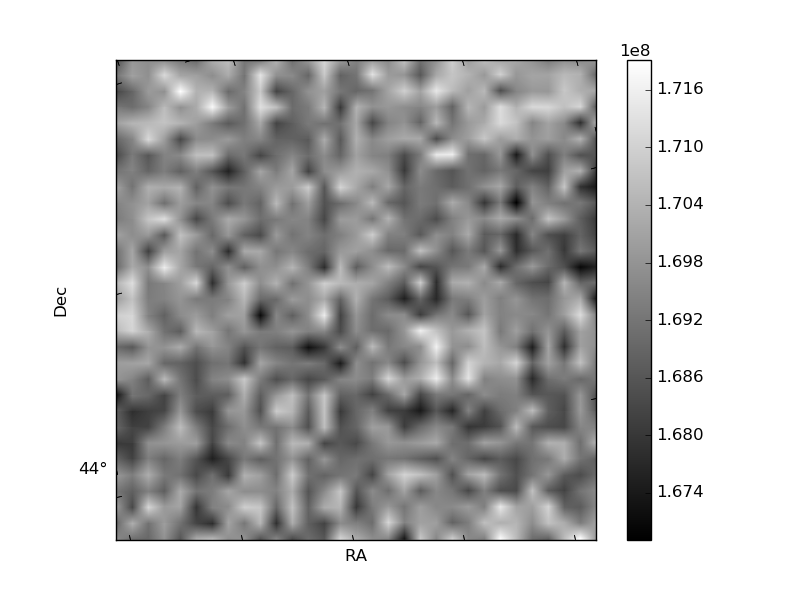
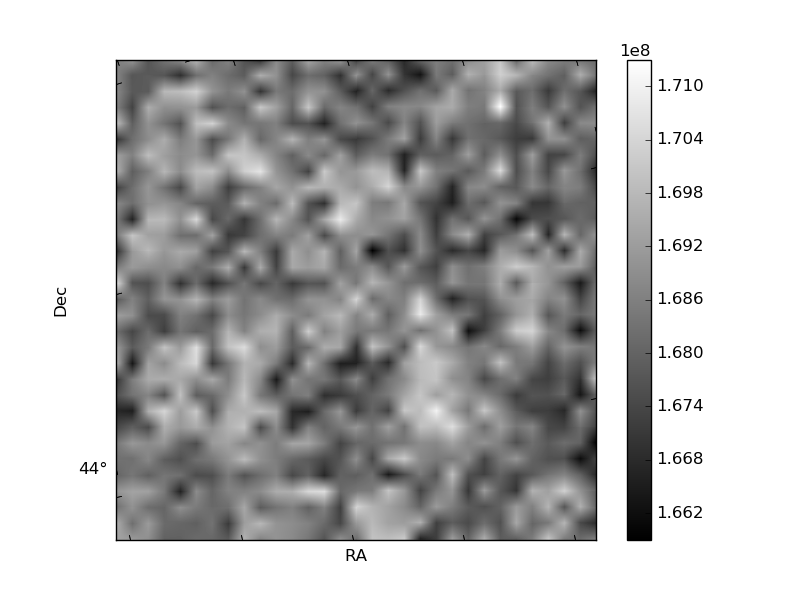
Histogram calculated using DETX and DETY for each event in the final _common_clean file
| Quadrant A | 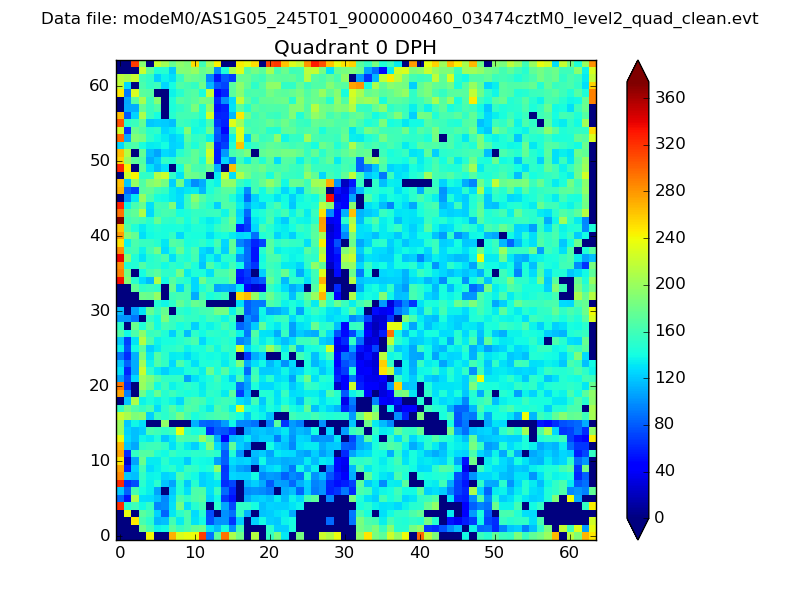 |
 |
Quadrant B |
|---|---|---|---|
| Quadrant D | 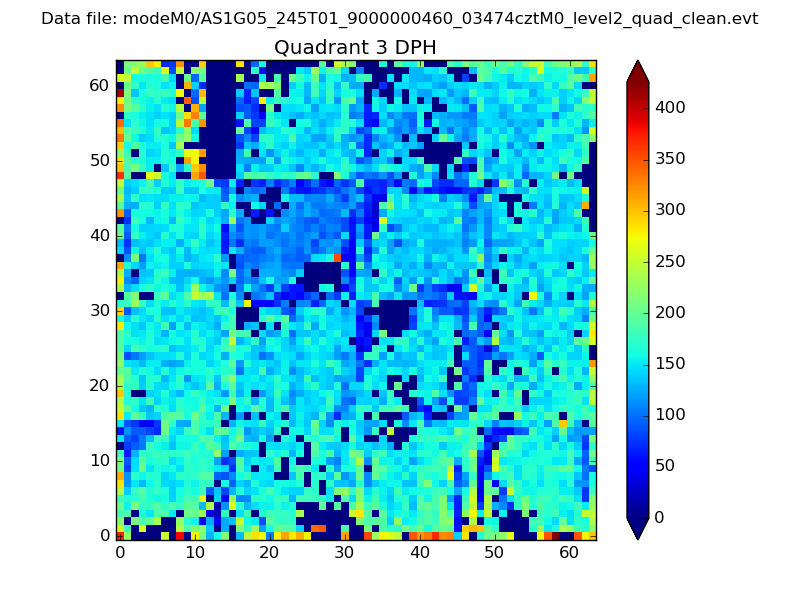 |
 |
Quadrant C |
| Plot type | Count rate plots | Images |
|---|---|---|
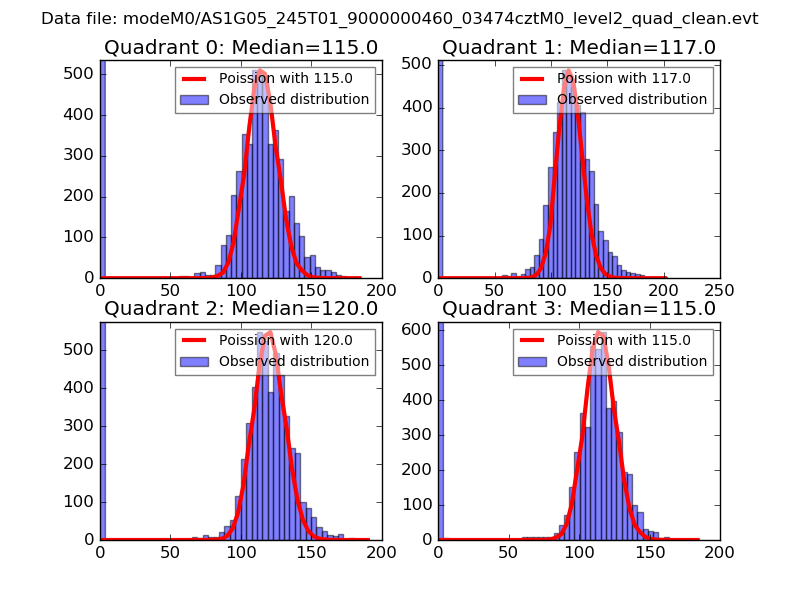
| Comparison with Poisson distribution Blue bars denote a histogram of data divided into 1 sec bins. Red curve is a Poisson curve with rate = median count rate of data. |
 |
 |
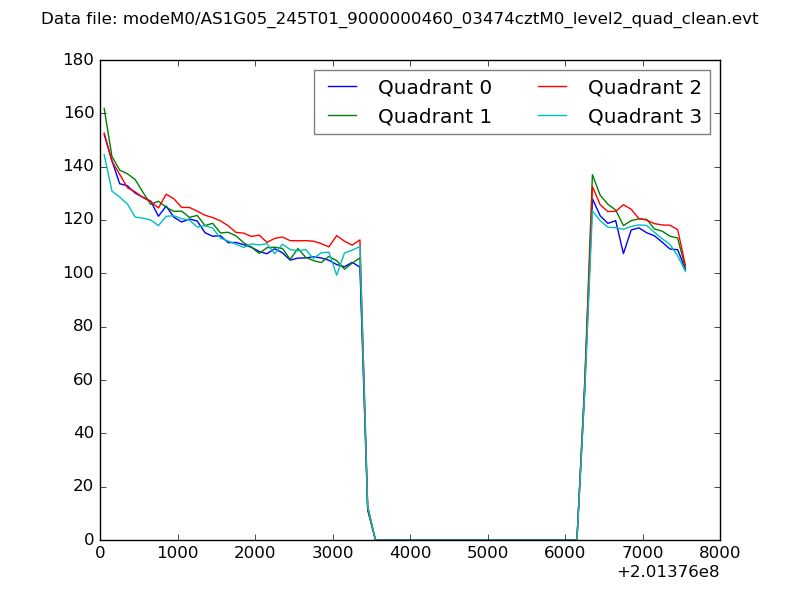
| Quadrant-wise count rates Data is divided into 100 sec bins |
 |
|
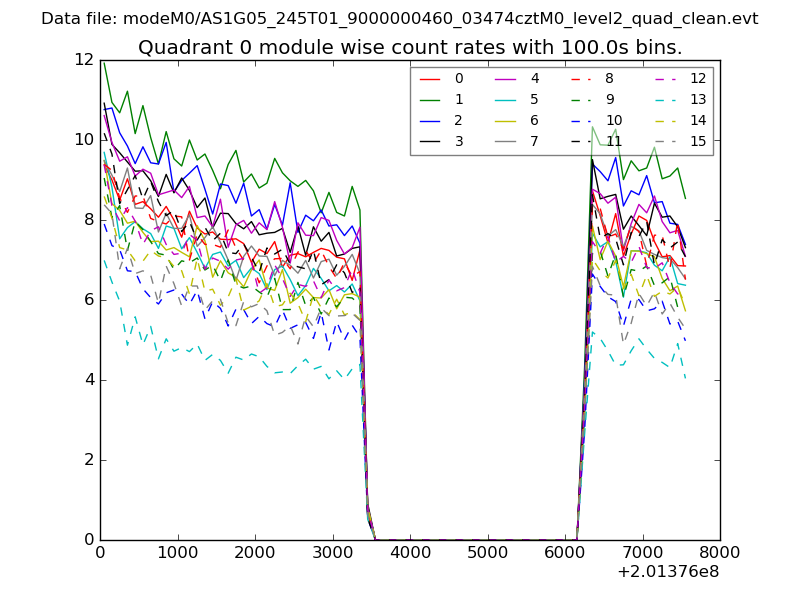
| Module-wise count rates for Quadrant A Data is divided into 100 sec bins |
 |
 |
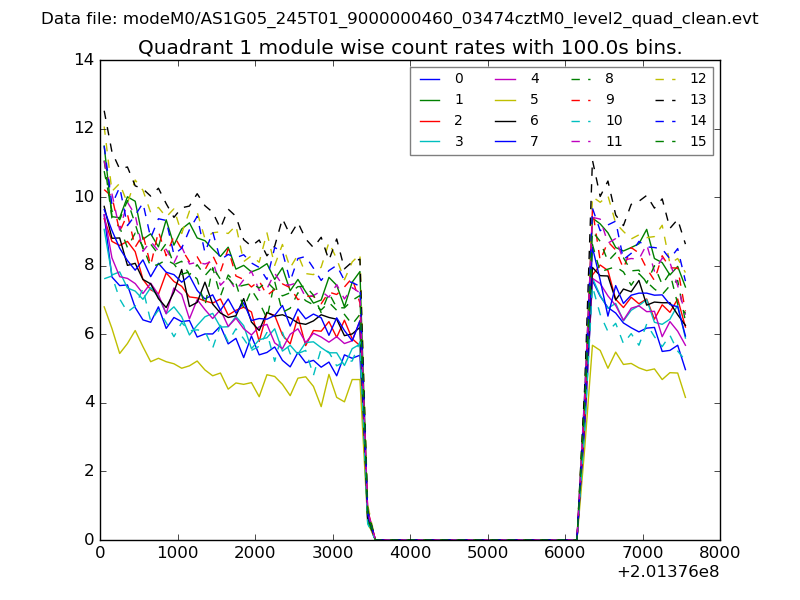
| Module-wise count rates for Quadrant B Data is divided into 100 sec bins |
 |
 |
| Module-wise count rates for Quadrant C Data is divided into 100 sec bins |
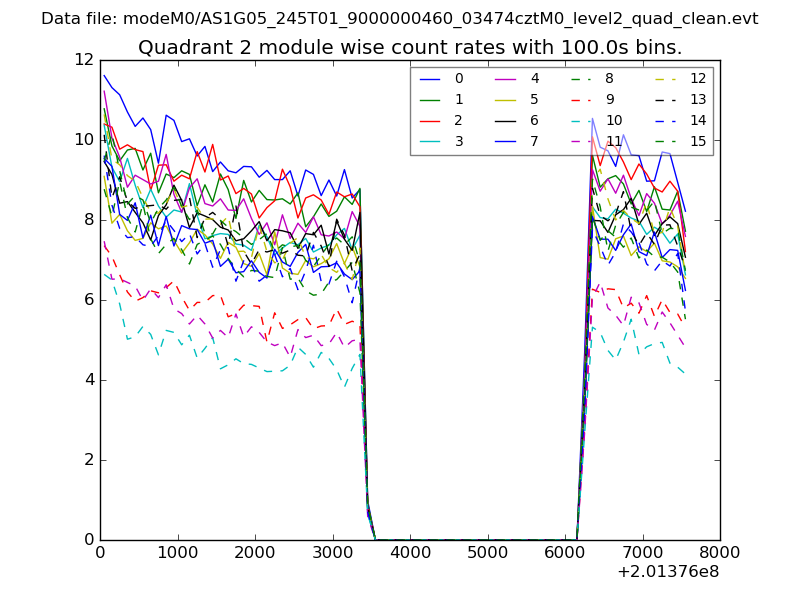 |
 |
| Module-wise count rates for Quadrant D Data is divided into 100 sec bins |
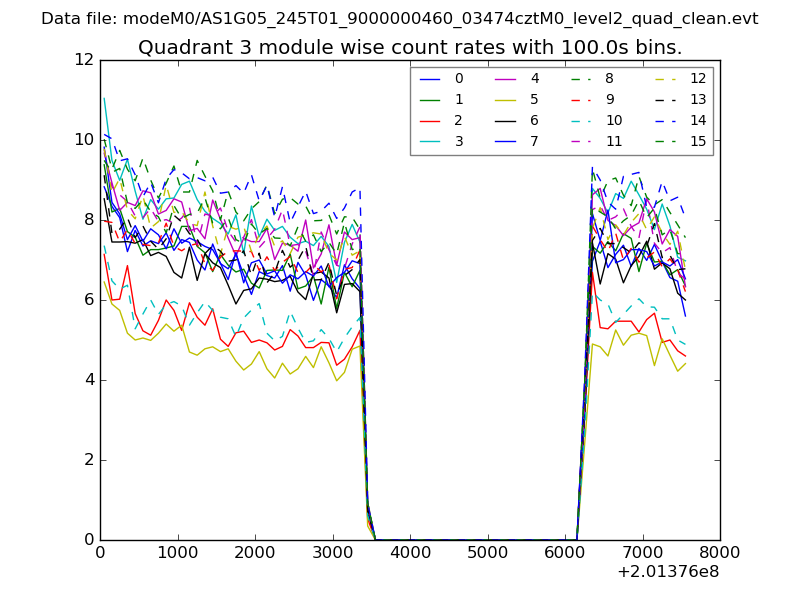 |
 |
| Parameter | Plot |
|---|---|
| CZT HV Monitor | 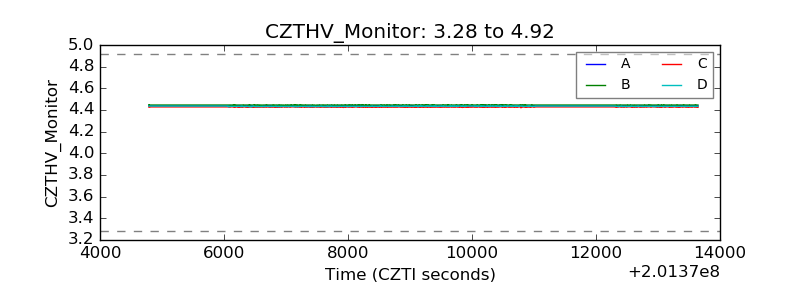 |
| D_VDD |  |
| Temperature 1 | 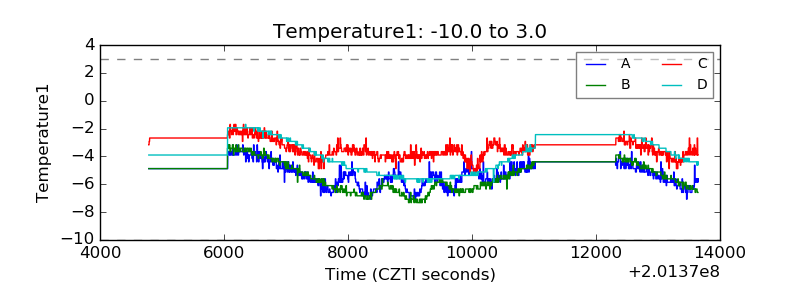 |
| Veto HV Monitor | 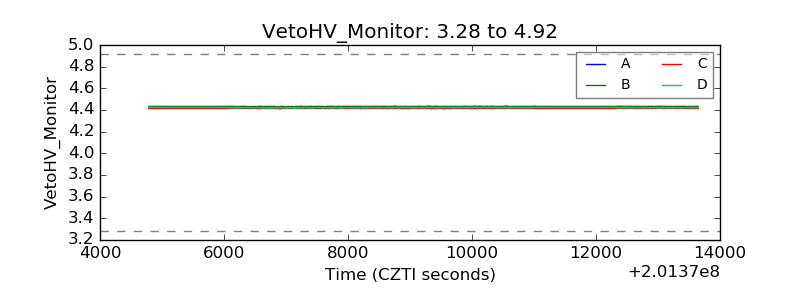 |
| Veto LLD | 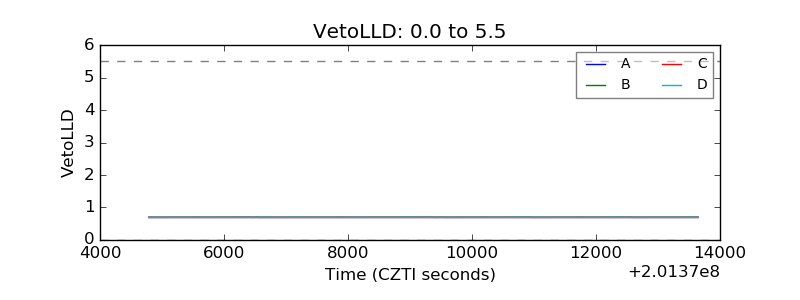 |
| Alpha Counter | 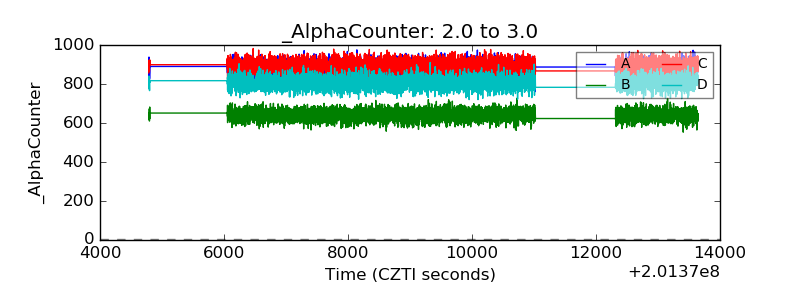 |
| _CPM_Rate | 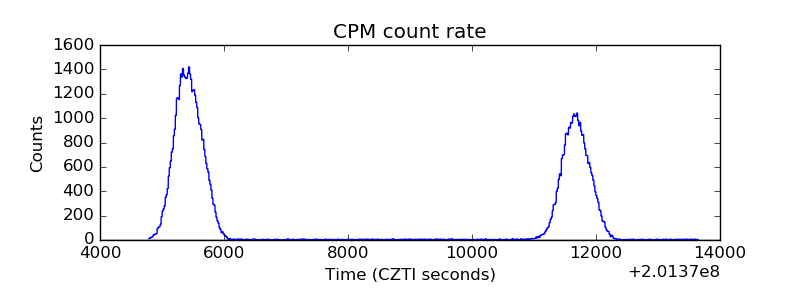 |
| CZT Counter |  |
| +2.5 Volts monitor |  |
| +5 Volts monitor | 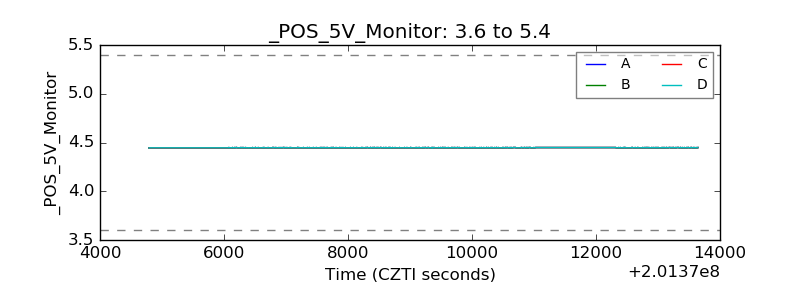 |
| Veto Counter | 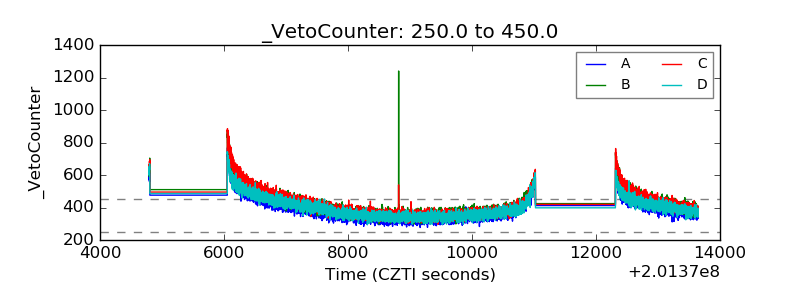 |